Abstract
Eukaryotic elongation factor 2 (eEF-2) is an important regulator of the protein translation machinery wherein it controls the movement of the ribosome along the mRNA. The activity of eEF-2 is regulated by changes in cellular energy status and nutrient availability, and posttranslational modifications such as phosphorylation and mono-ADP-ribosylation. However, the mechanisms regulating protein translation under conditions of cellular stress in neurons are unknown. Here we show that when rat hippocampal neurons experience oxidative stress (lipid peroxidation induced by exposure to cumene hydroperoxide; CH), eEF-2 is hyperphosphorylated and ribosylated resulting in reduced translational activity. The degradation of eEF-2 requires calpain proteolytic activity and is accompanied by accumulation of eEF-2 in the nuclear compartment. The subcellular localization of both native and phosphorylated forms of eEF-2 is influenced by CRM1 and 14.3.3, respectively. In hippocampal neurons p53 interacts with non-phosphorylated (active) eEF-2, but not with its phosphorylated form. The p53 – eEF-2 complexes are present in cytoplasm and nucleus, and their abundance increases when neurons experience oxidative stress. The nuclear localization of active eEF-2 depends upon its interaction with p53, as cells lacking p53 contain less active eEF-2 in the nuclear compartment. Overexpression of eEF-2 in hippocampal neurons results in increased nuclear levels of eEF-2, and decreased cell death following exposure to CH. Our results reveal novel molecular mechanisms controlling the differential subcellular localization and activity state of eEF-2 that may influence the survival status of neurons during periods of elevated oxidative stress.
Keywords: Eukaryotic elongation factor 2 (eEF-2), CRM1, 14.3.3, p53, lipid peroxidation, hippocampal neurons
INTRODUCTION
Proteins determine the structural and functional phenotypes of cells by regulating intrinsic metabolic and homeostatic processes, and the responses of cells to environmental signals. Rates of protein synthesis are influenced by a variety of factors including nutrient availability, energy metabolism, growth factors, aging and disease states [1–3]. When the organism and its cells are under energetic and oxidative stress, protein translation is limited to proteins critical for the survival and specific functions of the cells including an array of adaptive stress response proteins [4]. Neurons are particularly vulnerable to oxidative stress and associated membrane lipid peroxidation which can destabilize cellular calcium homeostasis and trigger apoptosis [5–7], a form of programmed cell death mediated, in part, by p53 [8]. Unmitigated lipid peroxidation contributes to the dysfunction and degeneration of neurons in both acute CNS injuries and neurodegenerative disorders including Alzheimer’s and Parkinson’s diseases [9]. Protein synthesis is a complex process that determines both qualitative and quantitative features of the proteome [1, 10]. If a particular protein is no longer required, inhibition of the initiation step of translation occurs; however, specific control of the elongation phase to rapidly alter production of particular proteins occurs under conditions such as heat shock, and stimulation by hormones and growth factors [11–16]. In addition, some diseases are caused by abnormalities in elongation factors [17].
Elongation factor-2 (eEF-2) is a fundamental regulatory protein of the translational elongation step [12] that catalyzes the movement of the ribosome along the mRNA. eEF-2 is regulated by several mechanisms including phosphorylation [12], mono-ADP-ribosylation [18,19], and protein-protein interactions [20,21]. A role for eEF-2 in cellular stress responses is highlighted by the fact that eEF-2 is sensitive to oxidative stress [22, 23] and that it must be active, at least transiently, in order to drive the synthesis of proteins that help cells mitigate the adverse effects of oxidative stress, or activate apoptosis if the extent of damage overwhelms repair capacity.
Here we elucidate roles for eEF-2 in cellular responses of neurons elicited by oxidative stress. We found that when exposed to low doses of cumene hydroperoxide (CH), a compound which induces membrane lipid peroxidation, eEF-2 undergoes calpain-mediated degradation, phosphorylation and ADP-ribosylation, and interaction with p53. The subcellular localization of eEF-2 is regulated by at least three proteins, 14-3-3, CRM1 and p53. Interaction of eEF-2 with p53 in the nucleus may facilitate neuronal recovery from sub-apoptotic levels of oxidative stress.
MATERIALS AND METHODS
Cell cultures
Cultures of hippocampal neurons were prepared from embryonic day 18 rat brains, as described previously [24]. Dissociated neurons were plated at a density of 5 ×10⁵cells/cm2 on dishes coated with polyethyleneimine. Neurons were grown in Neurobasal medium supplemented with B27 (Invitrogen, Carlsbad, CA). All experimental treatments were performed on 7-day-old cultures. HCT116 human colon carcinoma cells, and p53-null derivatives thereof, were supplied by Dr. B. Vogelstein [25] and were grown in McCoy’s medium with 10% fetal bovine serum at 37°C in a 5% CO2 atmosphere. Hippocampal neurons were pre-treated with or without 50 μM MDL28170 (Calbiochem, San Diego, CA) for 45 min or 50 μM E-64d (Calbiochem) for 3 h, followed by exposure to 0, 10 or 15 μM CH (Sigma, Aldrich, St. Louis, MO) for 3 h.
Cell viability
Cell viability was determined using a MTS assay (Promega, Madison, WI) and a LDH activity assay (Roche Cytotoxicity detection kit, Mannheim, Germany) according to the manufacturer’s instructions.
Determination of hydroperoxides using the FOX reagent
The protocol for lipid peroxidation measurements [26] was adapted for a microplate reader. Forty micrograms of proteins were incubated with 90 μl of H2SO4 for 30 min. Following addition of 100 μl FOX reagent (0.5 mM ferrous ammonium sulfate, 0.2 mM xylenol orange and 200 mM sorbitol in 25 mM H2SO4) the mixture was incubated at room temperature for 45 min, protected from light. The formation of ferric ions was detected by measuring the resulting colored complex with xylenol orange at 540 nm.
Immunoblot and immunoprecipitation analysis
Hippocampal neurons and cell lines were lysed in RIPA buffer (20 mM Tris-HCl, 150mM NaCl, 1 mM EDTA, 1 mM EGTA, 1% NP-40, 1% sodium deoxycholate, 2.5 mM sodium pyrophosphate and 1 mM sodium orthovanadate) containing protease inhibitors. The homogenized cells were centrifuged at 12,000×g for 20 min at 4 °C. Protein content of the samples was estimated with Pierce BCA Protein Assay Kit (Pierce Biotechnology, Rockfold, IL). Protein samples were separated by SDS-PAGE (10% acrylamide), and transferred to a nitrocellulose membrane (BioRad, Hercules, CA) at 120 V for 1 h. The membranes were incubated with blocking buffer (5% dry milk in 20 mM Tris–HCl, pH 7.5, 500 mM NaCl, 0.05% Tween 20) for 1 h at room temperature. Membranes were then incubated in blocking solution containing the following antibodies: eEF-2 (1:5000), phospho-eEF-2 (1: 1000) (Cell Signaling, Danvers, MA); β-actin (1:5000; Sigma); p53 (1:500), pan-14.3.3 (1:1000), hnRNP (1:2000) and α-tubulin (1:1000) (Santa Cruz Biotechnology, Santa Cruz, CA), overnight at 4°C. After incubation, the membranes were washed in 20 mM Tris–HCl, pH 7.5, 500 mM NaCl, 0.05% Tween 20 and incubated with peroxidase-conjugated anti-immunoglobulin secondary antibodies. The proteins were visualized using a chemiluminiscence kit from Pierce (Rockford, IL). The bands were analyzed by densitometry using the ImageJ analysis software (NIH).
Immunoprecipitation of proteins was performed on a rotator overnight at 4 °C using 800 μg cell lysate and either 4.0 μg of anti-p53, anti-eEF-2, or appropriate IgG as control, and the Catch and Release Reversible Immunoprecipitation system (Upstate Biotechnology, Billerica, MA) according to the manufacturer’s protocol. The proteins were eluted in 70 μl of elution buffer, and 20 μl were subjected to SDS-PAGE and immunoblot analysis.
ADP-ribosylation assay
The assay was performed as described previously [27]. Briefly, 50 μg of cell lysates were incubated in ADP-ribosylation buffer (20 mM Tris-HCl, 1 mM EDTA, 50 mM DTT; pH 7.4) with 500 ng of FP59 and 5 μM 6-Biotin-17-NAD (Trevigen, Gaithersburg, MD) for 30 min at 37°C. Samples were separated by SDS-PAGE followed by immunoblotting. The biotin-ADP-ribose-eEF-2 complexes were detected using streptavidin-IR conjugate antibody (Rockland Immunochemicals, Gilbertsville, PA) and a Typhoon 9400 scanner (GE Healthcare, Pittsburgh, PA).
Subcellular fractionation
Hippocampal neurons were subfractionated as described previously [28]. Briefly, neurons were centrifuged at 20,000 × g for 20 s at 4°C and resuspended in buffer A (10 mM HEPES, 2 mM MgCl2, 15 mM KCl, 0.1 mM EDTA, 0.1% NP-40, 1 mM DTT; pH 7.6) containing protease inhibitors and incubated 7 min on ice. HCT116 human colon carcinoma cells were subfractionated as described previously [29]. Cells were incubated on ice for 10 min in 800 μl of lysis buffer containing 20 mM Tris (pH 7.5), 100 mM KCl, 5 mM MgCl2, 0.3% IGEPAL CA-630 and protease inhibitors. Cells were centrifuged at 1,000 × g for 10 min to separate the cytoplasmic fraction of the cell extract. The nuclei were lysed by incubation on ice for 45 min with RIPA buffer containing protease inhibitors. The lysate was then centrifuged at 20,000 × g for 20 min. The resulting supernatant was used as the nuclear fraction of the cell extract. The subcellular fractions were separated by SDS-PAGE and analyzed by immunoblots using antibodies against cytoplasmic and nuclear marker proteins.
Nascent protein synthesis assay
HCT116 cells were plated on 6-well plates, pretreated with CH, washed with warm PBS, and supplemented with methionine-free D-MEM (Invitrogen, Grand Island, NY) medium for 35 min to deplete methionine reserves, after which 50 μM L-azidohomoalanine (AHA)(Invitrogen) was added for 30 min. The cells were lysed and proteins were extracted by ultrasonication in RIPA buffer containing protease inhibitors. AHA-incorporating proteins were labeled with tetramethylrhodamine (TAMRA) using Click-iT Protein Reaction Buffer Kit (Invitrogen). The TAMRA-labeled proteins in the gel were assayed using a Typhoon 9400 scanner (GE Healthcare).
Immunofluorescence
For immunostaining, hippocampal neurons were plated at a density of 5 × 10⁴ cells/cm2 on 18-mm diameter round glass coverslips in 12-well plates. After experimental treatment periods the cells were fixed with either methanol: acetone (1:1) and were then permeabilized in 0.5% Triton X-100 for 10 min, rinsed with PBS, and incubated for 1 h with 10% donkey serum. The cells were incubated with the primary antibodies/antiserum overnight at 4°C in the blocking solution. The immunocomplexes were detected using Alexa Fluor 488 (green)-conjugated or Alexa Fluor 546 (red)-conjugated secondary antibodies (1:1000; 1 h incubation at room temperature). Nuclei were counterstained with 4′, 6′-diamidino-2-phenylindole (DAPI; Vector Laboratories Inc., Burlingame, CA). Image analysis was performed using a Zeiss 510 confocal laser scanning microscope.
In vitro phosphatase assay
Hippocampal neurons or cells lines were fractionated (cytoplasm and nucleus) in phosphatase buffer (50 mM Tris-HCl, pH 8, 150 mM NaCl, 2 mM MgCl2, 1% NP-40 and protease inhibitor cocktail) in the absence of phosphatase inhibitors. Lysates were incubated with either buffer alone, 0.3 U/ml protein phosphatase 2A (PP2A) (Millipore) or 0.3 U/ml PP2A plus 50 nM okadaic acid (OA) (Calbiochem), for 25 min at 30°C.
Cell transfection and neuronal infection
Cells were transfected with 10 μg of p53-Flag or vector control using Fugene 6 (Promega Corporation, Madison, WI) according to the manufacturer’s instructions. Cells were collected for immunoblot analysis 24 h post transfection. Lentiviruses were produced using either eEF-2 over-expression plasmid (Applied Biomaterials Inc., Richmond BC, Canada) or control plasmid and a calcium phosphate protocol [30]. Briefly, 293T cells were transfected the morning following plating by incubating in 1 ml of calcium phosphate precipitate containing 20 μg of the transfer vector, 15 μg of the packaging plasmid and 5 μg of the envelope plasmid. The medium was replaced 24 h post-transfection, and three days later it was harvested, centrifuged and filtered through a 0.45 μm mesh. Lentiviruses were concentrated by centrifugation in a 20% sucrose cushion at 19,000 rpm for 2 h (4°C) in a swinging bucket rotor (Beckman SW28). The pellet was suspended in PBS, aliquoted and frozen at −80°C until use. Hippocampal neurons were plated at a density of 5×10⁵cells/cm2 on dishes coated with polyethyleneimine. On day 6, the neurons were infected for 72 h.
Statistical analysis
Data are shown as the mean ± SEM. Graph plotting and statistical analysis used Graph Pad Prism Version 5.03 (Graph Pad Software). Statistical evaluation was performed by one-way ANOVA, followed by Tukey’s test or by two-way ANOVA. A p-value of ≤ 0.05 was considered to be significant.
RESULTS
Effects of CH on lipid peroxidation and cell viability
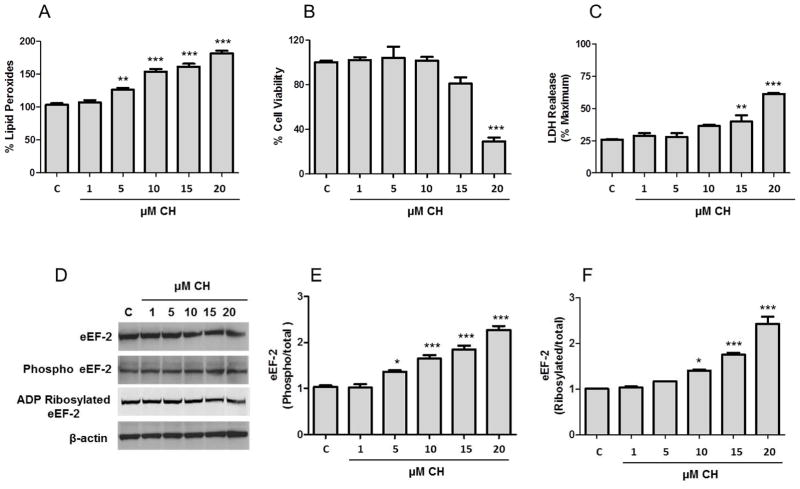
Hippocampal neurons were treated for 3 h with increasing concentrations of CH (1, 5, 10, 15 and 20 μM). CH treatment increased the production of lipid peroxides in a concentration dependent manner, with 5 μM being the lowest concentration that resulted in a significant increase in lipid peroxide levels (Fig. 1A). Compared to neurons not treated with CH, levels of lipid peroxides were elevated by 26 – 82% in cells exposed to 5– 20 μM CH. By MTS assay cell viability was significantly decreased only with 20 μM CH (29% compared to control), but not by lower concentrations of CH (Fig. 1B). Similarly necrotic cell death assayed as LDH release, was observed only in neurons exposed to the highest two concentrations of CH (Fig. 1C). Together, our results show that treatment of neurons with 5 – 10 μM CH increases lipid peroxidation without affecting cell viability.
Figure 1.
Subtoxic levels of lipid peroxidation increase phosphorylation and ADP-ribosylation of eEF-2 levels in primary hippocampal neurons. Cultures of hippocampal neurons were incubated with increasing concentrations of CH for 3 h. A. Lipid peroxidation assay was determined using the FOX method. B. Cell viability was measured by MTS assay. C. Necrosis was measured by lactate dehydrogenase (LDH) release assay. The results for values in A, B and C are the mean and SEM from five experiments. **p<0.01 and ***p<0.001 vs. control. D. The levels of total eEF-2, phosphorylated eEF-2, ADP ribosylated eEF-2 and β-actin were detected as described in the Materials and Methods. E and F. Optical densities of the phosphorylated/total eEF-2 bands (E) and ADP ribosylated/total eEF-2 (F). Values are the mean and SEM of four experiments. *p< 0.05 and ***p<0.001 vs. control.
Oxidative stress increases the phosphorylation and ADP-ribosylation of eEF-2
CH produced a concentration-dependent decrease in total eEF-2 levels (Fig. 1D and supplementary Figure 1); levels decreased by 12 – 36% in cells after treatment with 5 – 20 μM CH. However, treatment of neurons with CH increased phosphorylated eEF-2 levels in a concentration-dependent manner. The ratio of phosphorylated to total eEF-2 increased significantly (Fig. 1E): 1.4-fold (5 μM), 1.6-fold (10 μM), 1.8-fold (15 μM) and 2.2-fold (20 μM).
To determine the ADP-ribosylatable portion of eEF-2, biotin-NAD was used as source of ADP-ribose. Hippocampal neurons exposed to CH exhibited a significant increase of the ratio of ribosylated to total eEF-2 with respect to control, 1.4-fold (10 μM), 1.7-fold (15 μM) and 2.4-fold (20 μM) (Fig. 1F). These results show that subtoxic levels of lipid peroxidation increase phosphorylation and ADP-ribosylation of eEF-2 levels in primary hippocampal neurons.
Calpains mediate oxidative stress-induced degradation of eEF-2
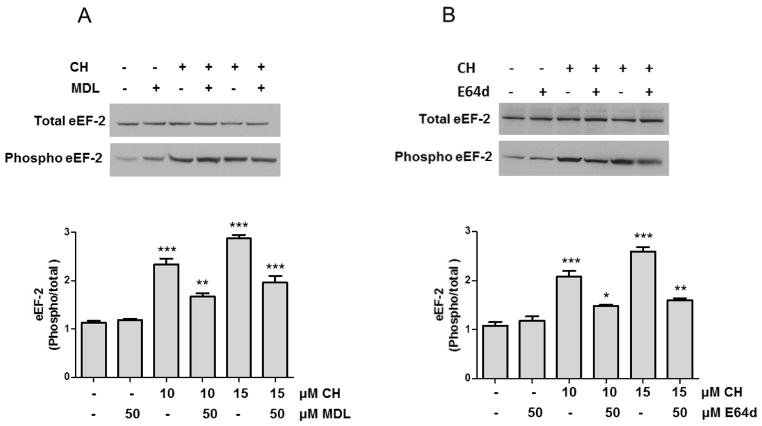
Because eEF-2 protein levels decreased relatively rapidly (within 3 h) in response to CH exposure, we determined whether proteases were involved. We employed two protease inhibitors: MDL28170 a potent, cell-permeable inhibitor of calpains I and II (50 μM) [31]; and E64d an inhibitor of calpain I (50 μM) [32]. Pre-treatment of cells with either of the calpain inhibitors prevented the CH-induced decrease in eEF-2 levels, (Fig. 2A, B and supplementary Figure 2). Based on these results the calpains could mediate degradation of eEF-2 in neurons subjected to lipid peroxidation.
Figure 2.
Evidence that calpains mediate degradation of eEF-2 in neurons subjected to lipidperoxidation. A and B. Hippocampal primary cultures were pre-treated with 50 μMMDL28170 (MDL) (A) or 50 μM E64d (B) and were then exposed to 10 or 15 μM CH for 3 h. Graphs show quantitation of optical density of the phosphorylated/total eEF-2 bands. Values are the mean and SEM of four experiments. *p< 0.05, **p<0.01 and ***p<0.001 vs. control.
Subcellular localization of eEF-2
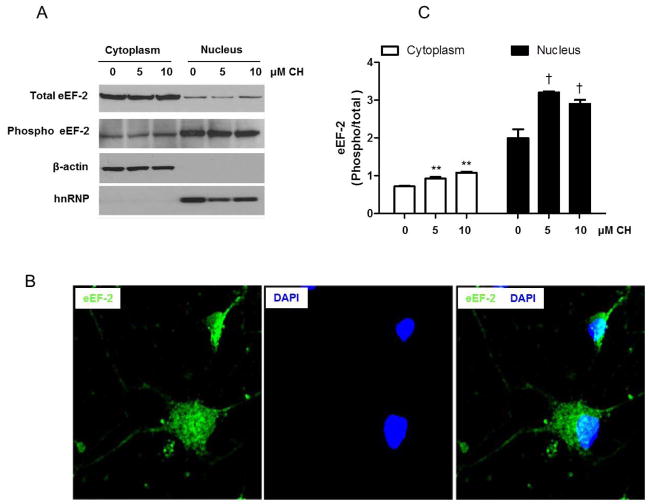
To determine whether the subcellular localization of eEF-2 was altered in response to oxidative stress, we treated hippocampal neurons with CH or vehicle, isolated nuclear and cytosolic fractions from the cells, and performed immunoblot analysis of total and phosphorylated eEF-2. In vehicle-treated control neurons, eEF-2 was present in both the cytoplasm and nucleus, with relative levels of eEF-2 being higher (70%) in the cytoplasm (Fig. 3A). The latter biochemical results are consistent with the immunofluorescence studies in which localization of eEF-2 was detected in the cytoplasm and nucleus by confocal microscopy in hippocampal neurons (Fig. 3B and supplementary Figure 3). To know whether lipid peroxidation affects the localization of eEF-2, we evaluated levels of total eEF-2 and phosphorylated eEF-2 in cytoplasmic and nuclear extracts of hippocampal neurons treated with 5 or 10 μM CH. The ratio of phosphorylated to total eEF-2 increased significantly in both the cytoplasm and nucleus, with the magnitude of the increase being greater in the nuclear fraction (Fig. 3C).
Figure 3.
Evidence of subcellular localization of eEF-2 in primary hippocampal neurons. A. Subcellular fractionation and immunoblot analysis of total and phosphorylated eEF-2, β-actin (cytoplasmic marker) and hnRNP (nuclear marker) were performed as described in the Materials and Methods on hippocampal primary cultures untreated, or treated with 5 or 10 μM CH for 3 h before separation into a cytoplasmic and a nuclear fraction. B. Confocal images of eEF-2 immunoreactivity in cultured hippocampal neurons (green). Cells were counterstained with 4′,6-diamidino-2-phenylindole (DAPI; blue) to identify nuclei. Data are representative of three independent neuronal cultures. C. Optical densities of the phosphorylated/total eEF-2 bands in cytoplasm and nucleus. Values are the mean and SEM of four experiments. **p<0.01 vs. control in cytoplasm and †p<0.05 vs. control in nucleus.
Evidence that eEF-2 interacts with p53
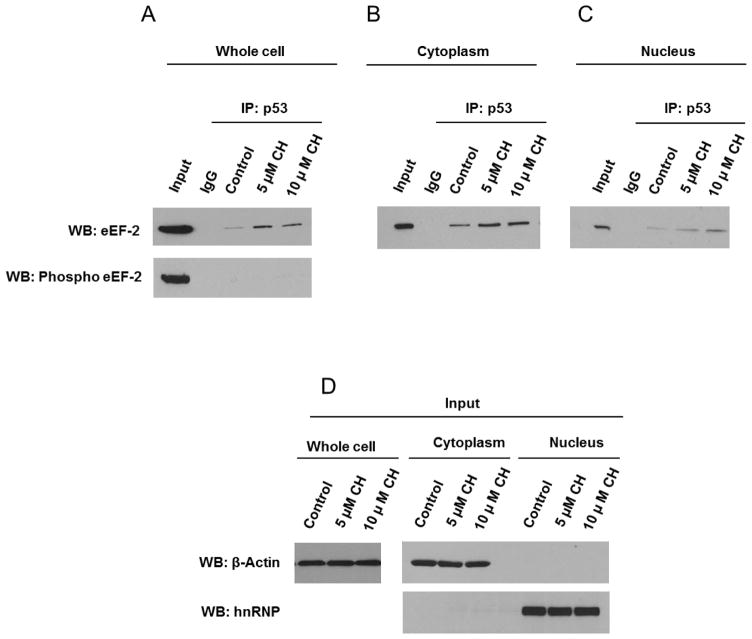
It was previously reported that p53 can interact with eEF-2 in the cytosol in non-neuronal cells [22]. We carried out IP-western blot analysis of whole-cell extracts to determine whether eEF-2 interacts with p53 in hippocampal neurons, and if it is affected by oxidative stress conditions. Treatment with CH resulted in a concentration-dependent increase of the eEF-2 -p53 interaction observed under basal conditions (Fig. 4A). However, no detectable interaction was observed between p53 and the inactive phosphorylated form of eEF-2 under any of the experimental conditions (Fig. 4A). eEF2 and p53 complexes were found in both the cytoplasmic and nuclear fractions with a similar dose-dependent response to exposure to CH in both compartments (Fig. 4B–D).
Figure 4.
p53 interacts with eEF-2 in cytoplasm and nucleus of primary hippocampal neurons. A – C. Whole-cell (A), cytoplasmic (B) and nuclear (C) extracts from hippocampal primary cultures treated with CH for 3 h were subjected to immunoprecipitation (IP) with p53 antibody or with control IgG and analyzed by immunoblotting for eEF-2 or phosphorylated eEF-2. D. The levels of β-actin (cytosolic marker) and hnRNP (nuclear marker) were detected by immunoblot analysis to ensure optimal fractionation. Data are representative of observations from four independent experiments.
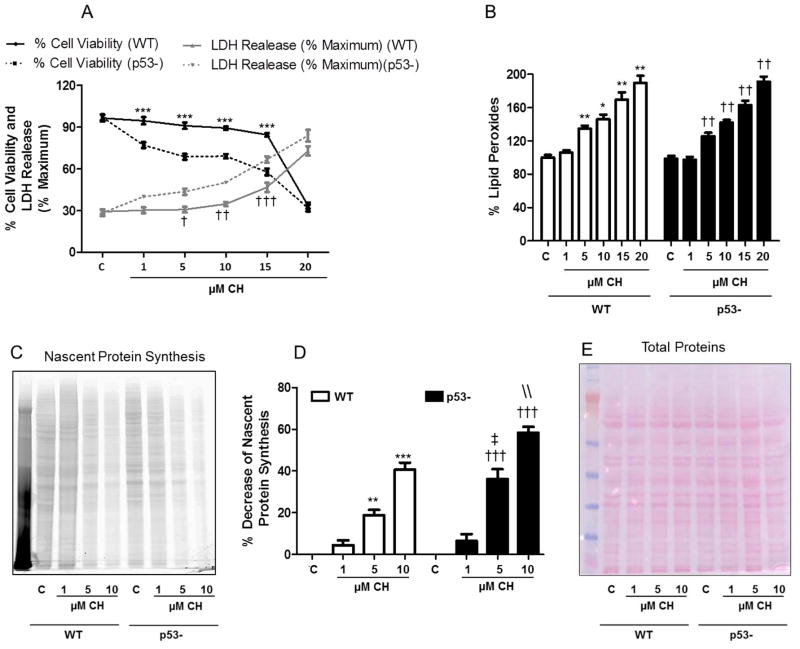
In order to understand the possible role of the p53 – eEF-2 interaction, HCT116 cells were treated with CH. Our results show p53-deficient cells were more sensitive to CH such that cultures exposed to 1–15 μM of CH exhibited decreases in cell viability (MTS assay) of 17– 27%, compared with cells expressing p53 (Fig. 5A). Similarly, CH treatment resulted in significantly more LDH release from p53-deficient cells compared to cells expressing p53; LDH levels in the culture medium were increased by 13–20% with 5–15 μM CH. (Fig. 5A). No difference was observed in the levels of lipid peroxidation induced by CH between wild-type and p53 knockout cells (Fig. 5B).
Figure 5.
Evidence that p53-deficient cells are more sensitive to lipid peroxidation. Wild-type (WT) or p53-deficient cells (p53-) were incubated for 3 h in the presence of CH at indicated concentrations. A. Cell viability was measured by the MTS assay and cell death was measured based on lactate dehydrogenase (LDH) release assay as described in the Materials and Methods. Values are the mean and SEM of 4 experiments. ***p<0.001 (cell viability),†p<0.05, ††p<0.01and †††p<0.001 (cell death); wild-type vs. p53-deficient cells. B. Lipidperoxidation levels were determined using the FOX method. Values are the mean and SEM of 5 experiments. *p< 0.05 and **p<0.01 vs. wild-type control. ††p<0.01 vs. p53-deficient cell control. C – E. To directly determine the effects of CH on nascent proteins, wild-type (WT) and p53-deficient cells (p53-) were pretreated with CH, supplemented with methionine-free D-MEM and L-azidohomoalanine (AHA) to label the newly synthesized proteins. C. After electrophoresis the gels were analyzed using a Typhoon 9400 scanner (GE Healthcare), fluorescence excitation (545 nm) and emission (580 nm). D. Nascent protein synthesis in WT and p53-deficient cells (p53-) treated with CH. Values are the mean and SEM of 4 experiments and the bars represent the band density integrated over all bands. E. Nitrocellulose membrane was stained with Ponceau Red.**p< 0.01 and ***p<0.001 vs. Wild-type control, ††p<0.01and †††p<0.001 vs. p53-deficient cells control, ‡‡ p<0.01 vs. Wild-type 5 μM CH and \\ p< 0.01vs. Wild-type 10 μM CH.
To directly determine the effects of CH on nascent proteins synthesis, we used the methionine analogue AHA to label newly synthesized proteins. Under oxidative stress conditions we observed a decrease in nascent protein synthesis in both wild-type and p53-deficient cells, with the magnitude of the decrease being greater in p53-deficient cells (Fig. 5C, D). These results were not a consequence of loading a different amount of protein in each well, as demonstrated by staining of the membranes with Ponceau red (Fig. 5E)
Roles of p53, 14.3.3 and CRM1 in the subcellular localization of eEF-2
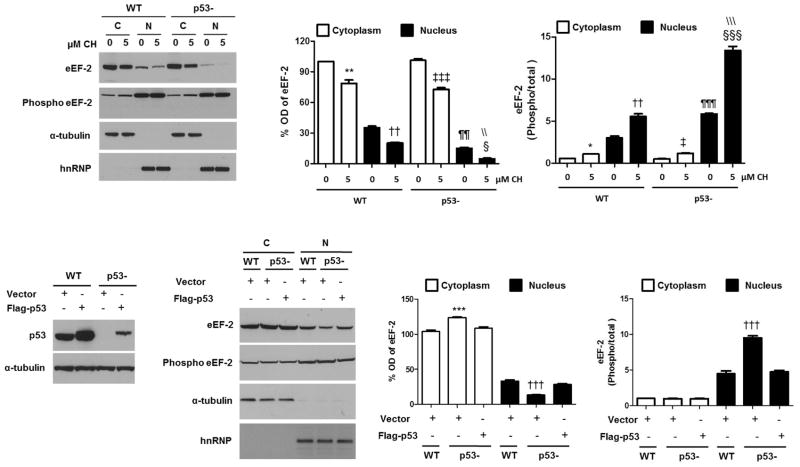
We measured relative levels of total and phosphorylated eEF-2 in cytoplasmic and nuclear extracts of wild-type andp53-deficient cells treated with 5 μM CH. Cytoplasmic and nuclear levels of total eEF-2decreased in response to CH in both wild-type and p53-deficient cells (Fig. 6A, B). In all cases significant differences were observed between controls and 5 μM CH (p<0.01 for all comparisons). Total eEF-2 levels were higher in wild-type nuclear extracts, compared to p53-deficient nuclear extracts in both control (2.4-fold) and CH-treated (4.5-fold) cells. The ratio of phosphorylated/total eEF-2 was increased in response to CH in both wild-type and p53-deficient cells (Fig. 6C). In all cases the phosphorylated/total eEF-2 ratio was higher in nuclear extracts. In wild-type cells, the phosphorylated/total eEF-2 ratio in the nucleus was 5.4-fold (control) and 5.0-fold (5 μM CH) greater compared to the cytoplasm. In the case of p53-deficient cells, the phosphorylated/total eEF-2 ratios in the nuclear fraction were 11.5-fold (control) and 11.3-fold (1 μM CH) higher compared to the cytoplasm.
Figure 6.
p53 is involved in subcellular trafficking of non-phosphorylated eEF-2 into the nucleus. A. Subcellular fractionation and analysis of total and phosphorylated eEF-2 levels in nuclear and cytoplasmic fractions of wild type and p53-deficient cells treated with CH. α-tubulin and hnRNP were used as cytoplasmic and nuclear markers. B. Optical density of the eEF-2 bands. Values are the mean and SEM of 4 experiments. **p< 0.01 vs. cytoplasmic extracts from wild-type control, ††p<0.01 vs. nuclear extracts from wild-type control, ‡‡‡ p<0.001 vs. cytoplasmic extracts from p53-deficient cells control, § p<0.05 vs. nuclear extracts from p53-deficient cells control, ¶¶ p< 0.01 vs. nuclear extracts from wild-type control and \\ p< 0.01 vs. nuclear extracts from wild-type 5 μM. C. Optical density of the phosphorylated/total eEF-2 bands. Values for band intensity ratios are the mean and SEM of 4 experiments. *p< 0.05 vs. cytoplasmic extracts from wild-type control, ††p<0.01 vs. nuclear extracts from wild-type control, ‡ p<0.05 vs. cytoplasmic extracts from p53-deficient cells control, §§§ p<0.001 vs. nuclear extracts from p53-deficient cells control, ¶¶¶ p< 0.001 vs. nuclear extracts from wild-type control and \\\ p< 0.001 vs. nuclear extracts from wild-type 5 μM.HCT116 cells were transfected with a fixed amount of plasmid expressing Flag-p53. D. Immunoblots for p53 and α-tubulin are shown. E. Analysis of the total and phosphorylated eEF-2 levels in nuclear and cytoplasmic fractions of wild-type and p53-deficient cells after transfection (α-tubulin and hnRNP were used as cytoplasmic and nuclear markers, respectively. F and G. Optical densities of the eEF-2 total bands (F) and phosphorylated/total eEF-2 ratio (G). Values are the mean and SEM from three independent transfections. ***p< 0.001 vs. cytoplasmic extracts from p53-deficient cells. †††p<0.001 vs. nuclear extracts from p53-deficient cells.
Next, to study the possible influence of p53 on eEF-2 subcellular localization, wild-type, p53-deficient cells and p53-deficient cells transfected with p53-flag (Fig. 6D) were fractionated, and basal eEF-2 levels were analyzed in nuclear and cytoplasmic fractions by immunoblot. The results showed lower levels of eEF-2 with higher phosphorylation rates in nuclear fractions (2.3-fold) of p53-deficient cells compared to wild-type cells (Fig. 6E–G), a phenomena completely reverted by the reconstitution with exogenous p53-flag (Fig. 6E–G). Overall these results suggest that p53 is directly or indirectly involved in subcellular trafficking of non-phosphorylated eEF-2 into the nucleus.
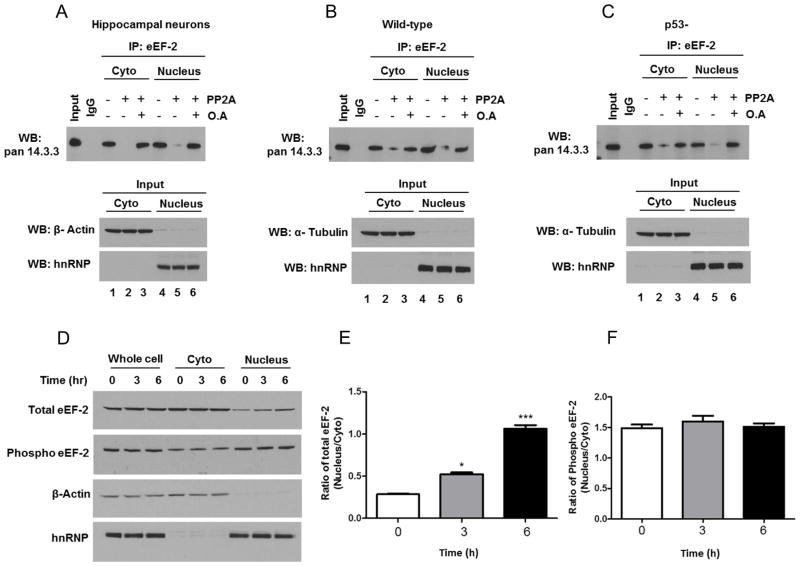
It was previously reported that eEF-2 can interact with the protein 14-3-3 [20]. We found that eEF-2 and 14-3-3 complexes are present in both the cytoplasmic and nuclear fractions in hippocampal primary cultures (Fig. 7A). Given that most reported interactions of 14-3-3 are mediated by phosphorylated Ser or Thr residues present in their target proteins, we examined whether phosphorylation of eEF-2 was required for binding to 14-3-3. We treated soluble cytoplasmic and nuclear extracts prepared from hippocampal neurons with protein phosphatase 2A, and then performed IP - immunoblot analysis with eEF-2 and 14-3-3 antibodies. eEF-2 binding to 14-3-3 was almost abolished after phosphatase treatment, but it was maintained when the extract was pretreated with the phosphatase inhibitor okadaic acid (Fig. 7A). This result suggests that the interaction of eEF-2 with 14-3-3 depends on the phosphorylation status of eEF-2.
Figure 7.
Evidence for the differential involvement of 14-3-3 protein and CRM1 in the subcellular localization of total and phosphorylated eEF-2. A– C. Hippocampal primary cultures (A), and HCT116 cells expressing (B) or lacking (C) p53, were fractionated (cytoplasm and nucleus), pre-treated for 25 min at 30°C in phosphatase buffer supplemented with protein phosphatase 2A (PP2A) or with protein phosphatase 2A and okadaic acid (OA), subjected to immunoprecipitation (IP) with eEF-2antibody or with control IgG, and analyzed by immunoblotting with a 14-3-3 antibody. β-actin and hnRNP were used as cytoplasmic and nuclear markers (bottom). Data are representative of four independent experiments. D. Hippocampal neurons were treated with 50 nM Leptomycin B. After 3 or 6 h, neurons were collected and separated into cytoplasmic and nuclear fractions, and analyzed by SDS-PAGE followed by immunoblot. β-actin and hnRNP were used as cytoplasmic and nuclear markers.E. Optical density of the ratio nucleus/cytoplasm total eEF-2bands. Values are the mean and SEM of four experiments. *p<0.05, ***p<0.001 vs. control. F. Optical density of the ratio nucleus/cytoplasm phosphorylated eEF-2 bands.
To study whether or not the association between eEF-2 and 14-3-3 depends on the presence of p53, cytoplasm and nuclear extracts of wild-type and p53-deficient cells were analyzed by IP-immunoblot assay. We found that the eEF-2 interaction with 14-3-3 occurs independently of the presence of p53 (Fig. 7B. C).
To further understand the mechanism(s) that controls the subcellular localization of eEF-2, we employed Leptomycin B, an inhibitor of CRM1-dependent nuclear protein export. Immunoblot analysis showed a significant increase of the nuclear/cytoplasm ratio of total eEF-2 in hippocampal neurons in response to Leptomycin B treatment (1.8-fold and 3.7-fold during 3 hand 6 h treatments, respectively (Fig. 7D, E). However, the ratio of nuclear/cytoplasm phosphorylated eEF-2 was unaffected by Leptomycin B treatment (Fig. 7F). These results suggest that the subcellular localization of non-phosphorylated eEF-2 is influenced by p53 and CRM1, while phosphorylated eEF-2 subcellular localization is regulated by 14.3.3.
Overexpression of eEF-2 increases neuronal survival
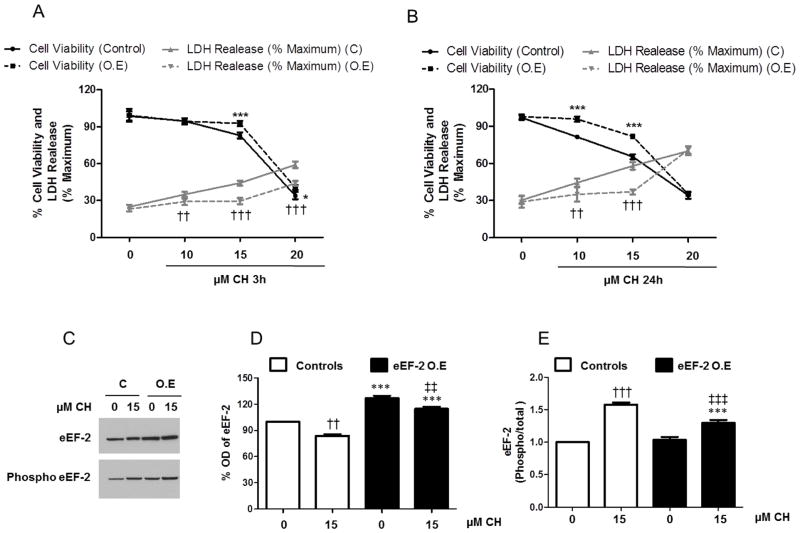
To determine whether eEF-2 over-expression in primary neurons could affect cell survival in response to oxidative stress, we analyzed cell viability and necrotic cell death in hippocampal neurons 72 h post-infection with either eEF-2 over-expressing or control lentiviruses, and then treated for 3 and 24 h with increasing concentrations of CH (10, 15 and 20 μM). Overexpression of eEF-2 increased cell viability 10% (15 μM CH) and 7% (20 μM CH) at 3 h after CH treatment, and 14% (10 μM CH) and 16% (15 μMCH) at 24 h after CH treatment (Fig. 8A, B). Similarly, eEF-2 over-expression in primary neurons led to a decrease of necrotic cell death assayed as LDH release of 6% (10 μM CH), 15% (15 μM CH) and 15% (20 μM CH) at 3 h after treatment with CH, and 9% (10 μM CH) and 21% (15 μM CH) at 24 h after treatment with CH. To determine the efficiency of the over-expression and how it effects eEF-2 subcellular localization in response to oxidative stress, we treated hippocampal neurons 72 h post-infection with 15 μM CH or vehicle for 3 h, then analyzed the whole-cell lysates, cytosolic and nuclear fractions by immunoblot using total and phosphorylated eEF-2. In whole lysates levels of eEF-2were increased about 26% compared to control infected neurons, and remained substantially higher even after treatment with CH (Fig. 8C, D). Furthermore, the ratio of phosphorylated to total eEF-2 in eEF-2 infected neurons was significantly lower, (28%), after treatment with 15 μM CH (Fig. 8E).
Figure 8.
The nuclear increase of functional (non-phosphorylated) eEF-2 may play a role in mediating neuronal survival following mild oxidative stress. A and B. Hippocampal neurons 72 h postinfection with control or eEF-2-expressing lentiviruses were treated for 3 h (A) or 24 h (B) with increasing concentrations of CH(10, 15 and 20 μM). Cell viability was measured by MTS assay and necrotic cell death was measured based on lactate dehydrogenase (LDH) release assay. Values are the mean and SEM of four independent infections. ***p<0.001, *p<0.05 (cell viability), ††p<0.01and †††p<0.001(cell death) Control (C) vs. eEF-2 overexpression (O.E). C – E. Hippocampal neurons were infected with control or eEF-2-expressing lentiviruses and treated with 15 μM CH or vehicle for 3h. Immunoblots for total and phosphorylated eEF-2 (C), and quantification of total eEF-2 (D) and phosphorylated/total eEF-2 (E). Values are the mean and SEM of four independent infections. ***p<0.001 Control vs. eEF-2 overexpression (O.E.), †††p<0.001 and ††p<0.01 vs. Control non-treated with CH, ‡‡‡p<0.001 and ‡‡ p<0.01 vs. eEF-2 overexpression (O.E.) non-treated with CH.
The analysis of the subcellular fractions showed that the overall nuclear levels of eEF-2 were higher in neurons infected with eEF-2 lentivirus (Fig. 9A, B), and the ratio of phosphorylated to total eEF-2 was significantly lower under basal conditions (1.4-fold) and under the oxidative stress condition (1.9-fold; 15 μM CH) (Fig. 9C). These results suggest that the nuclear increase of functional (non-phosphorylated) eEF-2 may play an important role in mediating neuronal survival following mild oxidative stress.
Figure 9.
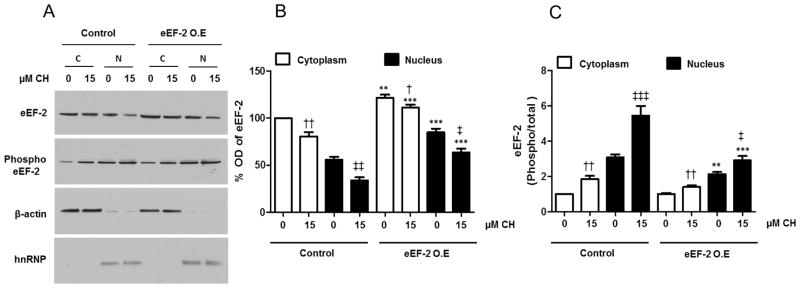
Evidence of efficiency of the over-expression and its effect on eEF-2 subcellular localization in hippocampal neurons subjected to oxidative stress. A. Immunoblots for total and phosphorylated eEF-2 in nuclear and cytoplasmic fractions are shown. β-actin and hnRNP were used as cytoplasmic and nuclear markers. B and C. Optical densities of the total eEF-2 band (B) and the phosphorylated/total eEF-2 bands (C) in nuclear and cytoplasmic fractions. Values are the mean and SEM of four independent infections. ***p<0.001, ** p<0.01, *p<0.05 Control (C) vs. eEF-2 overexpression (O.E.), ††p<0.01 vs. the value for cytoplasm of control cells not treated with CH. ‡‡‡ p<0.001 vs. the value for nucleus of control cells not treated with CH.
DISCUSSION
Our findings show that the subcellular localization and activity of eEF-2 are altered in response to membrane lipid peroxidation by mechanisms involving phosphorylation and ADP ribosylation of eEF-2, as well as interactions of eEF-2 with p53, 14-3-3 and CRM1. In agreement with its well-characterized role in protein translation, we found that in hippocampal neurons under basal conditions, active eEF2- is predominantly located in the cytoplasm, while a smaller nuclear portion consists mostly of Thr56-phosphorylated eEF-2. Exposure of hippocampal neurons to subtoxic levels of CH resulted in an overall decrease in levels of non-phosphorylated (active) eEF-2, and increase of phosphorylated eEF-2 (inactive).
These results in primary hippocampal neurons are consistent with studies of non-neural cells in which oxidative stress suppressed protein synthesis by a mechanism involving reduction of total eEF-2 levels [33] and an increase of phosphorylated eEF-2 (inactive). The regulation of the eEF-2 translational activity by phosphorylation has been extensively studied in non-neuronal cell types, and it occurs in response to certain hormones, nutrient availability, and stress [34, 14]. The inhibition of global protein synthesis is a common response to stress conditions. This serves to slow down protein synthesis and thus conserve energy under such circumstances [12, 13, 36, 37].
Phosphorylation of eEF-2 is catalyzed by several enzymes including eEF-2 and AMP kinases [11, 12] and its main consequence is the inhibition of translation because phosphorylation interferes with its binding to the ribosome and mRNA. Previous studies have shown that membrane lipid peroxidation can destabilize cellular Ca2+ homeostasis in neurons, resulting in increased Ca2+ influx through glutamate receptor channels and voltage-dependent Ca2+ channels [5] and apoptosis [6]. Treatment of hippocampal neurons with two different calpain inhibitors prevented the reduction of eEF-2 levels that otherwise occurred in response to exposure to CH. Thus, it is likely that the lipid peroxidation caused by CH results in elevated intracellular Ca2+ levels and calpain activation which, in turn, suppresses eEF-2 activity and reduces protein synthesis. In addition to increased inactivation of eEF-2, we also observed a shift towards more nuclear eEF-2 in cells treated with CH. We therefore endeavored to elucidate the molecular mechanisms that determine the subcellular localization of eEF-2, and their potential involvement in neuronal responses to oxidative stress.
We demonstrate a previously unknown interaction between eEF-2 and p53 in neurons that may play a role in adaptive responses to oxidative stress. p53 interacts with non-phosphorylated eEF-2, but not with phosphorylated eEF-2. p53-deficient cells exhibited less eEF-2 in the nucleus compared to wild-type cells, suggesting that p53 may play a role in sequestering eEF-2 in the nucleus. The interaction of eEF-2 with p53 is rapidly enhanced in neurons subjected to CH, suggesting a role for p53 to reduced protein synthesis under conditions of oxidative stress. Best known for its roles in DNA damage responses and apoptosis, p53 may also play roles in cellular stress adaptation. In support of this notion, we found that p53-deficient cells were more vulnerable than wild-type cells to CH-induced death. Although not established in the present study, p53 may protect neurons against low levels of oxidative stress by reducing protein synthesis and so conserving the cellular energy substrates required for cell survival under stressful conditions.
We also found that CRM1 seems to play a role in nuclear export of non-phosphorylated (active) eEF-2 and may thereby be important for maintenance of cytoplasmic eEF-2 to support constitutive levels of protein synthesis. In addition, we found that phosphorylated eEF-2, but not non-phosphorylated eEF-2 binds to 14-3-3 in both the nucleus and cytoplasm. The interaction of phosphorylated eEF-2 with 14-3-3 is independent of p53. Both 14.3.3 and CRM1 are known to function in the shuttling of proteins between the nucleus and cytoplasm, suggesting that CRM1 and 14-3-3 may play complementary roles in the regulation of overall levels of eEF-2 activity and protein synthesis.
In p53 deficient cells CH led to higher nuclear levels of phosphorylated eEF-2, as well as enhanced cell death compared to WT cells. On the other hand, the overexpression of eEF-2 in hippocampal neurons resulted in increased nuclear levels of non-phosphorylated eEF-2 and amelioration of CH-induced cell toxicity. In this sense, it has been described that eEF-2 is an anti-apoptotic cellular factor [38].
It is thus possible that nuclear eEF-2 provides a reserve pool protected under oxidative stress conditions. Functional eEF-2 could then be exported back into the cytoplasm, via CRM1, to reestablish translation and protein synthesis upon resolution of the oxidative stress. A compartment-specific, differential regulation of eEF-2 has been described previously [39].
eEF-2 can be regulated by phosphorylation [12, 34], interactions with other proteins [18, 21–22], and mono-ADP ribosylation [18–19, 22]. However, because these mechanisms have been studied separately, little is known about how they are integrated under physiological conditions, and dysregulated in pathological states. It has been suggested that the alteration of eEF-2 by lipid peroxidation can contribute to the protein synthesis inhibition that occurs during aging [24]. Under oxidative stress and during aging, the overall level of cellular activity of eEF-2 decreases and eEF-2 is proteolyzed [23]. Considering the sensitivity of eEF-2 to oxidants, it seems paradoxical that it is needed for the synthesis of the some proteins that are induced to cope with the oxidative stress. We hypothesize that some of the mechanisms mentioned above (i.e. phosphorylation, mono-ADP ribosylation, and interactions with p53) could protect eEF-2, at least temporarily, during the early phase of redox imbalance. Indeed, we found that low doses of CH decreased the amount of total eEF-2 without affecting cell viability. Thus, we envision a scenario in which oxidative stress and prolonged elevation of intracellular Ca2+ levels trigger multiple pathways that regulate eEF-2 activity and subcellular localization in ways that reduce global protein synthesis to maintain cell viability. Cytoplasmic eEF-2 is cleaved and inactivated by calpains, while the nuclear accumulation of eEF-2 is enhanced by its binding to p53. These mechanisms provide novel insight into the intricate relationships between pathways involved in regulating protein synthesis on the one hand, and neuronal cell survival and death decisions on the other hand.
In summary, this study revealed complex molecular mechanisms controlling the differential subcellular localization and activity state of eEF-2 that are altered in response to membrane lipid peroxidation, resulting in decreased overall eEF-2 levels by mechanisms involving phosphorylation, ADP ribosylation and calpain-mediated proteolytic degradation as well as interactions of eEF-2 with p53, and modification of eEF-2 subcellular localization by 14-3-3 and CRM1. All these mechanisms may influence the survival status of neurons during periods of elevated oxidative stress.
Supplementary Material
Supplementary figure 1. Effects of CH on total eEF-2 levels and phosphorylated eEF-2. Hippocampal primary cultures were treated with CH; the levels of total eEF-2, phosphorylated eEF-2 and β-actin were immunostained. Optical density of the eEF-2 total bands (A), and phosphorylated (B). Results are the means from four independent experiments. ANOVA was followed by Tukey’s test (*p< 0.05, **p<0.01 and ***p<0.001 vs. control).
Supplementary figure 2. Effects of calpain inhibition on total eEF-2 and phosphorylated eEF-2. Hippocampal primary cultures were pre-treated with 50 μM MDL28170(A, C) or 50 μM E64d (B, D) and after calpain inhibition treatment with 10 or 15 μM of CH for 3 h. The levels of total eEF-2 and phosphorylated eEF-2 were immunostained. Optical density of the eEF-2 bands total (A, B) and phosphorylated (C, D). Results are the means of four experiments. ANOVA was followed by Tukey’s test (*p< 0.05, **p<0.01 and ***p<0.001 vs. control and †p<0.05 and ††p<0.01 vs. treated with CH).
Supplementary figure 3. Evidence of nuclear localization of eEF-2 in hippocampal primary cultures. Confocal localization of eEF-2 in hippocampal primary cultures. Immunofluorescence was used to visualize neurons (A) and astrocytes (B). β-Tubulin (Red), GFAP (Red), eEF-2 (green) and DAPI (blue). Images are representative of three independent neuronal cultures preparations.
Highlights.
Oxidative stress increases the phosphorylation and ADP-ribosylation of eEF-2.
Calpains mediate proteolytic degradation of eEF-2 in response to oxidative stress.
eEF-2 interacts with active p53 in the nucleus and cytoplasm.
The subcellular localization of eEF-2 is regulated by CRM1 and 14.3.3.
Elevation of eEF-2 levels reduces neuronal death.
Acknowledgments
We thank Stephen H Leppla and Christopher Bachran of the Laboratory of Bacterial Diseases, National Institute of Allergy and Infectious Diseases (NIAID), NIH for providing fusion protein (FP59). We thank Myriam Gorospe and Jennifer L Martindale of the Laboratory of Molecular Biology and Immunology (LMBI), NIH for technical advice regarding protein synthesis assays. S.A.C. was supported by a Ministerio de Educacion, Cultura y Deporte of Spain postdoctoral fellowship (EX2009-0918) – A.A was supported by Ministerio de Ciencia e Innovación BFU2010-20882. This work was supported in part by the Intramural Research Program of the National Institute on Aging.
Footnotes
Conflict of Interest; The authors declare no competing financial interests.
Publisher's Disclaimer: This is a PDF file of an unedited manuscript that has been accepted for publication. As a service to our customers we are providing this early version of the manuscript. The manuscript will undergo copyediting, typesetting, and review of the resulting proof before it is published in its final citable form. Please note that during the production process errors may be discovered which could affect the content, and all legal disclaimers that apply to the journal pertain.
References
- 1.Gebauer F, Hentze MW. Molecular mechanisms of translational control. Nat Rev Mol Cell Biol. 2004;5:827–835. doi: 10.1038/nrm1488. [DOI] [PMC free article] [PubMed] [Google Scholar]
- 2.Liu Z, Barrett EJ. Human protein metabolism: its measurement and regulation. Am J Physiol Endocrinol Metab. 2002;283:E1105–E1112. doi: 10.1152/ajpendo.00337.2002. [DOI] [PubMed] [Google Scholar]
- 3.Proud CG. Regulation of mammalian translation factors by nutrients. Eur J Biochem. 2002;269:5338–5349. doi: 10.1046/j.1432-1033.2002.03292.x. [DOI] [PubMed] [Google Scholar]
- 4.Stranahan AM, Mattson MP. Recruiting adaptive cellular stress responses for successful brain ageing. Nat Rev Neurosci. 2012;13:209–216. doi: 10.1038/nrn3151. [DOI] [PMC free article] [PubMed] [Google Scholar]
- 5.Mark RJ, Hensley K, Butterfield DA, Mattson MP. Amyloid beta-peptide impairs ion motive ATPase activities: evidence for a role in loss of neuronal Ca2+ homeostasis and cell death. J Neurosci. 1995;15:6239–6249. doi: 10.1523/JNEUROSCI.15-09-06239.1995. [DOI] [PMC free article] [PubMed] [Google Scholar]
- 6.Kruman I, Bruce-Keller AJ, Bredesen D, Waeg G, Mattson MP. Evidence that 4-hydroxynonenal mediates oxidative stress-induced neuronal apoptosis. J Neurosci. 1997;17:5089–5100. doi: 10.1523/JNEUROSCI.17-13-05089.1997. [DOI] [PMC free article] [PubMed] [Google Scholar]
- 7.Peng ZF, Koh CH, Li QT, Manikandan J, Melendez AJ, Tang SY, Halliwell B, Cheung NS. Deciphering the mechanism of HNE-induced apoptosis in cultured murine cortical neurons: transcriptional responses and cellular pathways. Neuropharmacology. 2007;53:687–698. doi: 10.1016/j.neuropharm.2007.07.016. [DOI] [PubMed] [Google Scholar]
- 8.Jacobs WB, Kaplan DR, Miller FD. The p53 family in nervous system development and disease. J Neurochem. 2006;97:1571–1584. doi: 10.1111/j.1471-4159.2006.03980.x. [DOI] [PubMed] [Google Scholar]
- 9.Mattson MP. Metal-catalyzed disruption of membrane protein and lipid signaling in the pathogenesis of neurodegenerative disorders. Ann N Y Acad Sci. 2004;1012:37–50. doi: 10.1196/annals.1306.004. [DOI] [PubMed] [Google Scholar]
- 10.Sonenberg N, Hinnebusch AG. Regulation of translation initiation in eukaryotes: mechanisms and biological targets. Cell. 2009;136:731–745. doi: 10.1016/j.cell.2009.01.042. [DOI] [PMC free article] [PubMed] [Google Scholar]
- 11.Boyce M, Py BF, Ryazanov AG, Minden JS, Long K, Ma D, Yuan J. Apharmaco proteomic approach implicates eukaryotic elongation factor 2 kinase in ER stress induced cell death. Cell Death Differ. 2008;15:589–599. doi: 10.1038/sj.cdd.4402296. [DOI] [PubMed] [Google Scholar]
- 12.Browne GJ, Proud CG. Regulation of peptide-chain elongation in mammalian cells. Eur J Biochem. 2002;269:5360–5368. doi: 10.1046/j.1432-1033.2002.03290.x. [DOI] [PubMed] [Google Scholar]
- 13.Patel J, McLeod LE, Vries RG, Flynn A, Wang X, Proud CG. Cellular stresses profoundly inhibit protein synthesis and modulate the states of phosphorylation of multiple translation factors. Eur J Biochem. 2002;269:3076–3085. doi: 10.1046/j.1432-1033.2002.02992.x. [DOI] [PubMed] [Google Scholar]
- 14.White-Gilbertson S, Kurtz DT, Voelkel-Johnson C. The role of protein synthesis in cell cycling and cancer. Mol Oncol. 2009;3:402–408. doi: 10.1016/j.molonc.2009.05.003. [DOI] [PMC free article] [PubMed] [Google Scholar]
- 15.Zelivianski S, Liang D, Chen M, Mirkin BL, Zhao RY. Suppressive effect of elongation factor 2 on apoptosis induced by HIV-1 viral protein R. Apoptosis. 2006;11:377–388. doi: 10.1007/s10495-006-4030-9. [DOI] [PubMed] [Google Scholar]
- 16.Scheper GC, van der Knaap MS, Proud CG. Translation matters: protein synthesis defects in inherited disease. Nat Rev Genet. 2007;8:711–723. doi: 10.1038/nrg2142. [DOI] [PubMed] [Google Scholar]
- 17.Bektas M, Nurten R, Ergen K, Bermek E. Endogenous ADP-ribosylation for eukaryotic elongation factor 2: evidence of two different sites and reactions. Cell Biochem Funct. 2006;24:369–380. doi: 10.1002/cbf.1265. [DOI] [PubMed] [Google Scholar]
- 18.Jorgensen R, Merrill AR, Andersen GR. The life and death of translation elongation factor2. Biochem Soc Trans. 2006;34:1–6. doi: 10.1042/BST20060001. [DOI] [PubMed] [Google Scholar]
- 19.Bektas M, Nurten R, Sayers Z, Bermek E. Interactions of elongation factor 2 with the cytoskeleton and interference with DNase I binding to actin. Eur J Biochem. 1998;256:142–147. doi: 10.1046/j.1432-1327.1998.2560142.x. [DOI] [PubMed] [Google Scholar]
- 20.Pozuelo RM, Geraghty KM, Wong BH, Wood NT, Campbell DG, Morrice N, Mackintosh C. 14–3–3-affinity purification of over 200 human phosphoproteins reveals new links to regulation of cellular metabolism, proliferation and trafficking. Biochem J. 2004;379:395–408. doi: 10.1042/BJ20031797. [DOI] [PMC free article] [PubMed] [Google Scholar]
- 21.Yin X, Fontoura BM, Morimoto T, Carroll RB. Cytoplasmic complex of p53 and eEF2. J Cell Physiol. 2003;196:474–482. doi: 10.1002/jcp.10329. [DOI] [PubMed] [Google Scholar]
- 22.Ayala A, Parrado J, Bougria M, Machado A. Effect of oxidative stress, produced by cumene hydroperoxide, on the various steps of protein synthesis. Modifications of elongation factor-2. J Biol Chem. 1996;271:23105–23110. doi: 10.1074/jbc.271.38.23105. [DOI] [PubMed] [Google Scholar]
- 23.Parrado J, Bougria M, Ayala A, Castano A, Machado A. Effects of aging on the various steps of protein synthesis: fragmentation of elongation factor 2. Free Radic Biol Med. 1999;26:362–370. doi: 10.1016/s0891-5849(98)00202-0. [DOI] [PubMed] [Google Scholar]
- 24.Mattson MP, Guthrie PB, Hayes BC, Kater SB. Roles for mitotic history in the generation and degeneration of hippocampal neuro -architecture. J Neurosci. 1989;9:1223–1232. doi: 10.1523/JNEUROSCI.09-04-01223.1989. [DOI] [PMC free article] [PubMed] [Google Scholar]
- 25.Bunz F, Dutriaux A, Lengauer C, Waldman T, Zhou S, Brown JP, Sedivy JM, Kinzler KW, Vogelstein B. Requirement for p53 and p21 to sustain G2 arrest after DNA damage. Science. 1998;282:1497–1501. doi: 10.1126/science.282.5393.1497. [DOI] [PubMed] [Google Scholar]
- 26.Jiang ZY, Woollard AC, Wolff SP. Lipid hydroperoxide measurement by oxidation of Fe2+ in the presence of xylenol orange. Comparison with the TBA assay and an iodometric method 1. Lipids. 1991;26:853–856. doi: 10.1007/BF02536169. [DOI] [PubMed] [Google Scholar]
- 27.Gupta PK, Liu S, Batavia MP, Leppla SH. The diphthamide modification on elongation factor-2 renders mammalian cells resistant to ricin. Cell Microbiol. 2008;10:1687–1694. doi: 10.1111/j.1462-5822.2008.01159.x. [DOI] [PMC free article] [PubMed] [Google Scholar]
- 28.Parker CS, Topol J. A Drosophila RNA polymerase II transcription factor contains apromoter-region-specific DNA-binding activity. Cell. 1984;36:357–369. doi: 10.1016/0092-8674(84)90229-0. [DOI] [PubMed] [Google Scholar]
- 29.Feng Y, Absher D, Eberhart DE, Brown V, Malter HE, Warren ST. FMRP associates with polyribosomes as an mRNP, and the I304N mutation of severe fragile X syndrome abolishes this association. Mol Cell. 1999;1:109–118. doi: 10.1016/s1097-2765(00)80012-x. [DOI] [PubMed] [Google Scholar]
- 30.Barde I, Salmon P, Trono D. Production and Titration of Lentiviral Vectors. Current Protocols in Neuroscience. 2010;53:4.21.1–4.21.23. doi: 10.1002/0471142301.ns0421s53. [DOI] [PubMed] [Google Scholar]
- 31.Ma W, Han W, Greer PA, Tuder RM, Toque HA, Wang KK, Caldwell RW, Su Y. Calpain mediates pulmonary vascular remodeling in rodent models of pulmonary hypertension, and its inhibition attenuates pathologic features of disease. J Clin Invest. 2011;121:4548–4566. doi: 10.1172/JCI57734. [DOI] [PMC free article] [PubMed] [Google Scholar]
- 32.Tsubokawa T, Yamaguchi-Okada M, Calvert JW, Solaroglu I, Shimamura N, Yata K, Zhang JH. Neurovascular and neuronal protection by E64d after focal cerebral ischemia in rats. J Neurosci Res. 2006;84:832–840. doi: 10.1002/jnr.20977. [DOI] [PubMed] [Google Scholar]
- 33.Arguelles S, Munoz MF, Cano M, Machado A, Ayala A. In vitro and in vivo protection by melatonin against the decline of elongation factor-2 caused by lipid peroxidation: preservation of protein synthesis. J Pineal Res. 2012;53:1–10. doi: 10.1111/j.1600-079X.2011.00961.x. [DOI] [PubMed] [Google Scholar]
- 34.Kaul G, Pattan G, Rafeequi T. Eukaryotic elongation factor-2 (eEF2): its regulation and peptide chain elongation. Cell Biochem Funct. 2011;29:227–234. doi: 10.1002/cbf.1740. [DOI] [PubMed] [Google Scholar]
- 35.Ryazanov AG, Shestakova EA, Natapov PG. Phosphorylation of elongation factor 2 byEF-2 kinase affects rate of translation. Nature. 1988;334:170–173. doi: 10.1038/334170a0. [DOI] [PubMed] [Google Scholar]
- 36.Shenton D, Smirnova JB, Selley JN, Carroll K, Hubbard SJ, Pavitt GD, Ashe MP, Grant CM. Global Translational Responses to Oxidative Stress Impact upon Multiple Levels of Protein Synthesis. J Biol Chem. 2006;281:29011–29021. doi: 10.1074/jbc.M601545200. [DOI] [PubMed] [Google Scholar]
- 37.Holcik M, Sonenberg N. Translational control in stress and apoptosis. Nature Rev. 2005;6:318–327. doi: 10.1038/nrm1618. [DOI] [PubMed] [Google Scholar]
- 38.Zelivianski S, Liand D, Chen M, Mirkin BL, Zhao RY. Suppressive effect of elongation factor 2 on apoptosis induced by HIV-1 viral protein R. Apoptosis. 2006;11:377–388. doi: 10.1007/s10495-006-4030-9. [DOI] [PubMed] [Google Scholar]
- 39.Weatherill DB, McCamphill PK, Pethoukov E, Dunn TW, Fan X, Sossin WS. Compartment-specific, differential regulation of eukaryotic elongation factor 2 and its kinase within Aplysia sensory neurons. J Neurochem. 2011;117:841–855. doi: 10.1111/j.1471-4159.2011.07251.x. [DOI] [PubMed] [Google Scholar]
Associated Data
This section collects any data citations, data availability statements, or supplementary materials included in this article.
Supplementary Materials
Supplementary figure 1. Effects of CH on total eEF-2 levels and phosphorylated eEF-2. Hippocampal primary cultures were treated with CH; the levels of total eEF-2, phosphorylated eEF-2 and β-actin were immunostained. Optical density of the eEF-2 total bands (A), and phosphorylated (B). Results are the means from four independent experiments. ANOVA was followed by Tukey’s test (*p< 0.05, **p<0.01 and ***p<0.001 vs. control).
Supplementary figure 2. Effects of calpain inhibition on total eEF-2 and phosphorylated eEF-2. Hippocampal primary cultures were pre-treated with 50 μM MDL28170(A, C) or 50 μM E64d (B, D) and after calpain inhibition treatment with 10 or 15 μM of CH for 3 h. The levels of total eEF-2 and phosphorylated eEF-2 were immunostained. Optical density of the eEF-2 bands total (A, B) and phosphorylated (C, D). Results are the means of four experiments. ANOVA was followed by Tukey’s test (*p< 0.05, **p<0.01 and ***p<0.001 vs. control and †p<0.05 and ††p<0.01 vs. treated with CH).
Supplementary figure 3. Evidence of nuclear localization of eEF-2 in hippocampal primary cultures. Confocal localization of eEF-2 in hippocampal primary cultures. Immunofluorescence was used to visualize neurons (A) and astrocytes (B). β-Tubulin (Red), GFAP (Red), eEF-2 (green) and DAPI (blue). Images are representative of three independent neuronal cultures preparations.


