

Abstract
Study Objectives:
There is growing evidence indicating that in order to meet the neuronal energy demands, astrocytes provide lactate as an energy substrate for neurons through a mechanism called “astrocyte-neuron lactate shuttle” (ANLS). Since neuronal activity changes dramatically during vigilance states, we hypothesized that the ANLS may be regulated during the sleep-wake cycle. To test this hypothesis we investigated the expression of genes associated with the ANLS specifically in astrocytes following sleep deprivation. Astrocytes were purified by fluorescence-activated cell sorting from transgenic mice expressing the green fluorescent protein (GFP) under the control of the human astrocytic GFAP-promoter.
Design:
6-hour instrumental sleep deprivation (TSD).
Setting:
Animal sleep research laboratory.
Participants:
Young (P23-P27) FVB/N-Tg (GFAP-GFP) 14Mes/J (Tg) mice of both sexes and 7-8 week male Tg and FVB/Nj mice.
Interventions:
Basal sleep recordings and sleep deprivation achieved using a modified cage where animals were gently forced to move.
Measurements and Results:
Since Tg and FVB/Nj mice displayed a similar sleep-wake pattern, we performed a TSD in young Tg mice. Total RNA was extracted from the GFP-positive and GFP-negative cells sorted from cerebral cortex. Quantitative RT-PCR analysis showed that levels of Glut1, α-2-Na/K pump, Glt1, and Ldha mRNAs were significantly increased following TSD in GFP-positive cells. In GFP-negative cells, a tendency to increase, although not significant, was observed for Ldha, Mct2, and α-3-Na/K pump mRNAs.
Conclusions:
This study shows that TSD induces the expression of genes associated with ANLS specifically in astrocytes, underlying the important role of astrocytes in the maintenance of the neuro-metabolic coupling across the sleep-wake cycle.
Citation:
Petit JM; Gyger J; Burlet-Godinot S; Fiumelli H; Martin JL; Magistretti PJ. Genes involved in the astrocyte-neuron lactate shuttle (ANLS) are specifically regulated in cortical astrocytes following sleep deprivation in mice. SLEEP 2013;36(10):1445-1458.
Keywords: Glia, flow cytometry, transgenic mice, energy metabolism, glucose, glutamate
INTRODUCTION
During the last decade a growing body of evidence has revealed the critical role of astrocytes in brain function1–3 and has shed light on their specific role in neuro-metabolic coupling.4 The role of astrocytes in neuro-metabolic coupling is supported by their anatomical features, whereby their end-feet wrap the blood capillaries while other processes ensheath the pre- and post-synaptic elements of the neuropil. Considering this specific anatomical organization, it is likely that astrocytes are ideally suited to provide energy to neuronal cells and to couple energy to neuronal activity. In this context, experimental evidence supports the view that astrocytes can rapidly modulate energy substrate production through the mobilization of glycogen, and the activation of the “astrocyte-neuron lactate shuttle” (ANLS).5–7
Brain glycogen is rapidly mobilized by focal activation8 in order to provide glucose-6-phosphate that subsequently enters glycolysis to produce ATP. According to the ANLS hypothesis, astrocytic glycolysis is coupled to neuronal activity via glutamate uptake and subsequent activation of the Na/KATPase α-2 subunit.4,7,9 The observations that lactate production is increased in response to neuronal stimulation10,11 and that neurons possess inward lactate transport system12 support the use of lactate as an alternative energy substrate by neurons during sustained activation. Previous studies have shown that glycogen mobilization leads to a net production of lactate by astrocytes.13,14 Lactate generated from glycogen breakdown can be used as fuel by neuronal cells in vitro15 and in vivo. In this regard, glycogen-derived lactate has been shown to be necessary for the establishment of long-term potentiation and long-term memory.16
During the sleep period, neuronal activity pattern changes throughout the cortex as assessed by EEG recordings.17 The decreased neuronal activity is accompanied by a reduction in global glucose utilization (about 20% to 40% relative to the wake period) during slow wave sleep stages.18,19 However, neuronal activity and glucose consumption increase dramatically during paradoxical sleep episodes to reach levels higher than those observed during wakefulness.20 Because of their central role in coupling neuronal activity to glucose utilization, it is likely that astrocytic mechanisms that are involved in the neuro-metabolic coupling are regulated during the sleep-wake cycle.
In a previous study, we found that a 6-hour sleep deprivation increases glycogen synthase activity and mRNA levels of protein targeting to glycogen (PTG or Ppp1r3c),21 a protein involved in the synthesis of glycogen. In addition, using a pharmacological approach to induce sleep deprivation, we showed that these transcriptional and enzymatic regulations set the cortical glycogen metabolism in a “synthetic mode” that preserves cortical glycogen levels.22 Since cortical glycogen metabolism is restricted to glial cells, these results indicate that astrocytic energy metabolism is regulated by the vigilance states. Gene expression analysis has been previously used to identify a large number of genes that are regulated in sleep deprived animals.23,24 Among those, a substantial number of genes related to energy metabolism were found to be up-regulated such as Glut1, the subunit 1 of cytochrome C oxidase and PTG. However, these studies did not provide anatomical and cell-type specificity regarding the expression of the regulated genes.
Generation of transgenic mice that express a fluorescent protein under the control of astrocyte-specific promoter,25,26 combined with fluorescence-activated cell sorting (FACS) allows the isolation of cellular fractions highly enriched in astrocytes.27,28 This experimental strategy has been used to analyze the astrocytic transcriptome in physiological and pathological conditions.27–29 Using this approach, we investigated the regulation of genes encoding molecules involved in the ANLS in response to a short-term sleep deprivation. To this aim, we used a newly engineered device (named “CaResS”) designed to reduce the stress associated with the sleep-deprivation procedure. Once we established that transgenic mice displayed similar sleep parameters compared to wild type mice, we examined the expression of a particular set of astrocyte-specific genes encoding proteins involved in the ANLS. These genes included the glutamate transporter 1 (GLT1), the α-2 and α-3 subunits of the Na/K-ATPase, the A and B forms of the lactate dehydrogenase (LDH-A and LDH-B), the monocarboxylate transporters type 1 (MCT1) and type 2 (MCT2), as well as the glucose transporters 1 and 3 (GLUT1 and GLUT3). Here, we report that a subset of ANLS-related genes is specifically regulated by sleep deprivation in astrocytes, supporting the role of astrocytes in neuro-metabolic coupling associated with vigilance states.
MATERIALS AND METHODS
In Figure 1 is shown a schematic summary of the experimental procedure.
Figure 1.

Schematic representation of the experimental procedure. Animals were habituated for 2-3 days in the CaResS device before sleep deprivation. After 6 h of sleep deprivation, mice were sacrificed by decapitation and cerebral cortices were dissociated. Cell suspension was purified by FACS in 2 populations: GFP-positive/PI-negative cells and GFP-negative/PI-negative cells, based on sequential gating of size, viability (PI fluorescence or y-axis on the graph), and GFAP-GFP fluorescence (x-axis on the graph), where small dots represent sorted events (≈cells). RNA samples from 3 animals were pooled to obtain sufficient RNA for one replicate, and 5 replicates per experimental group were used to quantify mRNA levels. FACS, fluorescence activated cell sorting; GFP+ cells, green fluorescent protein expressing cells; GFP- cells, cells that do not express green fluorescent protein; PI, propidium iodide.
Animals
Transgenic FVB/N-Tg(GFAP-GFP)14Mes/J mice (The Jackson Laboratory, Bar Harbor, ME) (Tg) expressing the green fluorescent protein (GFP) under the control of the human-GFAP promoter25 and wild-type FVB/Nj mice (Wt) (Charles River, Saint-Germain-sur-l'Arbresle, France) were housed in standard conditions (light-dark cycle: 12h/12h, temperature: 23 ± 1°C, humidity: 50% ± 10%) with food and water ad libitum. The determination of the sleep-wake patterns of the Tg and Wt mice were obtained from young adults (7-8 weeks). Transcriptomic analysis of cells obtained by FACS was performed on post-weaned Tg mice. In this last experiment, mice from the same litter were isolated (at P20-P23) in “CaResS” cages and genotyped. After 3-4 days of habituation, 2 Tg littermates were randomly assigned to sleep deprivation or control groups. Experiments were performed with juvenile (P23-P27) transgenic mice of both sexes. All experiments were performed under the approval of the Veterinary Service of the Canton de Vaud and were in accordance with the EEC directive (86/609/EEC).
Sleep Deprivation with the “CaResS” Device
A 6-h sleep deprivation, starting with the onset of the light period (ZT0 for zeitgeber time = 0), was performed using a homemade device named CaResS (acronym for Cage for Restriction of Sleep).30 This device has been specifically designed to diminish sleep deprivation-induced stress.31 Briefly, CaResS consists of a cylindrical Plexiglas cage (30 cm diameter) with inner radial walls and a mobile circular floor covered with bedding. To achieve sleep deprivation, the slow rotation of the floor (increasing gradually from 1.5 to 2.5 rpm to compensate for increasing sleep pressure) moves the mouse into contact with the walls and wakes it up. Control animals were maintained similarly in CaResS but without rotation of the floor. Mice had free access to food and water throughout the sleep deprivation protocol.
The efficiency of the device to achieve TSD was tested on adult Wt and Tg mice equipped for EEG and EMG recordings.
Sleep-Wake Patterns and Sleep Homeostasis in Adult Tg Mice
To determine whether the basal sleep-wake parameters were modified by the transgene insertion, Tg and Wt mice (Tg male, n = 7, Wt male, n = 6) were implanted for EEG and EMG recordings 3 weeks before the experiments. Briefly, anesthesia was induced with isoflurane 4% and maintained with a cocktail of Xylazine 8% and Ketamine 9% (10 μL/g i.p). The skull was drilled to insert 2 gold-covered screws used as EEG electrodes over the frontal (bregma +1.5 mm and +1 mm laterally) and parietal cortex (bregma -3 mm and +1 mm laterally), respectively. One additional screw was inserted for implant anchorage. Two gold wire electrodes were placed into the nuchal muscles for EMG recordings. The EEG and EMG electrodes were then soldered to a connector and covered with dental cement (Paladur). Mice were let to recover individually in a CaResS cage for one week and then plugged to a swivel connected-wire to allow free movement of the animal. The EEG/EMG signals were recorded and digitalized with an Embla A10 amplifier (Medcare, USA) sampled at 100 Hz and filtered between 0.5 and 50 Hz. Using the Somnologica software (Medcare, USA), 4-sec epochs of the EEG/EMG were visually scored in 3 vigilance states (wakefulness [W], slow wave sleep [SWS], and paradoxical sleep [PS]) according to classical criteria.32 Finally, vigilance state parameters were recorded during 2 periods of 24 h separated by a 1-week interval and were averaged over 12-h light and dark periods. To evaluate the sleep homeostatic regulation in the Tg mice, we also recorded the vigilance states during the 6-h TSD and 4 h after the end of TSD. Results were obtained from two TSD sessions performed at 10-day intervals.
Spectral analysis of the EEG signal was performed (i) for SWS and PS in baseline conditions from ZT0 to ZT12 (light period), and (ii) for SWS during the 4 h following the TSD (ZT6-ZT10) to assess the rebound of slow wave activity (SWA), the main marker of the sleep homeostasis. Briefly, after discarding epochs with artifacts, remaining SWS epochs were Fourier transformed (FFT) using MATLAB (MathWorks Inc., Natick, USA) embedded FFT function and personalized routines. For baseline power spectrum analysis, individual FFT values of 0.25 Hz bins (from 0.25-40 Hz) calculated from the SWS- and PS-EEG of each mouse, were expressed as a percentage of the total power of the vigilance state during the period of analysis (ZT0-ZT12). These values were then averaged by group (Tg and Wt). For the SWA rebound determination, the power spectrum of each 0.25-Hz bin of the SWS-EEG of the recovery period was summed from 0.5 Hz to 4 Hz (delta activity), normalized by the number of SWS epochs, and was expressed as percentage of the SWA corresponding to the same baseline period (ZT6-ZT10) in Wt as well as in Tg mice.
Locomotor Activity Recordings of Young Tg Mice during TSD
Since electrodes implantation was not compatible with the use of recently weaned mice, we performed locomotor activity recordings in 10 animals in each group, to assess the sleep deprivation efficacy and reproducibility in weaned Tg mice used for gene expression analysis. To this aim, infrared sensors were fixed above CaResS cage. These sensors detected rearing and lateral movements with a magnitude > 1-2 cm; neither grooming nor small movements were detected. Data were collected through a homemade interface and recorded by bins of 1 min on a computer. On the basis of previous visual observations of young mice, a bin value superior to 10 (arbitrary units) can be considered equivalent to a period of 1 min wakefulness. The bins where activity values were above this threshold were summed over a period of 6 h from ZT0 (i.e., the beginning of the sleep deprivation period). For more accurate activity analysis, raw data from sleep deprived and control animals were pooled over 15min periods throughout TSD.
Stress Assessment in Young Tg Mice for TSD
We assessed the stress level of CTL and TSD animals by measuring plasma glucocorticoid levels at the end of the sleep deprivation period. When animals were sacrificed (see below), the trunk blood was collected in heparinized tubes (microvette, Sarstedt, Nümbrecht, Germany) and centrifuged to separate plasma. Glucocorticoid levels were determined using a commercial kit according to the manufacturer's instructions (Corticosterone Enzyme Immunoassay Kit, Assay Designs, LuBioScience, Lucerne, Switzerland).
Cell Dissociation
Each mouse was deeply anesthetized with isoflurane (Attane, Minrad, USA) and killed by decapitation. The brain was rapidly removed, and the cerebral cortex was dissected out and placed in cold modified Hank's balanced salt solution (mHBSS) consisting of calcium- and magnesium-free HBSS (Gibco, Invitrogen, USA) containing 25 mM D-glucose and 10 mM HEPES buffer (pH 7.4). The cerebral cortex was cut into small pieces (1×1 mm) under a binocular microscope and enzymatically digested for 45 min at 37°C under gentle agitation in mHBSS containing 20 U/mL papain (Worthington, Lakewood, USA), 0.12 mg/mL L-cysteine (Sigma, Buchs, Switzerland), and 1 U/ mL DNase I. After quenching the papain for 5 min with the addition of 1/10 volume fetal calf serum containing 1% bovine serum albumin, the tissue was centrifuged for 2 min at 200 g and then gently triturated in 1.5 mL of cold mHBSS solution by 8 to 10 passages through a 1-mL pipette tip. Three mL of mHBSS were added, and undissociated tissue was allowed to sediment for 3 min. The supernatant was collected in a separate tube containing 0.1 mL of DNase-I solution. The trituration procedure was repeated 3 times. The cell suspension was then centrifuged for 8 min at 500 g. The pellet was resuspended in 2 mL of mHBSS, and cell clusters and debris were removed by filtration through a 40-μm cell strainer (Falcon, BD Biosciences, Allschwil, Switzerland). Finally, 2 μL of propidium iodide (Fluka, Buchs, Switzerland), a fluorescent cell death indicator, were added to the cell suspension. Approximately 5,000-10,000 living GFP-positive cells were usually obtained using this procedure.
Fluorescence Activated Cell Sorting (FACS)
Astrocytes were sorted on a FACS Vantage SE (Becton Dickinson) equipped with a Coherent Enterprise laser (Mountain View, CA), simultaneously emitting at 360 nm and at 488 nm, and a Coherent Helium-Neon emitting at 630 nm. Dissociated cells from wild-type FVB/N mice were used to assess fluorescence background. The data were collected and analyzed using FACS-Diva Software (Becton Dickinson). Dissociated cells were harvested in 100-150 μL of lysis buffer (RNAaqueous micro, Ambion, Austin, USA) and frozen at -80°C.
RNA Extraction
Samples were homogenized and total RNA was extracted according to the manufacturer's protocol (RNAaqueous micro, Ambion, Austin, USA). The purity and integrity of RNA from each sample were analyzed using picochips on an Agilent 2100 bioanalyzer (Agilent Technologies, Waldbronn, Germany).
Gene Expression
After reverse transcription with the SuperScript VILO cDNA synthesis kit (Invitrogen, USA), 1.5 μL cDNA (1:10) was amplified with 3.5 μL primers (300 nM) and 5 μL 2x Power SYBR Green MasterMix (Applied Biosystems, Foster City, USA) in a 384-well plate using the 7900HT Fast Real-Time PCR system, (Applied Biosystems). Data were computed using the sequence detector software SDS 2.3 (Applied Biosystems). For the analysis of mRNA levels of cell markers enrichment and of proteins involved in ANLS in the different cell fractions, a pool of 4 animals sacrificed at ZT6 was used. For sleep deprivation experiments, GFP-positive cells from three different animals of the same experimental group (CTL or TSD) were pooled to obtain sufficient amount of RNA without performing further RNA amplification. In parallel, GFP-negative cells were similarly processed. All samples were analyzed in triplicates and the expression level of target genes was normalized to ß-actin level according to geNorm software (version 3.3; http://medgen.ugent.be/∼jvdesomp/genorm/). For the characterization of each fraction, the enrichment corresponds to the level of expression of each marker in the GFP-positive fraction compared to that in the GFP-negative fraction expressed as fold change. Primers in Table 1 were designed using the web-based software Primer Express 3.0 (Applied Biosystems, Foster City, USA) and synthesized by Microsynth (Belgach, Switzerland). Whenever possible, amplicons were chosen over an exon/exon junction to avoid amplification of residual genomic DNA.
Table 1.

Statistical Analysis
For the sleep-wake pattern of Tg mice, sleep parameters were analyzed using an unpaired t-test or Mann-Whitney test when samples distribution did not fit a Gaussian distribution (Table 2). Statistical analysis of the total power spectrum during baseline conditions was made using a repeated measures two-way ANOVA (RM ANOVA) followed by a Bonferroni post-hoc-test. The rebounds of SWS length and SWA following TSD were tested using an unpaired t-test and a Mann-Whitney test, respectively. All sleep data are shown as mean ± SEM. Five CTL and TSD samples (n = 15 in each group), consisting of pools of RNA from 3 animals, were used for gene expression analysis. Gene expression values are expressed as percentage of the CTL group and are shown as mean ± SEM. Comparison of gene expression levels between the 2 experimental groups were performed using a nonparametric Mann-Whitney test. For glucocorticoids levels, statistical analysis was performed with an unpaired t-test. A P value < 0.05 was considered statistically significant in all tests used.
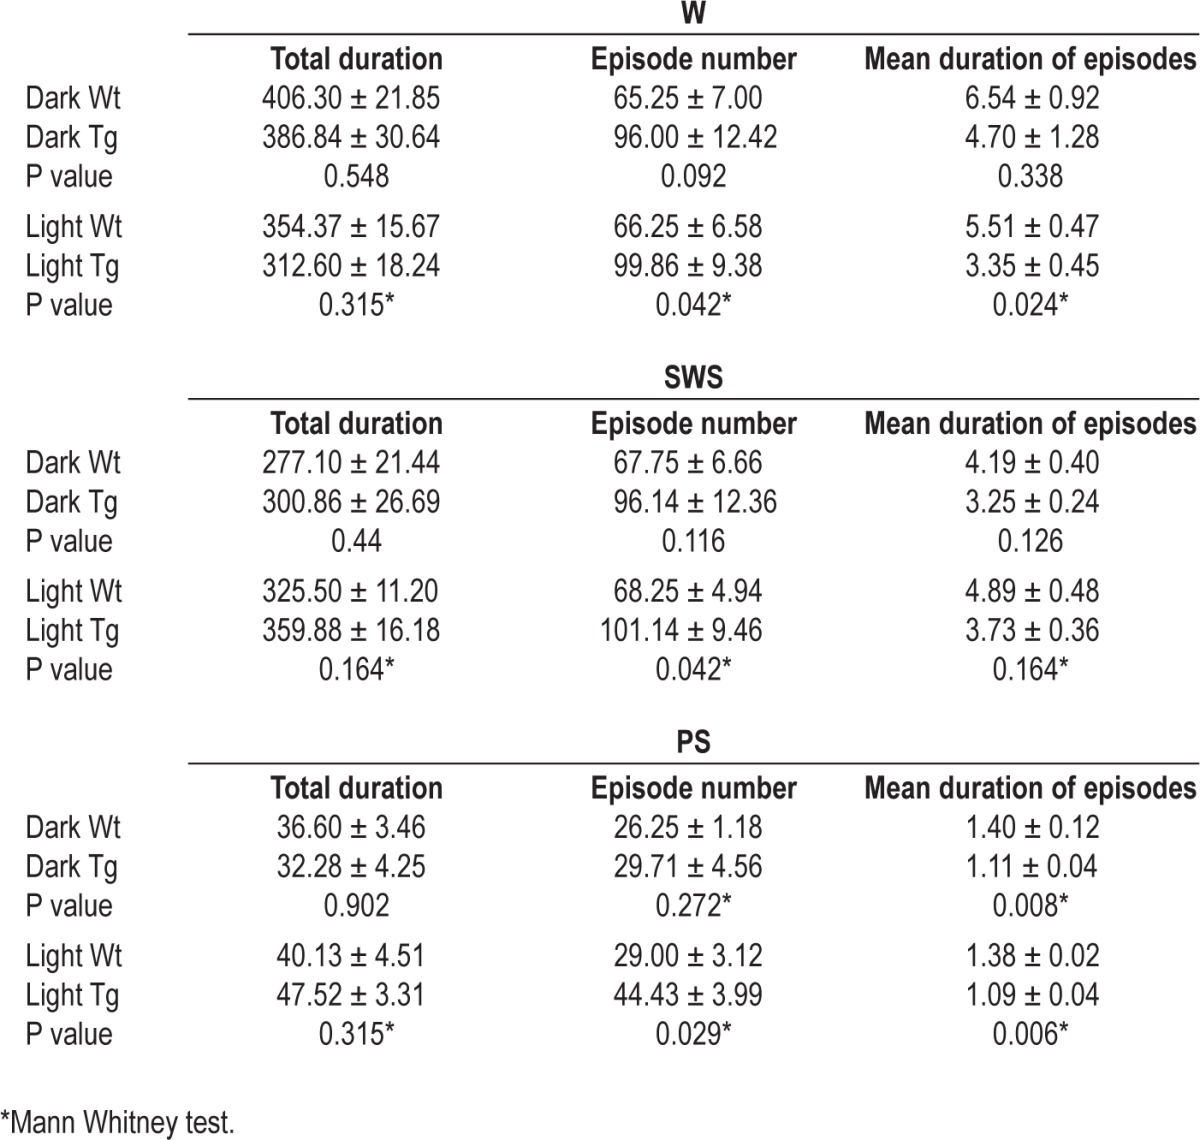
Table 2.
RESULTS
Basal Sleep-Wake Parameters and Sleep Homeostasis in Adult Tg Mice
No change in classical features of EEG and EMG was observed in Tg mice compared to Wt mice or C57BL6/j strain. During the dark period, Tg and Wt mice displayed comparable amount of wakefulness, slow wave sleep, and paradoxical sleep (Wake: 56.4% ± 3.0% in Tg and 53.7% ± 4.3% in Wt; SWS: 38.5% ± 3.0% in Tg and 41.8% ± 3.7% in Wt, PS: 5.1% ± 0.5% in Tg and 4.5% ± 0.6% in Wt) (Table 2). No difference in the number and duration of episodes for each state was observed, except for the mean duration of the PS episodes. During the light period, Tg and Wt mice also displayed similar amounts of vigilance states (Wake: 43.4% ± 2.5% in Tg and 49.2% ± 2.0% in Wt; SWS: 50.0% ± 2.2% in Tg and 45.2% ± 1.6% in Wt, PS: 6.6% ± 0.5% in Tg and 5.6% ± 0.6% in Wt) (Table 2). Interestingly, during this period, Tg mice exhibited significant increases in the number of wakeful, slow wave sleep, and paradoxical sleep episodes (Mann-Whitney test, P = 0.042; P = 0.042, and P = 0.029, respectively) as well as in the mean duration of episodes for wakefulness and paradoxical sleep (Mann-Whitney test, P = 0.024 and P = 0.006, respectively; Table 2). According to this sleep fragmentation, Tg mice displayed a significant decrease in the low-frequency ranges between 1 Hz and 2.75 Hz (P < 0.001 from 1-2.5 Hz and P < 0.01 from 2.5-2.75 Hz, n = 6) for SWS (Figure 2A) compared to the Wt mice values over the 12-h light period. A decreased theta frequency peak (5.75-7.75 Hz) (P < 0.001 from 5.75-7.5Hz and P < 0.05 from 7.5-7.75 Hz, n = 6) was also observed for PS in the Tg mice (Figure 2B). Following a 6-h TSD, a significant and similar increase in SWS length was present in Wt mice (+26.5 ± 9.2 min, P = 0.017, n = 8) and in Tg mice (+26 ± 6.2 min, P = 0.0008, n = 8) during the 4h of recovery (Figure 3B). As expected, SWA was also increased following TSD in Wt (+110 ± 15%, P = 0.079, n = 5) and Tg mice (+96% ± 18%, P = 0.002, n = 6), but only for the first two hours following TSD. From ZT8 to ZT10, only a non-significant residual increase was still present in Wt (+20% ± 16%, P = 0.309, n = 5) and Tg mice (+25% ± 14%, P = 0.180, n = 6) (Figure 3C).
Figure 2.

(A) Relative SWS EEG power spectrum expressed as percentage of the mean of the total power from 0.5 to 40 Hz (0, 25 Hz bins) in young adult Wt mice (n = 5, gray line) and Tg mice (n = 6, black line) over the light period (ZT0-ZT12). (B) Relative PS EEG power spectrum expressed as percentage of the mean of the total power from 0.5 to 40 Hz (0, 25 Hz bins) in Wt group (n = 5, gray line) and Tg group (n = 6, black line) over the light period (ZT0-ZT12). For each panel, data were expressed as mean ± SEM. Horizontal bars at the bottom indicate frequency bands where a significant difference was observed (*P < 0.05, ***P < 0.001).
Figure 3.
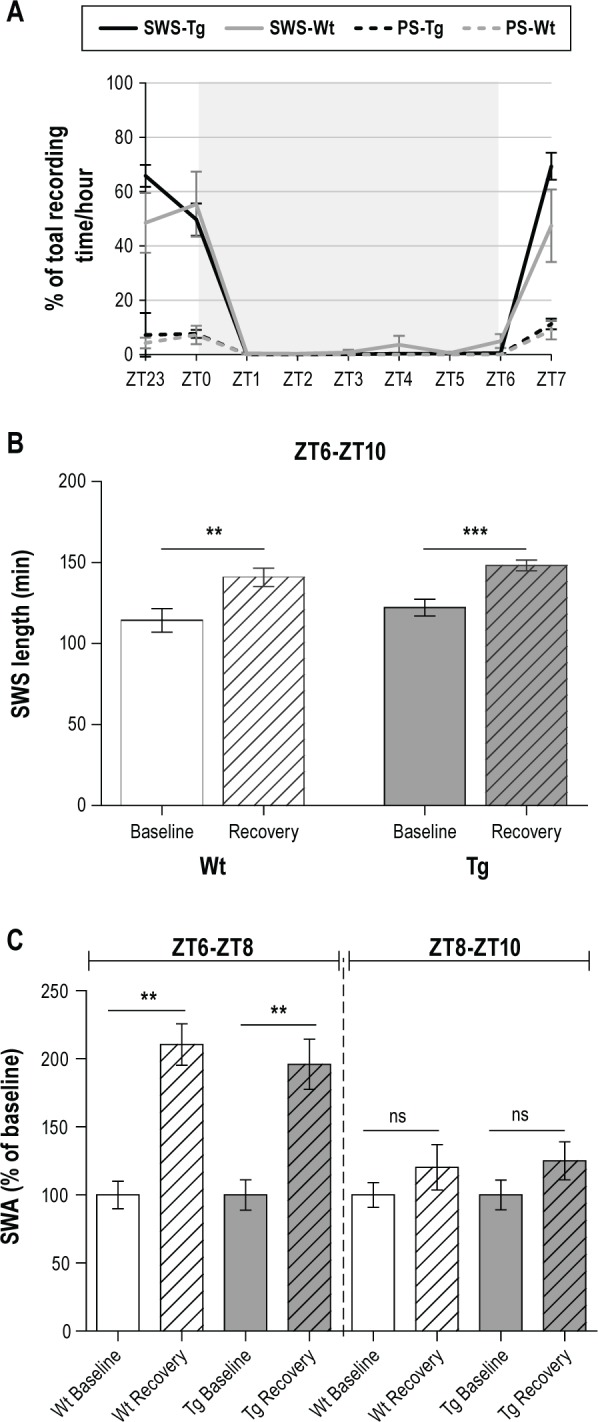
(A) Hourly SWS and PS duration during 6-h sleep deprivation achieved with the CaResS device in young adult Wt and Tg mice. Sleep durations are expressed as percentages of 60-min recordings. The gray shaded area shows the CaResS activation period (6 h). Values are the mean ± SEM, n = 6 for Wt group and n = 8 for Tg group. (B) Total length of SWS in minutes from ZT6 to ZT10 in baseline conditions and after 6-h TSD (beginning at ZT0) in young adult Wt mice (n = 8, white and white shaded bars) and Tg mice (n = 8, gray and gray shaded bars). Rebound in each group was statistically significant (**P < 0.01, ***P < 0.001). (C) Slow wave activity (SWA) of SWS following 6-h TSD expressed as percentages of the baseline conditions from ZT6 to ZT8 (left part of the panel) and from ZT8 to ZT10 (right part of the panel) in young adult Wt mice (n = 5, white and white shaded bars) and Tg mice (n = 6, gray and gray shaded bars). Data are expressed as the mean ± SEM. Rebound in each group was statistically significant from ZT6 to ZT8 (**P < 0.01) but not from ZT8 to ZT10 (ns: not statistically significant).
Validation of Sleep Deprivation by CaResS Device
In mice equipped for EEG/EMG recordings, activation of the CaResS device for 6 h induced an almost complete sleep loss in Wt and Tg mice (respectively, 97.8% ± 1.1% and 99.2% ± 0.4% of the TSD period spent in waking; Figure 3A). As expected, a rebound of SWS length and SWA occurred following TSD in both Wt and Tg mice (see Figure 3B and 3C). Although younger mice (P24-P28) display a more pronounced sleep pressure, these data provide evidence that our instrumental method induces a “real” TSD of 6 h, challenging the homeostatic sleep regulation.
Sleep Deprivation Assessment in Tg Mice Used for Gene Expression Analysis
In young animals used for FACS-based cell purification, the sleep deprivation efficiency induced by CaResS device was assessed by locomotor activity recordings. Our data indicate that sleep deprived animals displayed an active waking during 73.5% ± 3.6% of the total sleep deprivation time, whereas control animals were only active during 22.8% ± 3.7% of the same 6-h period (Figure 4B). When compared with the EEG data obtained with older Tg and Wt mice (see above), locomotor recordings underestimate the wakefulness period of ≈90 min for 6 h of TSD. Therefore, since activity recordings cannot discriminate between sleep and quiet waking, these data indicate that animals from the TSD group were subjected to a minimum of 4.4 h of effective sleep deprivation reflected by an active waking.
Figure 4.

(A) Plasma glucocorticoid levels in control (CTL) and sleep deprived (TSD) P23-P27 Tg mice. Samples with values ≥ 20 μg/dL were not included in the analysis. No significant difference between groups was observed (P = 0.712, t test). The horizontal bold line represents mean, vertical intervals correspond to SEM, n = 15 in each group. (B) Locomotor activity periods recorded by infrared sensors in the same groups to assess the homogeneity of the TSD in P23-P27 Tg mice. The horizontal bold line represents mean, vertical intervals correspond to SEM, n = 10 in each group. (C) Pattern of locomotor activity by 15-min bins throughout the sleep deprivation period (from ZT0 to ZT6) in the same 2 groups of mice used in panel B. Data expressed as mean ± SEM. In TSD group, each value was compared to the maximum value obtained between ZT0-ZT0.25 (first bar on the left). Significant difference was present only for the last period from ZT5.75 to ZT6 (**P < 0.01).
In particular, the distribution of the locomotor activity analyzed by epoch of 15 min (Figure 4C) indicates that activity decreases in the second part of the sleep deprivation period. However, comparisons between the first epoch of 15 min (ZT0-ZT0.25) when the activity is maximum, and the other epochs revealed that only the last epoch (ZT5.75-ZT6) displayed a significant lower activity level (one-way ANOVA [F23,192 = 1.69, P < 0.05], followed by a Bonferroni multiple comparison test, P < 0.01). This suggests that young mice displayed a sustained activity level throughout the five 5 h of sleep deprivation.
Stress Assessment in Tg Mice Used for Gene Expression Analysis
At the end of the sleep deprivation period, we assessed corticosterone levels in plasma of CTL and TSD animals as an increase in glucocorticoid levels is a reliable marker of stress. To prevent stress-related changes in gene expression, animals whose corticosterone plasma levels were ≥ 20 μg/dL, which corresponds to the maximum of basal level at ZT6,33,34 were not included in the study. Only 3 out of 19 Ctl animals and 4 out of 20 TSD animals were discarded due to elevated plasma corticosterone levels. In selected mice, no difference in plasma glucocorticoid levels was observed between CTL and TSD groups (6.25 ± 1.35 μg/dL vs 5.79 ± 1.14 μg/dL, respectively, Figure 4A). These results validate CaResS as a low-stress device for sleep deprivation.
Astrocytes Enrichment in GFP-Positive Cells
The enrichment by FACS of various brain cell types present in the cerebral cortex was assessed by measuring mRNA expression levels of specific markers selected on the basis of previous transcriptomic profiling studies.27,28 For astrocyte markers, we assessed (in addition to GFAP) the expression of genes encoding aldehyde dehydrogenase 1 family, member L1 (Aldh1l1), and glycolytic enzyme aldolase C (Aldoc). Genes encoding proteins of the myelin-related metabolism such as the myelin associated glycoprotein (Mag) and the myelin-binding protein (Mbp) were used as oligodendrocyte markers. The neuronal fraction was evaluated by analyzing synaptophysin (Syn1) and synaptosomal-associated protein 25 (Snap25) mRNA levels. Finally, the fraction of microglial cells was examined by measuring mRNA levels of the protein tyrosine phosphatase receptor type C (Ptprc also known as Cd45) and of the tumor necrosis factor alpha (TNF-α). As shown in Figure 5, astrocyte markers were highly enriched in the GFP-positive cell fraction, where their level reached a 10-50 fold increase. In contrast, mRNA levels of the oligodendrocyte, neuronal and microglial markers were more abundant in the GFP-negative cell fraction. Thus, a 5-to 20-fold increase in the non-astrocyte markers was measured in the GFP-negative cell fraction.
Figure 5.
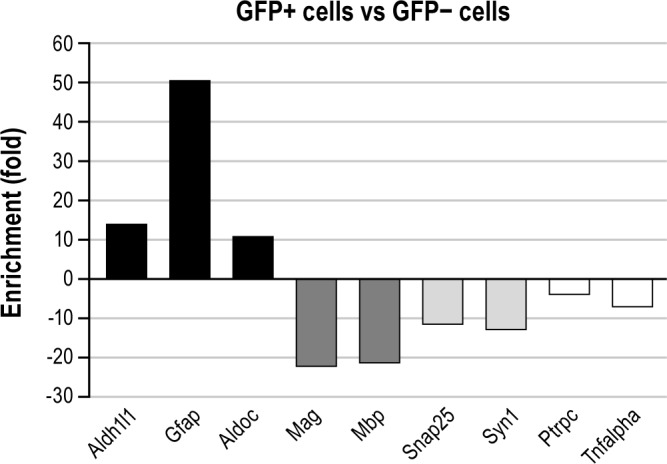
Enrichment of different cell-type markers expressed as fold changes in GFP-positive versus GFP-negative cells. Upward bars represent genes expressed at higher levels in the GFP-positive cells compared to the GFP-negative cell population. Downward bars correspond to genes with higher expression levels in the GFP-negative cell fraction compared to the GFP-positive cell population. Black, dark gray, light gray, and white bars represent astrocytic, oligodendrocytic, neuronal, and microglial markers, respectively. Aldh1l1, aldehyde dehydrogenase 1 family, member L1; Aldoc, aldolase C; Gfap, glial fibrillary acidic protein; Mag, myelin associated glycoprotein; Mbp, myelin basic protein, Ptrpc, protein tyrosine phosphatase, receptor type C; Snap25, synaptosomal-associated protein 25; Syn1, synapsin I; Tnfalpha; tumor necrosis factor alpha.
Levels of Expression of Genes Related to the ANLS in the GFP-Positive and GFP-Negative Cell Fractions
The mRNA levels of genes involved in the ANLS were examined in GFP-positive and GFP-negative cell fractions (Figure 6). Consistent with the astrocytic expression of these proteins, mRNA levels of the glutamate transporter GLT1 and of the α2 subunit of the Na/K ATPase are increased in the GFP-positive cell fraction by 16- and 19-fold, respectively. The mRNA levels of the A and B forms of the LDH were also more abundant, although to a lesser extent, in the GFP-positive cell fraction. In contrast, mRNA levels of MCT1 and GLUT1 were similar in both cell fractions.
Figure 6.

Basal expression levels of genes associated with the ANLS in GFP-positive and GFP-negative cells were measured from one pool of 3 animals sacrificed at ZT6. Basal expression levels were normalized to β-actin mRNA levels in both cell populations. Glut1, glucose transporter type1; Glt1, glutamate transporter 1; Ldha, lactate dehydrogenase type-a; Ldhb, lactate dehydrogenase type-b; Na/K-alpha2, sodium-potassium ATPase pump–alpha2 subunit; Mct1, monocarboxylate transporter type 1.
Validation of Transcriptional Effects of Sleep Deprivation
Protein targeting to glycogen is a protein enriched in astrocytes,28 known to be up-regulated after sleep deprivation.21,22 To validate the identification of genes regulated by sleep deprivation in GFP-positive cells purified by FACS, we examined the expression levels of PTG mRNA in GFP-positive cells. In agreement with previous results,21,22 we found a 37.1% ± 7% (P < 0.05) increase in PTG mRNA expression after TSD in the GFP-positive cell fraction (Figure 7). Since the number of GFP-positive cells is related to the activity of the hGFAP promoter, we verified that GFAP mRNA levels were not modified by the TSD procedure. Our data revealed that neither the number of GFP-positive cells (6,140 ± 1,440 vs 6,650 ± 1,060 for CTL and TSD groups, respectively; n = 15 in each group, P = 0.777, t-test), nor the GFAP mRNA levels (+5% ± 29.1%) were regulated by sleep deprivation.
Figure 7.
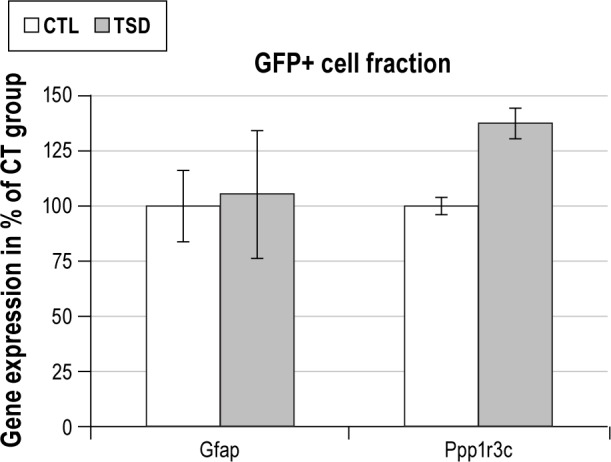
Validation of the transcriptional effects induced by sleep deprivation. Expression levels of Gfap and Ppp1r3c mRNAs were measured in GFP-positive cells from control (CTL) and sleep deprived (TSD) mice. No significant difference between the two groups was observed for Gfap mRNA whereas a significant increase in the expression levels of Ppp1r3c mRNA was observed (P = 0.016, Mann-Whitney test). The mRNA levels were normalized to β-actin mRNA levels and expressed as percentages of CTL. CTL, control conditions; Gfap, glial fibrillary acidic protein; GFP+ cells, green fluorescent protein expressing cells; Ppp1r3c, protein phosphatase 1, regulatory subunit 3C; TSD, total sleep deprivation.
Expression of Genes Involved in the ANLS in GFP-positive and GFP-negative Cell Fractions after Sleep Deprivation
Eight different genes directly involved in the ANLS were tested in GFP-positive and GFP-negative cell fractions. Since levels of expression of these genes are very different in both cell fractions, results are expressed in percentage of the control group (Figure 8). In the GFP-positive cell fraction, 4 of the 8 genes involved in the ANLS were significantly up-regulated at the mRNA level. These genes encode Ldha (+21.1% ± 5.7%, P < 0.05), GLUT1 (+28.4% ± 5.6%, P < 0.05), α2 subunit of Na-K ATPase (+32.1% ± 6.1%, P < 0.05), and GLT1 (+32.1% ± 10.8%, P < 0.05). In contrast, mRNA levels of Ldhb and MCT1 did not show significant differences between GFP-positive and GFP-negative cell fractions (+0.2% ± 5.6% and +16.3% ± 7.7%, with P = 1.00 and P = 0.151, respectively).
Figure 8.

Transcriptional response to sleep deprivation of genes associated with the ANLS in P23-P27 Tg mice. In GFP-positive cells, expression levels of four genes involved in ANLS were significantly induced (*P < 0.05). No significant change was observed for expression levels in GFP-negative cells. For GFP-positive and GFP-negative cells, gene expression (mRNA levels) was normalized to β-actin mRNA levels and expressed as percentages of CTL. Ldha, lactate dehydrogenase type-a; Ldhb, lactate dehydrogenase type-b; Slc16a1 (Mct1), monocarboxylate transporter type 1; Slc16a7 (Mct2), monocarboxylate transporter type 2; Slc2a1 (Glut1), Glucose transporter type1; Atp1a2 (Na/K-alpha2), sodium-potassium ATPase pump–alpha2 subunit; Atp1a3 (Na/K-alpha3), sodium-potassium ATPase pump–alpha3 subunit; Slc1a2 (Glt1), glutamate transporter 1; CTL, control conditions; TSD, total sleep deprivation
The mRNA levels of genes involved in the ANLS in the GFP-negative cell fraction displayed no significant changes, although a trend for higher mRNA levels was detected after TSD for Ldha (+29.8% ± 18.5%, P = 0.222), Ldhb (+9.8% ± 5.8%, P = 0.095), MCT2 (+26.9% ± 26.6%, P = 0.548), and α3 subunit of Na-K ATPase (Atp1a3) (+28.2% ± 27.2%, P = 0.690). Interestingly, GLUT1 mRNA levels in the GFP-negative cell fraction exhibited no change (-1.3% ± 17.4%, P = 1.00) while GLUT1 mRNA levels were up-regulated in the GFP-positive cell fraction.
DISCUSSION
This study provides direct evidence that acute sleep deprivation induces transcriptional regulation of genes related to ANLS in astrocytes. This was achieved by the use of (i) the CaResS device designed to induce sleep deprivation in mice with reduced stress level, thus allowing to investigate transcriptional regulation without interference with high glucocorticoids levels as recently highlighted,35 and (ii) the FACS-based cell purification from cerebral cortex of Tg mice expressing GFP in astrocytes.
Our experiments with young adult Tg and Wt mice equipped for EEG/EMG recordings clearly show that “CaResS” is an efficient device for inducing total sleep deprivation for 6 hours. Therefore we can assume that Tg mice used for FACS-based cell purification underwent a 6-hour TSD. Moreover, measurements of glucocorticoid plasma levels in Tg mice showed that TSD was not associated with significant increases in glucocorticoid levels (Figure 4A). Together, these findings indicate that CaResS is a reliable device to achieve TSD without inducing significant stress levels.
Although no major anatomical and behavioral abnormalities were reported in Tg mice,36 a possible effect of the transgene insertion on sleep parameters could not be excluded. To address this issue, polygraphic recordings were performed in young adult Tg mice. Results showed that Tg mice display no significant difference in their amount of wakefulness, slow wave sleep, or paradoxical sleep during the light and dark periods compared with Wt mice. The temporal organization of the sleep-wake pattern over 24 hours was also similar between Tg and Wt mice, as shown by the light-to-dark ratio of SWS duration (1.25 ± 0.12 and 1.21 ± 0.15 in Tg and Wt mice, respectively). These ratios are consistent with previously reported values for FVB/N mice (1.22 ± 0.08).37 Interestingly, Tg mice exhibited some significant differences in the number and duration of the sleep (SWS and PS) episodes during the light period, suggesting that Tg mice have more fragmented sleep during the rest period. The power spectra of the SWS and PS measured for the light period in baseline conditions also displayed significant changes (Figure 2). In Tg mice, the SWS power spectrum was decreased in the slow waves range (1-2.75 Hz), and the theta peak of the PS power spectrum was also reduced. These results are in agreement with the presence of more fragmented sleep in Tg mice. However, Tg animals exhibited a similar amplitude of SWS rebound induced by 6-hour TSD as reflected by an increase in its length as well as an increase in the SWA. In addition, the time-course of this rebound (i.e., maximum in the first 2 h post-TSD) was similar in Wt and Tg mice. Therefore, we can assume that their homeostatic sleep regulation is similar to that of Wt animals.
While different studies using microarray analysis have shown that the expression of genes involved in energy metabolism was regulated by TSD in rats38 and mice,39,40 the cellular localization of these transcriptional changes remains unknown. Moreover, although previous studies used a similar protocol of TSD (“gentle handling” of 6 h duration), experiments performed in mice led to ambiguous data. For example, gene encoding Ldha was reported by Maret and collaborators to be up-regulated by TSD,40 whereas Mackiewicz and collaborators showed an induction of Ldhb expression.39 This discrepancy between these studies may be ascribed to the anatomical sampling of tissue (whole brain40 versus cerebral cortex39). The use of large tissue samples dilutes changes in mRNA levels occurring in small subpopulations of cells. In addition, undetectable changes in gene expression may result from opposing regulation of transcription in different cell types. These masking effects can be prevented by purifying specific cellular populations by FACS using tissues samples from Tg mice expressing a fluorescent protein. Experiments reported here show that GFP-positive cells are highly enriched in astrocytic cell markers (Figure 5). Moreover, compared to other cell-type purification methods such as translating ribosome affinity purification, laser capture microdissection, or immunopanning, the FACS-based cell purification displays low levels of contamination by other cell types, as well as low levels of stress- and apoptosis-related gene expression.41 In addition, the RNA amount obtained by pooling three samples allowed us to analyze mRNA levels without further amplification, thereby avoiding potential artifacts.
However, while GFP-positive cells were highly enriched in astrocytes, GFP-negative cells consisted of different cell types including inhibitory and excitatory neurons, oligodendrocytes, protoplasmic astrocytes, microglial cells, and cells from blood vessels. Although neuronal cell bodies likely constitute one of the main components of the GFP-negative cell population, this cellular heterogeneity limits its analysis. Moreover, even if we attempt to be reproducible in dissecting the cerebral cortex, it is likely that samples may contain pieces of meninges including pial vessels and parts of corpus callosum containing oligodendrocytes. This could explain the higher variability in gene expression levels observed in the GFP-negative cell population. The use of transgenic mice expressing fluorescent proteins under the control of additional cell-type-specific markers is required to clarify the contribution of these different cell types to gene expression levels.
Due to the difficulty of obtaining healthy dissociated brain cells from mature rodents, isolated cells were usually prepared from early postnatal animals, as it is classically performed to prepare primary cultures of astrocytes. However, even if sleep duration increases after TSD in rats younger than P24,42 slow wave sleep homeostasis, reflected by SWA rebound after TSD, is not present in these young rats.43 Therefore, the mechanisms underlying the neuro-metabolic coupling adaptations across the sleep-wake cycle are probably not fully functional before this developmental stage. Moreover, the fact that ketone body-enriched diet is the main source of fuel for the brain before weaning could mask the effects of sleep deprivation on the regulation of ANLS-associated genes, as suggested by the transcriptional and translational changes shown for lactate and glucose transporters during this period.44,45 On the basis of these observations, we used young weaned animals between P23 and P27. As expected, the number of cortical astrocytes assessed by FACS in these young transgenic mice expressing GFP under the control of the hGFAP promoter is similar to the number of cells determined using an anti-GFAP antibody,46 suggesting (i) that expression of the transgene reflects the endogenous expression of GFAP in cortical astrocytes of Tg mice, and (ii) that P23-P27 mice and adult mice display a similar number of GFAP-positive cells. However, there is evidence that the number of GFAP-positive astrocytes is smaller than the number of astrocytes measured using immunolabeling against the enzyme ALDH1l127,47 or the S100ß protein,46 two other astrocyte markers. A thorough analysis of the brain anatomical distribution of GFP-positive labeling in Tg (hGFAP-GFP) mice revealed a very different astrocyte density ranging from ∼5-15 cells/mm2 in the cerebral cortex to 50-100 cells/mm2 in some hypothalamic nuclei and up to 300-350 cells/mm2 in the lateral geniculate nucleus of the thalamus.46 While the use of pooled samples to increase mRNA levels is a drawback of our method, the number of GFAP-positive cells in hypothalamic or thalamic areas suggests that the FACS-based cell purification technique could be easily used for astrocytes localized in these most restricted areas.
Cortical GFAP immunolabeling preferentially shows fibrous astrocytes, also named type 1 astrocytes, which express high levels of GFAP. These cells are mainly localized in the most superficial layer (I) and in the deepest layers (V and VI) of the neocortex, whereas protoplasmic astrocytes, localized in layers II to IV, express a very low or undetectable level of GFAP protein.48 In addition to this morphological classification, astroglial cells display a great heterogeneity regarding gap junction coupling, membrane currents, calcium signaling, glutamate transporter and receptor expression, gliotransmitters release and volume regulation.49,50 Importantly, no clear functional or gene expression features clearly overlap the morphological differences. For example, the glutamate transporter protein GLT1 is present in both protoplasmic and fibrous astrocytes.28 In the present study, GFP-positive cells correspond to a subset of cortical astrocytes, mainly consisting of fibrous astrocytes. Nevertheless, it is likely that astrocytes that display GLT1 transporters interact with glutamatergic neurons localized in the same cortical layers. Therefore, GFP-positive cells analyzed in this study represent a good model to investigate the regulation of genes involved in ANLS by sleep deprivation.
The similar number of GFP-positive cells and GFAP mRNAs levels in CTL and TSD groups indicates that data are not affected by an effect of TSD on hGFAP promoter activity. Moreover, in agreement with previous studies,21,22 we found a significant induction of Ppp1r3c mRNA expression following TSD (Figure 7). These results validate our cell sorting procedure to study transcriptional changes induced by TSD in astrocytes.
In the GFP-positive cell fraction, the significant increase in the expression of four genes involved in ANLS supports the view that lactate shuttling is modulated at the transcriptional level when wakefulness is prolonged. Increases in GLT1 and Na/K-ATPase α2 subunit mRNA levels are consistent with an activation of the first steps of ANLS, whereby glutamate uptake is directly coupled to sodium extrusion through the Na/K-ATPase.9,51 This tight functional coupling is supported by the anatomical co-expression of GLT1 and Na/K-ATPase α2subunit in glial processes surrounding glutamatergic synapses.52 Moreover, the up-regulation of GLT1, which is predominantly expressed in the cortex at P25, whereas GLAST is more expressed in the cerebellum,53,54 is in agreement with the progressive increase in the extracellular glutamate concentration observed during wakefulness episodes55 and after 3 hours of sleep deprivation in rat cerebral cortex.56 Together, these observations support the concept, previously proposed by Frank,57,58 that astrocytes may act as “wakefulness integrators,” through its involvement in glutamate uptake and ANLS function.
Although transcriptional regulation of GLUT1 has been demonstrated in the cerebral cortex of sleep deprived animals,38 our results show for the first time that the up-regulation of GLUT1 mRNA levels by TSD occurs preferentially in fibrous astrocytes and not in GFP-negative cells such as endothelial cells where GLUT1 is also strongly expressed. Considering that extracellular glucose levels measured by enzymatic biosensors are decreased during active-wake,59 this suggests that, in agreement with glycolysis stimulation predicted by the ANLS model, astrocytes may rapidly transport glucose. In contrast, extracellular lactate levels are increased during forced activity in rat cerebral cortex.60 Interestingly, only a small and nonsignificant increase in MCT1 mRNA levels (+16.3% ± 7.7%, P = 0.15) was found in GFP-positive cells. Considering that MCT1 is a high affinity monocarboxylate transporter with a Km of about 3.5 mM,61 and that the extracellular lactate concentration ranges from 0.5 to 2 mM, these data suggest that, even during sustained activity, lactate transport through MCT1 is not saturated and does not require de novo transporter synthesis. In addition, we cannot exclude the involvement of MCT4, another subtype of MCT expressed in astrocytes.62
Among important steps in ANLS are the formation of lactate from pyruvate in astrocytes and the production of pyruvate from lactate in neurons. In mammals, these reactions are catalyzed by LDH, a family of enzymes including 5 isoforms, each consisting of tetramers of M and H subunits. The M (muscle or LDH5) and H (heart or LDH1) subunits are encoded by the Ldha (or Ldh1) and the Ldhb (or Ldh2) genes, respectively. Depending on the tissue expression of these isozymes, LDH activity exhibits distinct physical and catalytic properties. For instance, while the M4 and M3H1 isozymes preferentially catalyze the reduction of pyruvate to lactate in anaerobic tissues, the H4 and H3M1 isozymes oxidize lactate to pyruvate in aerobic tissues. As shown in Figure 6, GFP-positive cells express higher levels of Ldhb than Ldha mRNAs, whereas a threefold higher expression of Ldha compared to Ldhb is shown in GFP-negative cells. These results are in agreement with the 13-fold enrichment of Ldhb in astrocytes shown by Lovatt and colleagues.28 The marginal difference between the levels of Ldha and Ldhb mRNAs found in cortical astrocytes (Figure 6) is consistent with the co-expression of LDH1 and LDH5 in human astrocytes.63 Together, these observations support the view that astrocytes do not only operate in a “glycolytic mode” but can also shift to “an aerobic mode” depending on the abundance of substrates and neuronal demand. While in sleep deprived animals, Ldha mRNA levels are significantly increased in GFP-positive cell fraction, Ldhb mRNA levels are unchanged, suggesting that the synthesis of LDH-M subunit favors the production of lactate in astrocytes. When comparing TSD and CTL groups, our data show a trend, although statistically nonsignificant, toward higher levels of Ldhb mRNAs in GFP-negative cells (≈+10%), that may result from glutamatergic neurons.
Together with data from other groups showing an increase in cortical glutamate and lactate levels during wakefulness,64,65 our results support the idea that the increase in extracellular brain lactate may be consistent with the ANLS model. This is in agreement with the positive correlation of the high to low theta frequencies ratio with the extracellular release of lactate observed during prolonged wakefulness in rat basal forebrain66 and with the recent study of Wisor and colleagues, showing that the decrease in slow oscillations (1 Hz) induced by the optogenetic stimulation of cortical pyramidal cells induced a decline in extracellular lactate.67 However, in our study, we cannot exclude that a part of these changes may also result from the locomotor activity associated with the TSD procedure. In this regard, human experiments have shown that peripheral blood lactate levels are in equilibrium with their extracellular brain concentration,68 and that exercise increases brain lactate.69
The direct involvement of astrocytes in the homeostatic regulation of sleep was shown by a series of experiments initiated in Haydon's laboratory, using mice expressing a dominant negative SNARE domain in astrocytes. In these experiments, they showed that blockade of the vesicular release of ATP impairs the tonic adenosine receptor-mediated inhibition and, consequently, decreases the cortical slow waves and the SWS homeostasis.70–72 Interestingly, these genetic manipulations are expressed in GFAP-positive astrocytes,73 which corresponds to the similar cell type where changes in expression of ANLS-related genes were observed. In physiological conditions (except for torpor and hibernation), cellular ATP is mainly produced by glucose oxidation. Therefore, the existence of a direct link between our data regarding the ANLS regulation and the sleep homeostasis mechanisms described by Halassa and colleagues is an intriguing issue. However, the relationship between the pool of ATP used as gliotransmitter and ATP produced by the astrocytic energy metabolism is not clearly understood. According to previous data about ANLS model, one molecule of glutamate taken up by astrocytes leads to the oxidation of one molecule of glucose through glycolysis. Therefore, two molecules of lactate are produced and can be released and used as neuronal fuel. Through this mechanism, ATP consumption and production are balanced, and it seems unlikely that it serves to provide ATP involved in vesicular release. Therefore, although our data suggest that activation of glycolysis through the ANLS is not coupled directly to ATP release, we cannot exclude the contribution of other mechanisms of coupling such as K+ uptake known to increase the rate of glycogenolysis74 and the increase in glycogen turnover as suggested by our previous studies.22,75
Using a new approach combining the use of CaResS device to achieve low stressful TSD together with FACS-based cell purification of GFP-expressing astrocytes from the cerebral cortex of Tg mice, we show that sleep loss induces transcriptional regulation of ANLS-related genes in fibrous astrocytes. To our knowledge, this is the first observation of changes in gene expression in astrocytes by sleep disturbances. In addition, these results strengthen the role of astrocytes in energy homeostasis associated with the sleep-wake cycle.
DISCLOSURE STATEMENT
The authors have indicated no financial conflicts of interest. This is not a company-supported study.
ACKNOWLEDGMENTS
The authors warmly thank M. Garcia, G. Tapia, and S. Winkler of the Flow Cytometry Core Facility (Life Sciences Faculty, EPFL, Lausanne, Switzerland) for their technical expertise. This work was supported by a Swiss National Science Foundation grant (3100AO-108336/1) to Dr. Magistretti.
Footnotes
A commentary on this article appears in this issue on page 1413.
REFERENCES
- 1.Wang DD, Bordey A. The astrocyte odyssey. Progr Neurobiol. 2008;86:342–67. doi: 10.1016/j.pneurobio.2008.09.015. [DOI] [PMC free article] [PubMed] [Google Scholar]
- 2.Carmignoto G, Gómez-Gonzalo M. The contribution of astrocyte signalling to neurovascular coupling. Brain Res Rev. 2010;63:138–48. doi: 10.1016/j.brainresrev.2009.11.007. [DOI] [PubMed] [Google Scholar]
- 3.Perea G, Navarrete M, Araque A. Tripartite synapses: astrocytes process and control synaptic information. Trend Neurosci. 2009;32:421–31. doi: 10.1016/j.tins.2009.05.001. [DOI] [PubMed] [Google Scholar]
- 4.Figley CR, Stroman PW. The role(s) of astrocytes and astrocyte activity in neurometabolism, neurovascular coupling, and the production of functional neuroimaging signals. Eur J Neurosci. 2011;33:577–88. doi: 10.1111/j.1460-9568.2010.07584.x. [DOI] [PubMed] [Google Scholar]
- 5.Magistretti PJ. Neuron-glia metabolic coupling and plasticity. J Exp Biol. 2006;209:2304–11. doi: 10.1242/jeb.02208. [DOI] [PubMed] [Google Scholar]
- 6.Magistretti PJ, Morrison JH, Shoemaker WJ, Sapin V, Bloom FE. Vasoactive intestinal polypeptide induces glycogenolysis in mouse cortical slices: a possible regulatory mechanism for the local control of energy metabolism. Proc Natl Acad Sci. 1981;78:6535–9. doi: 10.1073/pnas.78.10.6535. [DOI] [PMC free article] [PubMed] [Google Scholar]
- 7.Pellerin L, Magistretti PJ. Glutamate uptake into astrocytes stimulates aerobic glycolysis: a mechanism coupling neuronal activity to glucose utilization. Proc Natl Acad Sci. 1994;91:10625–9. doi: 10.1073/pnas.91.22.10625. [DOI] [PMC free article] [PubMed] [Google Scholar]
- 8.Swanson RA, Morton MM, Sagar SM, Sharp FR. Sensory stimulation induces local cerebral glycogenolysis: Demonstration by autoradiography. Neuroscience. 1992;51:451–61. doi: 10.1016/0306-4522(92)90329-z. [DOI] [PubMed] [Google Scholar]
- 9.Pellerin L, Magistretti PJ. Glutamate uptake stimulates Na+, K+-ATPase activity in astrocytes via activation of a distinct subunit highly sensitive to ouabain. J Neurochem. 1997;69:2132–7. doi: 10.1046/j.1471-4159.1997.69052132.x. [DOI] [PubMed] [Google Scholar]
- 10.Maddock RJ, Buonocore MH, Copeland LE, Richards AL. Elevated brain lactate responses to neural activation in panic disorder: a dynamic 1H-MRS study. Mol Psychiatry. 2008;14:537–45. doi: 10.1038/sj.mp.4002137. [DOI] [PubMed] [Google Scholar]
- 11.Urrila AS, Hakkarainen A, Heikkinen S, et al. Metabolic imaging of human cognition: An fMRI/1H-MRS study of brain lactate response to silent word generation. J Cereb Blood Flow Metab. 2003;23:942–8. doi: 10.1097/01.WCB.0000080652.64357.1D. [DOI] [PubMed] [Google Scholar]
- 12.Pellerin L, Halestrap AP, Pierre K. Cellular and subcellular distribution of monocarboxylate transporters in cultured brain cells and in the adult brain. J Neurosci Res. 2005;79:55–64. doi: 10.1002/jnr.20307. [DOI] [PubMed] [Google Scholar]
- 13.Dringen R, Gebhardt R, Hamprecht B. Glycogen in astrocytes: possible function as lactate supply for neighboring cells. Brain Res. 1993;623:208–14. doi: 10.1016/0006-8993(93)91429-v. [DOI] [PubMed] [Google Scholar]
- 14.Tekkök SB, Brown AM, Westenbroek R, Pellerin L, Ransom BR. Transfer of glycogen-derived lactate from astrocytes to axons via specific monocarboxylate transporters supports mouse optic nerve activity. J Neurosci Res. 2005;81:644–52. doi: 10.1002/jnr.20573. [DOI] [PubMed] [Google Scholar]
- 15.Sickmann HM, Walls AB, Schousboe A, Bouman SD, Waagepetersen HS. Functional significance of brain glycogen in sustaining glutamatergic neurotransmission. J Neurochem. 2009;109:80–6. doi: 10.1111/j.1471-4159.2009.05915.x. [DOI] [PubMed] [Google Scholar]
- 16.Suzuki A, Stern Sarah A, Bozdagi O, et al. Astrocyte-neuron lactate transport is required for long-term memory formation. Cell. 2011;144:810–23. doi: 10.1016/j.cell.2011.02.018. [DOI] [PMC free article] [PubMed] [Google Scholar]
- 17.Vyazovskiy VV, Olcese U, Lazimy YM, et al. Cortical firing and sleep homeostasis. Neuron. 2009;63:865–78. doi: 10.1016/j.neuron.2009.08.024. [DOI] [PMC free article] [PubMed] [Google Scholar]
- 18.Maquet P. Positron emission tomography studies of sleep and sleep disorders. J Neurol. 1997;244:S23–S8. doi: 10.1007/BF03160568. [DOI] [PubMed] [Google Scholar]
- 19.Nofzinger EA, Buysse DJ, Miewald JM, et al. Human regional cerebral glucose metabolism during non-rapid eye movement sleep in relation to waking. Brain. 2002;125:1105–15. doi: 10.1093/brain/awf103. [DOI] [PubMed] [Google Scholar]
- 20.Buchsbaum MS, Hazlett EA, Wu J, Jr., B W. Positron emission tomography with deoxyglucose-F18 imaging of sleep. Neuropsychopharmacology. 2001;25(5 Suppl):S50–6. doi: 10.1016/S0893-133X(01)00339-6. [DOI] [PubMed] [Google Scholar]
- 21.Petit J-M, Tobler I, Allaman I, Borbély AA, Magistretti PJ. Sleep deprivation modulates brain mRNAs encoding genes of glycogen metabolism. Eur J Neurosci. 2002;16:1163–7. doi: 10.1046/j.1460-9568.2002.02145.x. [DOI] [PubMed] [Google Scholar]
- 22.Petit J-M, Tobler I, Kopp C, Morgenthaler F, Borbély A, Magistretti PJ. Metabolic response of the cerebral cortex following gentle sleep deprivation and modafinil administration. Sleep. 2010;33:901–8. doi: 10.1093/sleep/33.7.901. [DOI] [PMC free article] [PubMed] [Google Scholar]
- 23.Cirelli C. A Molecular window on sleep: changes in gene expression between sleep and wakefulness. Neuroscientist. 2005;11:63–74. doi: 10.1177/1073858404270900. [DOI] [PubMed] [Google Scholar]
- 24.Cirelli C. The genetic and molecular regulation of sleep: from fruit flies to humans. Nat Rev Neurosci. 2009;10:549–60. doi: 10.1038/nrn2683. [DOI] [PMC free article] [PubMed] [Google Scholar]
- 25.Zhuo L, Sun B, Zhang C-L, Fine A, Chiu S-Y, Messing A. Live astrocytes visualized by green fluorescent protein in transgenic mice. developmental biology. 1997;187:36–42. doi: 10.1006/dbio.1997.8601. [DOI] [PubMed] [Google Scholar]
- 26.Zuo Y, Lubischer JL, Kang H, et al. Fluorescent proteins expressed in mouse transgenic lines mark subsets of glia, neurons, macrophages, and dendritic cells for vital examination. J Neurosci. 2004;24:10999–1009. doi: 10.1523/JNEUROSCI.3934-04.2004. [DOI] [PMC free article] [PubMed] [Google Scholar]
- 27.Cahoy JD, Emery B, Kaushal A, et al. A transcriptome database for astrocytes, neurons, and oligodendrocytes: a new resource for understanding brain development and function. J Neurosci. 2008;28:264–78. doi: 10.1523/JNEUROSCI.4178-07.2008. [DOI] [PMC free article] [PubMed] [Google Scholar]
- 28.Lovatt D, Sonnewald U, Waagepetersen HS, et al. The transcriptome and metabolic gene signature of protoplasmic astrocytes in the adult murine cortex. J Neurosci. 2007;27:12255–66. doi: 10.1523/JNEUROSCI.3404-07.2007. [DOI] [PMC free article] [PubMed] [Google Scholar]
- 29.Lichter-Konecki U, Mangin JM, Gordish-dressman H, Hoffman EP, Gallo V. Gene expression profiling of astrocytes from hyperammonemic mice reveals altered pathways for water and potassium homeostasis in vivo. Glia. 2008;56:365–77. doi: 10.1002/glia.20624. [DOI] [PMC free article] [PubMed] [Google Scholar]
- 30.Baud MO, Magistretti PJ, Petit J-M. Sustained sleep fragmentation affects brain temperature, food intake and glucose tolerance in mice. J Sleep Res. 2013;22:3–12. doi: 10.1111/j.1365-2869.2012.01029.x. [DOI] [PubMed] [Google Scholar]
- 31.Petit J-M, Haeberli C, Singy A, Burlet-Godinot S, Steimer T, Magistretti PJ. Assessment of stress and behavioural effects induced by “CaResS”, a new device designed for sleep restriction/deprivation studies in mice. J Sleep Res. 2006;15:175. [Google Scholar]
- 32.Tobler I, Deboer T, Fischer M. Sleep and sleep regulation in normal and prion protein-deficient mice. J Neurosci. 1997;17:1869–79. doi: 10.1523/JNEUROSCI.17-05-01869.1997. [DOI] [PMC free article] [PubMed] [Google Scholar]
- 33.Alexander JK, DeVries AC, Kigerl KA, Dahlman JM, Popovich PG. Stress exacerbates neuropathic pain via glucocorticoid and NMDA receptor activation. Brain Behav Immun. 2009;23:851–60. doi: 10.1016/j.bbi.2009.04.001. [DOI] [PMC free article] [PubMed] [Google Scholar]
- 34.Ghoshal K, Wang Y, Sheridan JF, Jacob ST. Metallothionein induction in response to restraint stress. J Biol Chem. 1998;273:27904–10. doi: 10.1074/jbc.273.43.27904. [DOI] [PMC free article] [PubMed] [Google Scholar]
- 35.Mongrain V, Hernandez SA, Pradervand S, et al. Separating the contribution of glucocorticoids and wakefulness to the molecular and electrophysiological correlates of sleep homeostasis. Sleep. 2010;33:1147–57. doi: 10.1093/sleep/33.9.1147. [DOI] [PMC free article] [PubMed] [Google Scholar]
- 36.Nolte C, Matyash M, Pivneva T, et al. GFAP promoter-controlled EGFP-expressing transgenic mice: A tool to visualize astrocytes and astrogliosis in living brain tissue. Glia. 2001;33:72–86. [PubMed] [Google Scholar]
- 37.Toth LA, Verhulst SJ. Strain differences in sleep patterns of healthy and influenza-infected inbred mice. Behav Genet. 2003;33:325–36. doi: 10.1023/a:1023402709896. [DOI] [PubMed] [Google Scholar]
- 38.Cirelli C, Tononi G. Gene expression in the brain across the sleep-waking cycle. Brain Res. 2000;885:303–21. doi: 10.1016/s0006-8993(00)03008-0. [DOI] [PubMed] [Google Scholar]
- 39.Mackiewicz M, Shockley KR, Romer MA, et al. Macromolecule biosynthesis: a key function of sleep. Physiol Genomics. 2007;31:441–57. doi: 10.1152/physiolgenomics.00275.2006. [DOI] [PubMed] [Google Scholar]
- 40.Maret Sp, Dorsaz Sp, Gurcel L, et al. Homer1a is a core brain molecular correlate of sleep loss. Proc Natl Acad Sci. 2007;104:20090–5. doi: 10.1073/pnas.0710131104. [DOI] [PMC free article] [PubMed] [Google Scholar]
- 41.Okaty BW, Sugino K, Nelson SB. A quantitative comparison of cell-type-specific microarray gene expression profiling methods in the mouse brain. PLoS One. 2011;6:e16493. doi: 10.1371/journal.pone.0016493. [DOI] [PMC free article] [PubMed] [Google Scholar]
- 42.Hairston IS, Peyron C, Denning DP, et al. Sleep deprivation effects on growth factor expression in neonatal rats: a potential role for BDNF in the mediation of delta power. J Neurophysiol. 2004;91:1586–95. doi: 10.1152/jn.00894.2003. [DOI] [PubMed] [Google Scholar]
- 43.Frank MG, Morrissette R, Heller HC. Effects of sleep deprivation in neonatal rats. Am J Physiol Regul Integr Comp Physiol. 1998;275:R148–R57. doi: 10.1152/ajpregu.1998.275.1.R148. [DOI] [PubMed] [Google Scholar]
- 44.Pellerin L, Pellegri G, Martin J-L, Magistretti PJ. Expression of monocarboxylate transporter mRNAs in mouse brain: Support for a distinct role of lactate as an energy substrate for the neonatal vs. adult brain. Proc Natl Acad Sci. 1998;95:3990–5. doi: 10.1073/pnas.95.7.3990. [DOI] [PMC free article] [PubMed] [Google Scholar]
- 45.Vannucci SJ, Simpson IA. Developmental switch in brain nutrient transporter expression in the rat. Am J Physiol Endocrinol Metab. 2003;285:E1127–E34. doi: 10.1152/ajpendo.00187.2003. [DOI] [PubMed] [Google Scholar]
- 46.Emsley J, Macklis J. Astroglial heterogeneity closely reflects the neuronal-defined anatomy of the adult murine CNS. Neuron Glia Biol. 2006;2:175–86. doi: 10.1017/S1740925X06000202. [DOI] [PMC free article] [PubMed] [Google Scholar]
- 47.Yang Y, Vidensky S, Jin L, et al. Molecular comparison of GLT1+ and ALDH1L1+ astrocytes in vivo in astroglial reporter mice. Glia. 2011;59:200. doi: 10.1002/glia.21089. [DOI] [PMC free article] [PubMed] [Google Scholar]
- 48.Kálmán M, Hajós F. Distribution of glial fibrillary acidic protein (GFAP)-immunoreactive astrocytes in the rat brain. Exp Brain Res. 1989;78:147–63. doi: 10.1007/BF00230694. [DOI] [PubMed] [Google Scholar]
- 49.Kimelberg HK. Functions of mature mammalian astrocytes: a current view. Neuroscientist. 2010;16:79–106. doi: 10.1177/1073858409342593. [DOI] [PubMed] [Google Scholar]
- 50.Zhang Y, Barres BA. Astrocyte heterogeneity: an underappreciated topic in neurobiology. Curr Opin Neurobiol. 2010;20:588–94. doi: 10.1016/j.conb.2010.06.005. [DOI] [PubMed] [Google Scholar]
- 51.Chatton JY, Marquet P, Magistretti PJ. A quantitative analysis of l-glutamate-regulated Na+ dynamics in mouse cortical astrocytes: implications for cellular bioenergetics. Eur J Neurosci. 2000;12:3843–53. doi: 10.1046/j.1460-9568.2000.00269.x. [DOI] [PubMed] [Google Scholar]
- 52.Cholet N, Pellerin L, Magistretti PJ, Hamel E. Similar perisynaptic glial localization for the Na+,K+-ATPase α2 Subunit and the glutamate transporters GLAST and GLT-1 in the rat somatosensory cortex. Cereb Cortex. 2002;12:515–25. doi: 10.1093/cercor/12.5.515. [DOI] [PubMed] [Google Scholar]
- 53.Furuta A, Rothstein JD, Martin LJ. Glutamate Transporter protein subtypes are expressed differentially during rat CNS development. J Neurosci. 1997;17:8363–75. doi: 10.1523/JNEUROSCI.17-21-08363.1997. [DOI] [PMC free article] [PubMed] [Google Scholar]
- 54.Regan MR, Huang YH, Kim YS, et al. Variations in promoter activity reveal a differential expression and physiology of glutamate transporters by glia in the developing and mature CNS. J Neurosci. 2007;27:6607–19. doi: 10.1523/JNEUROSCI.0790-07.2007. [DOI] [PMC free article] [PubMed] [Google Scholar]
- 55.John J, Ramanathan L, Siegel JM. Rapid changes in glutamate levels in the posterior hypothalamus across sleep-wake states in freely behaving rats. Am J Physiol Regul Integr Comp Physiol. 2008;295:R2041–R9. doi: 10.1152/ajpregu.90541.2008. [DOI] [PMC free article] [PubMed] [Google Scholar]
- 56.Dash MB, Douglas CL, Vyazovskiy VV, Cirelli C, Tononi G. Long-term homeostasis of extracellular glutamate in the rat cerebral cortex across sleep and waking states. J Neurosci. 2009;29:620–9. doi: 10.1523/JNEUROSCI.5486-08.2009. [DOI] [PMC free article] [PubMed] [Google Scholar]
- 57.Frank MG. Beyond the neuron: astroglial regulation of mammalian sleep. Curr Top Med Chem. 2011;11:2452–6. doi: 10.2174/156802611797470321. [DOI] [PubMed] [Google Scholar]
- 58.Frank MG. Astroglial regulation of sleep homeostasis. Curr Opin Neurobiol. 2013. http://dx.doi.org/10.1016/j.conb.2013.02.009. [Epub ahead of print] [DOI] [PubMed]
- 59.Netchiporouk L, Shram N, Salvert D, Cespuglio R. Brain extracellular glucose assessed by voltammetry throughout the rat sleep-wake cycle. Eur J Neurosci. 2001;13:1429. doi: 10.1046/j.0953-816x.2001.01503.x. [DOI] [PubMed] [Google Scholar]
- 60.Shram N, Netchiporouk L, Cespuglio R. Lactate in the brain of the freely moving rat: voltammetric monitoring of the changes related to the sleep-wake states. Eur J Neurosci. 2002;16:461. doi: 10.1046/j.1460-9568.2002.02081.x. [DOI] [PubMed] [Google Scholar]
- 61.Bröer S, Schneider HP, Bröer A, Rahman B, Hamprecht B, Deitmer JW. Characterization of the monocarboxylate transporter 1 expressed in Xenopus laevis oocytes by changes in cytosolic pH. Biochem J. 1998;333:167–74. doi: 10.1042/bj3330167. [DOI] [PMC free article] [PubMed] [Google Scholar]
- 62.Rafiki A, Boulland JL, Halestrap AP, Ottersen OP, Bergersen L. Highly differential expression of the monocarboxylate transporters MCT2 and MCT4 in the developing rat brain. Neuroscience. 2003;122:677–88. doi: 10.1016/j.neuroscience.2003.08.040. [DOI] [PubMed] [Google Scholar]
- 63.Bittar PG, Charnay Y, Pellerin L, Bouras C, Magistretti PJ. Selective distribution of lactate dehydrogenase isoenzymes in neurons and astrocytes of human brain. J Cereb Blood Flow Metab. 1996;16:1079–89. doi: 10.1097/00004647-199611000-00001. [DOI] [PubMed] [Google Scholar]
- 64.Dash MB, Tononi G, Cirelli C. Extracellular levels of lactate, but not oxygen, reflect sleep homeostasis in the rat cerebral cortex. Sleep. 2012;35:909–19. doi: 10.5665/sleep.1950. [DOI] [PMC free article] [PubMed] [Google Scholar]
- 65.Naylor E, Aillon D, Barrett B, et al. Lactate as a biomarker for sleep. Sleep. 2012;35:1209–22. doi: 10.5665/sleep.2072. [DOI] [PMC free article] [PubMed] [Google Scholar]
- 66.Wigren H-K, Rytkönen K-M, Porkka-Heiskanen T. Basal forebrain lactate release and promotion of cortical arousal during prolonged waking is attenuated in aging. J Neurosci. 2009;29:11698–707. doi: 10.1523/JNEUROSCI.5773-08.2009. [DOI] [PMC free article] [PubMed] [Google Scholar]
- 67.Wisor JP, Rempe MJ, Schmidt MA, Moore ME, Clegern WC. Sleep slow-wave activity regulates cerebral glycolytic metabolism. Cereb Cortex. 2013;23:1978–87. doi: 10.1093/cercor/bhs189. [DOI] [PMC free article] [PubMed] [Google Scholar]
- 68.Boumezbeur F, Petersen KF, Cline GW, et al. The contribution of blood lactate to brain energy metabolism in humans measured by dynamic 13C nuclear magnetic resonance spectroscopy. J Neurosci. 2010;30:13983–91. doi: 10.1523/JNEUROSCI.2040-10.2010. [DOI] [PMC free article] [PubMed] [Google Scholar]
- 69.Quistorff B, Secher NH, Van Lieshout JJ. Lactate fuels the human brain during exercise. FASEB J. 2008;22:3443–9. doi: 10.1096/fj.08-106104. [DOI] [PubMed] [Google Scholar]
- 70.Fellin T, Halassa MM, Terunuma M, et al. Endogenous nonneuronal modulators of synaptic transmission control cortical slow oscillations in vivo. Proc Natl Acad Sci. 2009;106:15037–42. doi: 10.1073/pnas.0906419106. [DOI] [PMC free article] [PubMed] [Google Scholar]
- 71.Halassa MM, Florian C, Fellin T, et al. Astrocytic modulation of sleep homeostasis and cognitive consequences of sleep loss. Neuron. 2009;61:213–9. doi: 10.1016/j.neuron.2008.11.024. [DOI] [PMC free article] [PubMed] [Google Scholar]
- 72.Schmitt LI, Sims RE, Dale N, Haydon PG. Wakefulness affects synaptic and network activity by increasing extracellular astrocyte-derived adenosine. J Neurosci. 2012;32:4417–25. doi: 10.1523/JNEUROSCI.5689-11.2012. [DOI] [PMC free article] [PubMed] [Google Scholar]
- 73.Pascual O, Casper KB, Kubera C, et al. Astrocytic purinergic signaling coordinates synaptic networks. Science. 2005;310:113–6. doi: 10.1126/science.1116916. [DOI] [PubMed] [Google Scholar]
- 74.Choi HB, Gordon Grant RJ, Zhou N, et al. Metabolic communication between astrocytes and neurons via bicarbonate-responsive soluble adenylyl cyclase. Neuron. 2012;75:1094–104. doi: 10.1016/j.neuron.2012.08.032. [DOI] [PMC free article] [PubMed] [Google Scholar]
- 75.Morgenthaler FD, Lanz BR, Petit J-M, Frenkel H, Magistretti PJ, Gruetter R. Alteration of brain glycogen turnover in the conscious rat after 5 h of prolonged wakefulness. Neurochem Int. 2009;55:45–51. doi: 10.1016/j.neuint.2009.02.023. [DOI] [PMC free article] [PubMed] [Google Scholar]