Abstract
Study Objectives:
Our previous studies showed that evoked hemodynamic responses are smaller during wake compared to sleep; suggesting neural activity is associated with vascular expansion and decreased compliance. We explored whether prolonged activity during sleep deprivation may exacerbate vascular expansion and blunt hemodynamic responses.
Design:
Evoked auditory responses were generated with periodic 65dB speaker clicks over a 72-h period and measured with cortical electrodes. Evoked hemodynamic responses were measured simultaneously with optical techniques using three light-emitting diodes, and a photodiode.
Setting:
Animals were housed in separate 30×30×80cm enclosures, tethered to a commutator system and maintained on a 12-h light/dark cycle. Food and water were available ad libitum.
Patients or Participants:
Seven adult female Sprague-Dawley rats.
Interventions:
Following a 24-h baseline recording, sleep deprivation was initiated for 0 to 10 h by gentle handling, followed by a 24-h recovery sleep recording. Evoked electrical and hemodynamic responses were measured before, during, and after sleep deprivation.
Measurements and Results:
Following deprivation, evoked hemodynamic amplitudes were blunted. Steady-state oxyhemoglobin concentration increased during deprivation and remained high during the initial recovery period before returning to baseline levels after approximately 9-h.
Conclusions:
Sleep deprivation resulted in blood vessel expansion and decreased compliance while lower basal neural activity during recovery sleep may allow blood vessel compliance to recover. Chronic sleep restriction or sleep deprivation could push the vasculature to critical levels, limiting blood delivery, and leading to metabolic deficits with the potential for neural trauma.
Citation:
Phillips DJ; Schei JL; Rector DM. Vascular compliance limits during sleep deprivation and recovery sleep. SLEEP 2013;36(10):1459-1470.
Keywords: Optical imaging, evoked response potentials, hemoglobin, rat, metabolism
INTRODUCTION
Neural activity initiates increased local blood volume and flow,1–7 which is the basis for many functional neuroimaging methods such as functional magnetic resonance imaging (fMRI), positron emission tomography (PET), and diffuse optical imaging. Such imaging methods demonstrate a positive correlation between average tissue activity levels and blood volume/flow, presumably to deliver metabolites concomitant with demand.8 Increased cerebral blood volume is a consequence of blood vessel dilation, which can be modulated by chemical signals such as adenosine, nitric oxide (NO), tumor necrosis factor (TNF), and interleukin-1 (IL-1). Such signals are also considered sleep regulatory substances and are released by metabolically active cells.9 High basal neural activity may require continual metabolic delivery; however, cranial vascular expansion could be limited due to physical constraints. These restrictions may not be met under normal conditions; however, high and sustained tissue activity during sleep deprivation or restriction may lead to increased blood volume, and vessels may approach expansion limits, resulting in blunted evoked hemodynamic responses.10 If expansion limits are sustained, metabolic demand may exceed supply. Sleep may serve as a mechanism for vascular compliance recovery because brain metabolism is reduced,11 providing an opportunity for vessel relaxation and metabolic restoration.9
Prolonged waking periods and sleep deprivation are common occurrences12 although there are a variety of health and performance implications, including cognitive function deficits,13–15 metabolic and endocrine deficits,16 reduced learning capacity,17,18 slower response times and increased errors,19,20 and possibly death.21 Although cognitive and learning deficits are reversible with sleep, physiological recovery following sleep deprivation is not well understood. Metabolite delivery is of critical importance, and insufficient nutrient supply compared to the demand may result in neural tissue trauma.22 We are interested in understanding the vascular and metabolic consequences of sleep deprivation and how they may relate to neural activity.
Because the vasculature may be in a semi-dilated state during wake,10 two important questions must be asked: (1) How does extended waking or sleep deprivation affect blood delivery? and (2) What, if any, are the physical limits of blood delivery to the brain? To test whether prolonged neural activity could lead to vascular expansion and reduced compliance, we measured evoked electrical responses from neural activation and simultaneously used near-infrared spectrophotometry at three wavelengths to determine changes in oxygenated and deoxygenated hemoglobin concentration during varying sleep deprivation conditions. Potential energy deficits may occur if neural activity is high and hemoglobin delivery reaches critical limits. With longer sleep deprivation periods, we expected that the evoked response potential (ERP) amplitude would increase due to enhanced slow wave activity (SWA) during recovery sleep.23 We also expected that the steady-state oxygenated hemoglobin (HbO2) concentration would increase to meet the nutrient demand, whereas the evoked hemodynamic response would decrease due to limits in vascular compliance. During recovery sleep, the HbO2 steady state should remain high, and evoked hemodynamic responses will be blunted until metabolic demand is satiated and vessels are allowed to relax.
MATERIALS AND METHODS
Surgical Procedure
Adult female Sprague-Dawley rats weighing 240-300 g (n = 7, Simonsen Laboratories, Gilroy, CA) were induced into an anesthetized state with 5% isoflurane in oxygen, and then maintained at 2.5% to implant our recording devices. The dorsal skull surface was exposed and we implanted six blunted stainless steel screw electrodes (J.I. Morris, Southbridge, MA, F00CE188): two over each frontal lobe, two over each parietal lobe, and two over each occipital lobe. Frontal and parietal electrodes were used to measure the electroencephalogram (EEG) and ERPs. Electrodes implanted in the occipital lobe served as a reference. Three light-emitting diodes (LEDs, 1.6 mW B5b-436-30, 6 mW ELD-810-17, and 10 mW ELC-880-17, Roithner Lasertechnik, GmbH, Vienna, Austria) emitting 660 nm, 810 nm, and 880 nm light were placed 1 mm rostral to lambda and medial to the temporal ridge. To collect LED light scattered by the cortex, a photodiode (PC1-6, Pacific Silicon Sensors, Westlake Village, CA, USA) was positioned 3 mm rostral to the LEDs (Figures 1A and 1B). To measure electromyographic (EMG) activity, two multistranded Teflon-insulated stainless steel wires (New England Wire, Lisbon, NH, 212-50F-357-0), with 2 mm exposed wire, were inserted into the neck muscles. Electrocardiographic (EKG) rhythms were measured by two wires, with 4 mm exposed, inserted subcutaneously along either side of the thoracic cavity. All procedures were approved by the Washington State University Animal Care and Use Committee.
Figure 1.
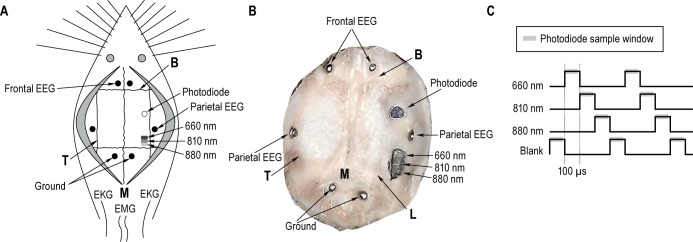
(A) Typical implant configuration. Animals were implanted with three light-emitting diodes (LEDs, 660 nm, 810 nm, and 880 nm) over the parietal lobe. To measure scattered light, a photodiode (open circle) was placed 3 mm rostral to the LEDs. Blunted stainless steel screws were inserted into burr holes in the skull over the frontal and parietal lobes (closed circles) to measure electric potential differences between ground electrodes placed in the occipital lobe and to serve as anchors for the head stage. Two electromyogram (EMG) wires were placed into the neck muscles, and two electrocardiogram (EKG) wires were placed along the thoracic cavity. (B) Image of the skull from an example animal showing the location of implanted devices, and is similarly labeled to panel A. Panel (C) represents the LED illumination paradigm and photodiode sampling sequence. The 3 LEDs and a blank were cycled at 100-μs pulses. The photodiode sampled scattered light following each pulse (gray bars).
Experimental Procedures
After at least 2 weeks of surgical recovery, animals were housed in separate 30 × 30 × 80 cm enclosures and connected to our data acquisition system through a thin cable/commutator system (ProMed-Tec, Bellingham, MA, Pro-S24). Data were amplified (photodiode 1×, EEG 1,000×, ECG 1,000×), filtered (0.1 Hz-3.2kHz), digitized (10kHz,), displayed and stored continuously using a custom data acquisition and storage system.24 The light source switched between the three LEDs and a blank every 100 μs, and the photodiode sampled the backscattered light averaged from the rising edge to 90 μs (Figure 1C). Webcam footage was recorded at one frame per sec to aid in subsequent sleep state analysis. Food and water were available ad libitum during all recording sessions. Animals were maintained on a 12-h light/dark cycle for the duration of the recordings. Due to potential interference that white light could impose on our implanted photodiode, the experimental room was illuminated with a direct current 470-nm LED rope (100 Lux) during the light period. Blue light did not penetrate the cranium and did not interfere with the red and near-infrared measurements. During the dark period, a single 470-nm blue LED (4 Lux) was used to provide a small amount of illumination for our cameras.
To generate robust neural and hemodynamic responses from the auditory cortex, a speaker (8 Ω, 2 W) located at the top of the enclosure produced a train of five wide-band speaker clicks (0.2 ms square wave, 5 Hz, 65dBa). We have previously shown that 65dBa was not salient enough to produce arousal from sleep, but still elicited robust responses across sleep and wake.25 Stimuli were presented infrequently with an 8-23.5 s random interstimulus interval.
Animals were allowed 12-24 h of acclimation prior to a 24-h baseline recording, starting at light onset (00:00). The sleep deprivation period began immediately following the baseline recording, at light onset, and consisted of either 0, 2, 4, 6, 8, or 10 h of sleep deprivation (Figure 2) initiated by gentle handling. A 24-h session of recovery sleep was recorded following the sleep deprivation session. The total continuous recording length was at least 72 h. Sleep deprivation sessions were randomized, and animals were allowed 1 week for recovery between recordings.
Figure 2.

Animals were recorded continuously under six different conditions for at least 72 h. A 24-h baseline period was followed by 0, 2, 4, 6, 8, or 10 h of sleep deprivation employed by gentle handling upon light onset (00:00). Following sleep deprivation, animals were recorded for an additional 24 h to monitor recovery.
Sleep Scoring
Archived data were parsed into 10-s epochs, and a fast Fourier transform algorithm was used to calculate the power spectrum for the EEG and EMG signals. A scatterplot with total EMG power on the X-axis and EEG delta power on the Y-axis containing each epoch in the 72-h recording was used for a first-pass scoring of vigilance state.26 Based on the density clusters, vigilance states were sorted into wake (high EMG, low delta EEG), light sleep (LS; medium to low EMG, high delta EEG), deep sleep (DS; low EMG, high delta EEG), and rapid eye movement sleep (REM; very low EMG, low delta EEG). After initial cluster sorting, we visually parsed the record and confirmed the physiological signals with the webcam images for each epoch.
ERP Analysis
Data were analyzed using Octave (www.octave.org), an open source computer-based analysis package. Following each of the five auditory stimuli (clicks), the primary auditory cortex produced a series of five electrical ERPs as described in our earlier studies.6,7 For the baseline, deprivation, and recovery periods of each deprivation length, trials were sorted by wake/ sleep state and then averaged. Further analysis sorted and averaged trials from each state into 4-h bins across the entire recording. The ERP amplitude from each average was calculated as the difference between the peak and trough components from the first ERP of each stimulus train.
Optical Analysis
Implanted LEDs illuminated the cortex and light scattered diffusely through tissue. Based on principles of spectrophotometry, light was absorbed by molecules such as hemoglobin in a wavelength-dependent manner. Oxyhemoglobin and deoxy-hemoglobin concentration changes modified the light intensity detected by the photodiode. The auditory cortex was located within the most direct path between the LEDs and the photodiode; thus, most of the light intensity changes were recorded in this region. By alternating three light wavelengths and using the absorption properties of HbO2 and deoxygenated hemoglobin (Hb), we calculated relative HbO2 and Hb concentrations using a modified Beer-Lambert Law.7,27 The evoked changes in HbO2 and Hb concentration, generated from the train of five stimuli, were quantified by measuring the peak-to-trough amplitude within the first 8 s of the trial.
To compare responses across animals, the ERP and hemo-dynamic response amplitudes were normalized to responses during LS from the baseline recording. Then, the differences between the responses during the recovery and baseline periods were calculated for each state. The differences for each sleep deprivation length were compared to the 0-h deprivation condition, and statistical significance was calculated using a paired two-sample t-test.
Sleep Deprivation Analysis
Sleep deprived animals exhibit sleep rebound effects after the deprivation period. Thus, following 10 h of sleep deprivation, animals spent most of the time in DS (for example refer to figure Figure 10B). Additionally, signals exhibited the lowest noise during this state; therefore, we focused subsequent analysis on the DS state. Stimuli were binned into 4-h increments throughout the recovery period, and ERP and hemodynamic amplitudes were measured. Evoked response amplitudes were normalized to responses during DS from the entire baseline recording. Statistical significance was determined using a paired two-sample t-test.
Figure 10.
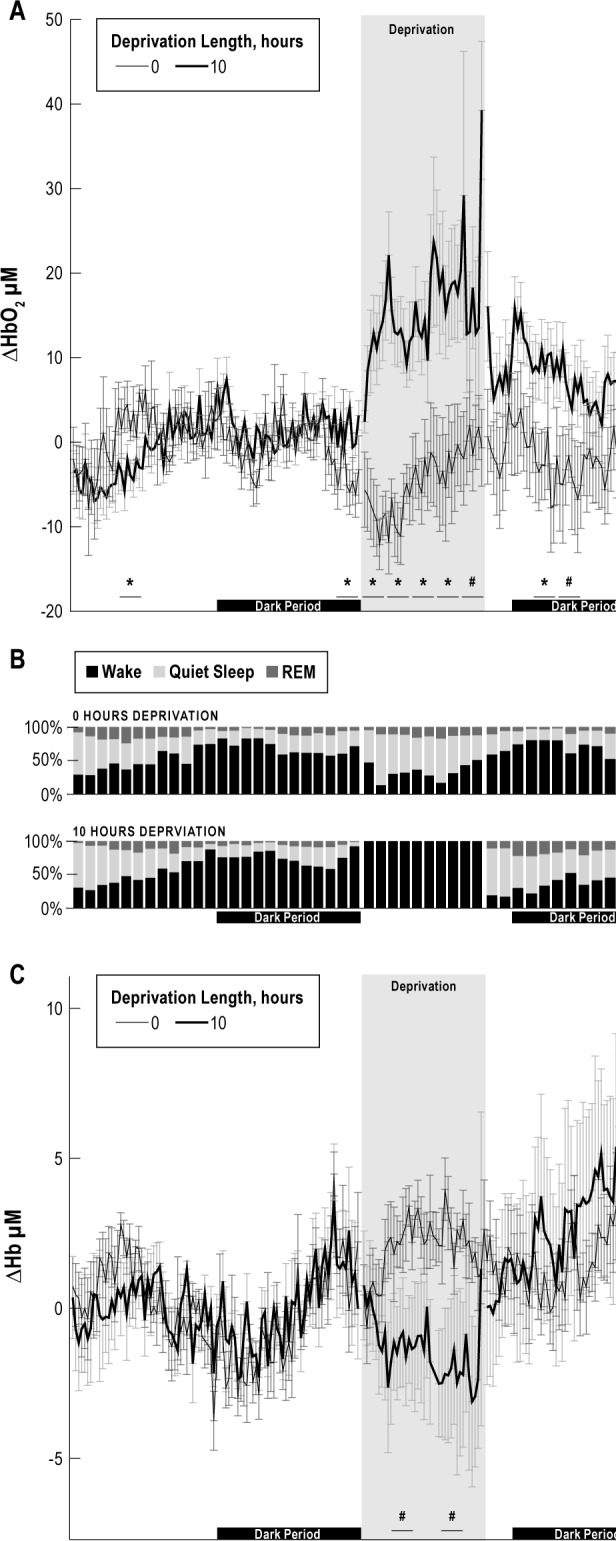
Steady-state oxygenated hemoglobin (HbO2) (A), and deoxygenated hemoglobin (Hb) (C) concentrations were parsed into 15-min epochs during the baseline, deprivation, and recovery periods for the 0-h (thin black line) and 10-h (thick black line) sleep deprivation conditions. Time spent in each state is shown as a percentage for an example animal (B). Statistical significance was calculated in 2-h epochs. Few differences were observed between the steady-state HbO2 concentration during the baseline recording. During sleep deprivation, the steady-state HbO2 concentration was significantly larger during the 10-h deprivation and remained large between 6 and 10 h into the recovery period compared to the 0-h control (*P < 0.05; #P < 0.1). During the recovery period, animals spent most of the time in deep sleep as would be expected from sleep rebound. The steady-state Hb concentration was significantly lower between 2-4 h and 6-8 h following 10 h of deprivation compared to the 0-h control (#P < 0.1) but showed no significant differences during the recovery period.
The steady-state HbO2 concentration from all vigilance states during the recovery period was parsed into 4-h epochs. The difference was taken from the 24-h baseline concentration and then normalized to the 0-h deprivation condition. Statistical significance was calculated using paired two-sample t-tests.
Hemodynamic Steady-State Analysis
The difference between recovery and baseline steady-state HbO2 concentration for each deprivation length was grouped in two different ways. First, the 4-h intervals for steady-state HbO2 concentration were plotted sequentially for each deprivation length. Paired t-tests were calculated to compare the 4-h interval from each deprivation length to its 0-h deprivation equivalent. The slope was calculated from the sequentially plotted 4-h intervals for each deprivation length and a one-sample t-test was used to compare each slope to a mean of zero. Second, the deprivation length was grouped sequentially for each 4-h interval, and the slope was calculated. A one-sample t-test was calculated comparing the slopes to a mean of zero.
Steady-state HbO2 and Hb concentration changes from the baseline, deprivation, and recovery periods were parsed into 15-min epochs for the 0-h and 10-h deprivation conditions. Statistical significance for mean steady-state HbO2 and Hb concentration was calculated in 2-h epochs between 0 and 10 h of sleep deprivation using a paired t-test. To determine the presence of daily rhythmic oscillations in hemoglobin concentration, we calculated the period using 15-min epochs (0-h deprivation) with Cosinor Periodogram software (www.circadian.org).
RESULTS
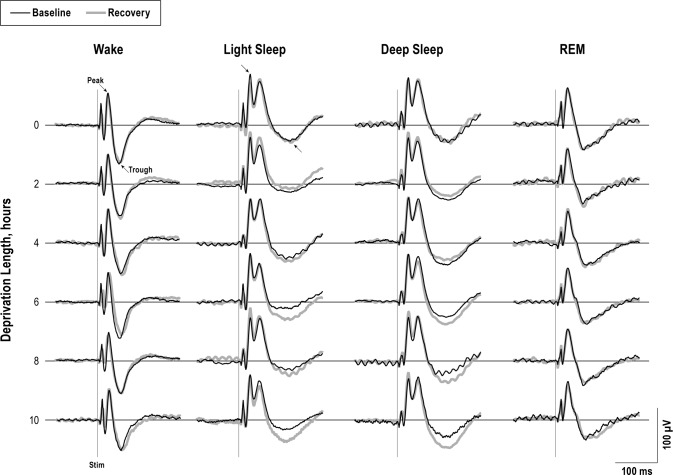
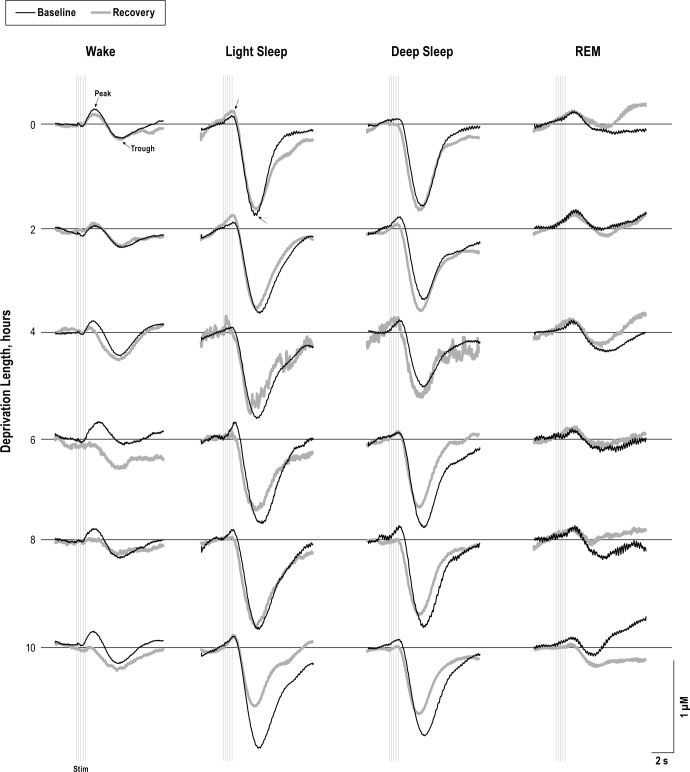
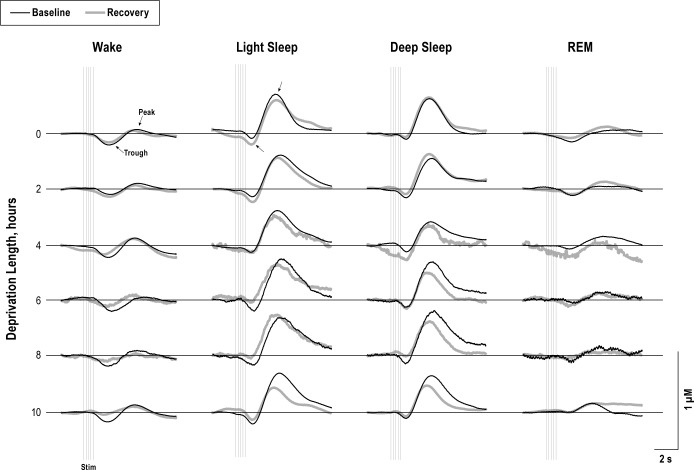
Auditory stimuli produced robust ERPs and evoked hemo-dynamic responses from every sleep state. Plots from an example animal show the first ERP from the train of five for each vigilance state during baseline and recovery periods of each sleep deprivation condition (Figure 3). ERP amplitudes were measured as the difference between the peak and trough components, marked with arrows. HbO2 and Hb responses from a representative animal are shown in Figures 4 and 5, respectively. Amplitudes measured from the peaks and troughs are marked with arrows.
Figure 3.
Averaged evoked response potential (ERP) traces from the first stimulus in the train of five stimuli and are shown from a representative animal for each state and each deprivation length; baseline (black), and recovery (thick gray) are shown. ERP amplitudes were calculated between the peak and trough components (arrows). The ERP trough was significantly larger during light sleep and deep sleep in the recovery period compared to the baseline condition of the corresponding deprivation length (P < 0.05). The first stimulus in the train of five is shown by a vertical light gray line.
Figure 4.
Averaged evoked oxygenated hemoglobin (HbO2) traces are shown from an example animal for baseline (black) and recovery (thick gray) periods for each state and deprivation length. HbO2 amplitudes were calculated between the peak and trough components (arrows). The train of five stimuli are shown by vertical light gray lines. Evoked HbO2 responses were significantly smaller during recovery from sleep deprivation compared to the corresponding baseline control (P < 0.05).
Figure 5.
Averaged evoked deoxygenated hemoglobin (Hb) traces are shown from an example animal for baseline (black), and recovery (thick gray) periods for each state and deprivation length. Hb amplitudes were calculated between the peak and trough components (arrows). The train of five stimuli are shown by vertical light gray lines. Similar to the HbO2 result seen in Figure 4, evoked Hb responses are significantly smaller during recovery compared to the corresponding baseline control (P < 0.05).
Evoked Response Amplitudes
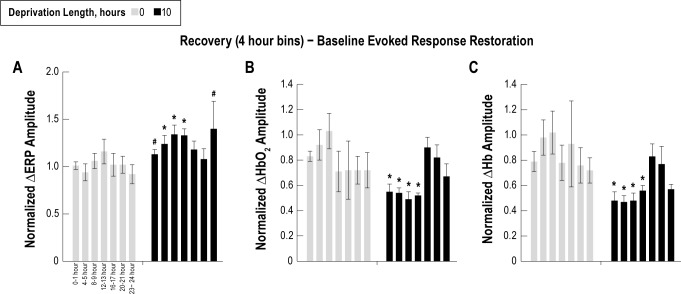
Following sleep deprivation, ERP amplitudes normalized to baseline showed no significant differences during wakefulness (Figure 6A). However, normalized ERP amplitudes were significantly larger during LS following 4, 6, 8, and 10 h of sleep deprivation and during DS following 6, 8, and 10 h compared to the 0-h control (P < 0.05). During REM sleep, normalized ERP amplitudes were significantly smaller following 8 and 10 h of sleep deprivation compared to the 0-h control (P < 0.05). Due to rebound sleep, animals spent most of the time in DS following 10 h of sleep deprivation, and signals exhibited the lowest noise; therefore, the analysis of physiological responses during the recovery period focused on data collected during DS. Further investigation of evoked responses during the recovery period revealed that normalized ERP amplitudes were larger following 10 h of sleep deprivation compared to 0 h of sleep deprivation for at least 9 h in the recovery period (Figure 7A, P < 0.05).
Figure 6.
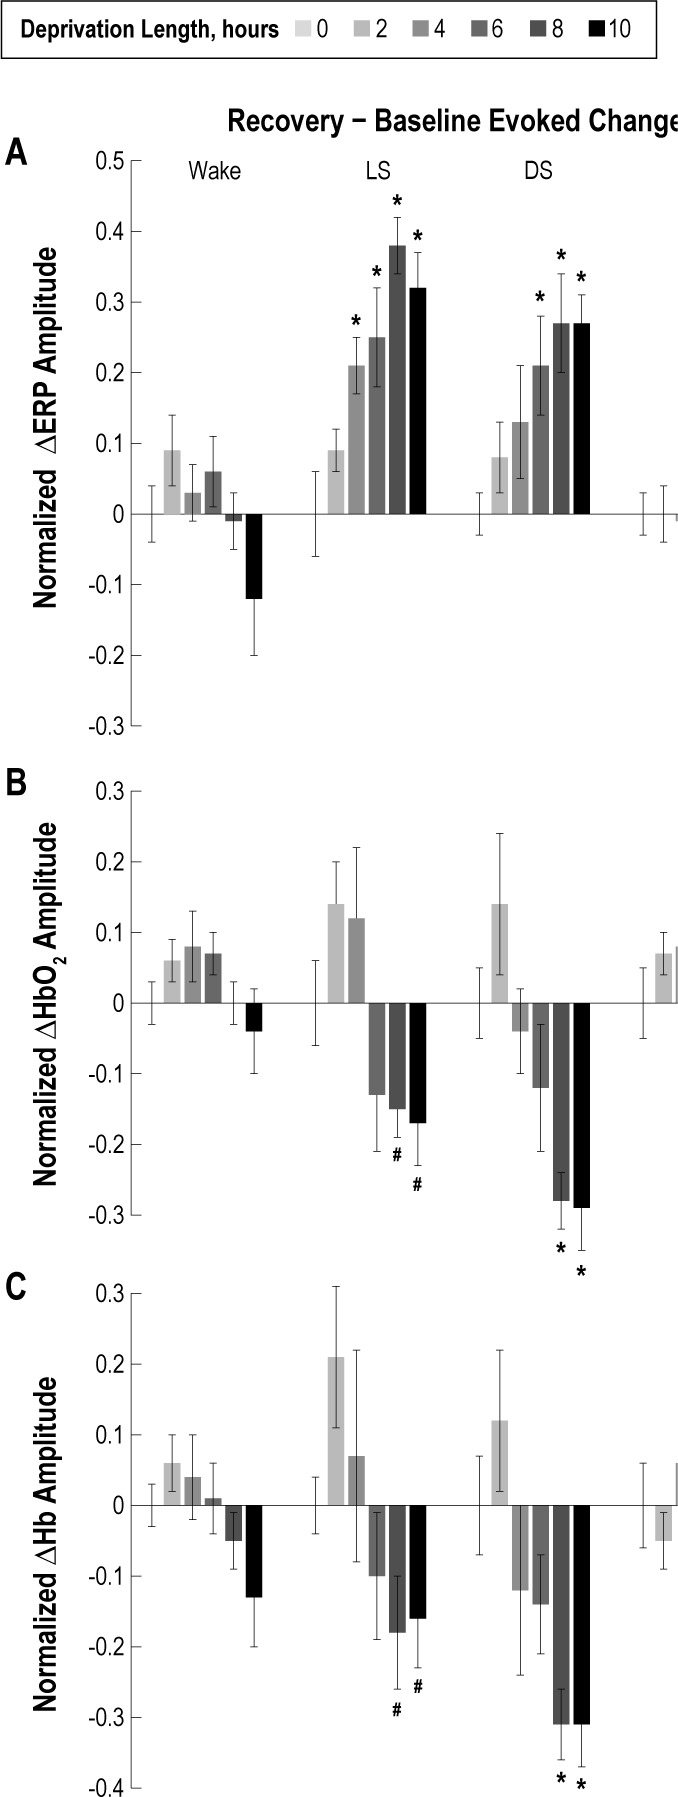
Averaged peak-trough amplitudes across all animals are plotted for the evoked response potential (ERP) (A), oxygenated hemoglobin (HbO2) (B), and deoxygenated hemoglobin (Hb) (C). Average response amplitudes during the 24-h recovery period were subtracted from response amplitudes during the 24-h baseline period to correct for variability across recordings and were normalized to the 0-h deprivation condition for each state. There were no significant ERP amplitude differences after sleep deprivation compared to the 0-h deprivation control condition during the wake state. However, during the recovery period light sleep (LS) ERP amplitudes were significantly larger following 4, 6, 8, and 10 h of sleep deprivation compared to the 0-h control (*P < 0.05). Similarly, deep sleep (DS) ERP amplitudes during the recovery period were significantly larger following 6, 8, and 10 h of sleep deprivation compared to the 0-h control (*P < 0.05). There were no significant differences in the evoked HbO2 amplitudes during wake following sleep deprivation compared to the 0-h deprivation condition. Following 8 and 10 h of sleep deprivation, LS and DS HbO2 amplitudes were significantly smaller compared to the 0-h control (*P < 0.05; #P < 0.1). No significant differences in HbO2 or Hb amplitudes were found during rapid eye movement (REM) sleep. Similar to the HbO2 evoked responses, Hb responses showed no significant differences in wake or REM following sleep deprivation. However, following 8 and 10 h of sleep deprivation, Hb amplitudes during LS and DS were significantly reduced (*P < 0.05; #P < 0.1).
Figure 7.
The evoked response potential (ERP) (A), oxygenated hemoglobin (HbO2) (B), and deoxygenated hemoglobin (Hb) (C) amplitudes from deep sleep during the recovery period were parsed into 4-h intervals and normalized to responses from the 24-h baseline condition. Due to the expected gradual change in amplitude during recovery, data was plotted from the first hour of each 4 hour block to emphasize values at the beginning of each period. ERP amplitudes were larger for at least 12 h following 10 h of sleep deprivation compared to the corresponding interval from the 0-h control (*P < 0.05; #P < 0.1). Coinciding with the increased ERP amplitude, evoked HbO2 and HbR amplitudes were significantly smaller for at least 12 h following 10 h of sleep deprivation compared to the corresponding interval from the 0-h control (*P < 0.05).
Evoked Hemodynamic Amplitudes
There were no significant differences in normalized evoked HbO2 or Hb response amplitudes during wake following different periods of sleep deprivation compared to the 0-h deprivation condition (Figures 6B and 6C, respectively). Following 8 and 10 h of sleep deprivation, evoked HbO2 and Hb response amplitudes during LS and DS were significantly reduced (P < 0.05). We also compared the hemodynamic onset, trough, and recovery time between DS responses during baseline and sleep deprivation recovery periods. The evoked hemodynamic response onset and initial slope was not significantly different across all measurements when compared between baseline and recovery conditions (0.04 ± 0.12 s). However, the evoked HbO2 concentration change after 10 h of deprivation leveled off and reached its trough sooner (0.32 ± 0.11 s, P < 0.05), with an earlier recovery time (0.87 ± 0.36 s, P < 0.05), which was consistent across all animals (Figure 4). No significant differences in evoked HbO2 or Hb response amplitudes were found during REM following any deprivation period.
Evoked responses during the recovery period following 10 h of sleep deprivation were sorted into 4-h bins, and further analysis focused on the DS state, similar to the ERP data. Coinciding with the increased ERP amplitude, evoked HbO2 and Hb response amplitudes were significantly smaller for at least 9 h following 10 h of sleep deprivation compared to the 0-h sleep deprivation condition (Figures 7B and 7C, P < 0.05).
HbO2 Steady State
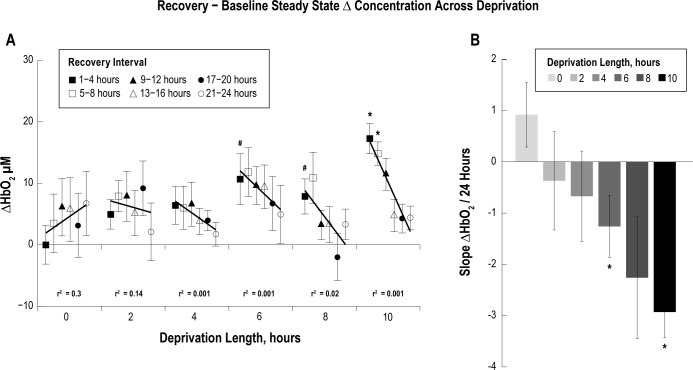
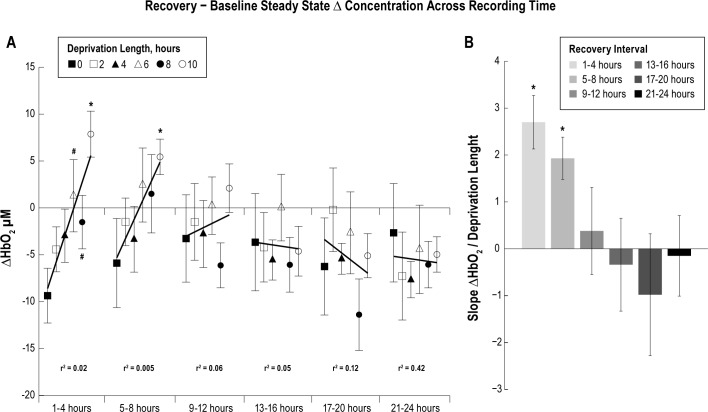
For each deprivation condition the difference in steady-state HbO2 concentration was taken between the recovery and baseline periods, and then parsed into 4-h intervals. The difference in steady-state HbO2 concentration was significantly larger during the first 4 h of recovery sleep following 6 and 8 h of sleep deprivation compared to the 0-h control (P < 0.1), and for the first 8 h of recovery following 10 h of sleep deprivation compared to the 0-h control (Figure 8A, P < 0.05). The slope of the HbO2 steady-state concentration difference between the recovery period and baseline period over 24 h, binned in 4-h intervals, was calculated for each sleep deprivation length (Figure 8B). The slope in HbO2 concentration over a 24-h period for the 6 and 10 h of sleep deprivation conditions was significantly more negative than the slope from the 0-h control, indicating an increase in steady- state HbO2 concentration during the initial recovery period (P < 0.05), following at least 6 h of deprivation. The slope for 8 h of sleep deprivation followed a negative trend, but was not significant (P = 0.105); more animals may be required to reach significance. To better identify changes in steady-state HbO2 concentration following different sleep deprivation lengths, 4-h epochs were grouped together across deprivation length (Figure 9). The slope of the change in steady-state HbO2 concentration over the sleep deprivation length for the first two 4-h epochs were significantly larger than zero (P < 0.05), indicating at least 9 h may be required for recovery following 10 h of sleep deprivation (Figure 9B). Future studies could extend the sleep deprivation and recovery recordings to further elucidate the time to recovery.
Figure 8.
Steady-state oxygenated hemoglobin (HbO2) concentration during the recovery period (A) was parsed into 4-h intervals and the difference was taken from the 24-h baseline period. Data are grouped by deprivation length to illustrate trends (black lines) across 4-h intervals. Following 6 and 8 h of sleep deprivation, the steady-state HbO2 concentration was significantly higher during the first 4 h of recovery sleep compared to the 0-h deprivation condition (#P < 0.1). Steady-state HbO2 concentration was significantly larger during the first 8 h of the recovery period following 10 h of sleep deprivation (*P < 0.05). The slope of the steady-state HbO2 concentration trends over recovery time was calculated for each sleep deprivation length and plotted in the bar graph (B). The slope is significantly more negative with increasing derivation length, indicating longer recovery times are required following longer periods of sleep deprivation (*P < 0.05).
Figure 9.
Steady-state oxygenated hemoglobin (HbO2) concentration (A) was binned into 4-h intervals and the average HbO2 concentration from the 24-h baseline period were subtracted from each 4-h interval. Data are grouped by 4-h recovery intervals to illustrate trends (black lines) across recovery. Following 6 and 8 h of sleep deprivation, the steady-state HbO2 concentration was significantly greater during the first 4 h of recovery sleep compared to the 0-h deprivation condition (#P < 0.1). The steady-state HbO2 concentration was significantly larger during the first 8 h of the recovery period, following 10 h of sleep deprivation compared to the corresponding interval from the 0-h control (*P < 0.05). The slope of the steady-state HbO2 concentration trends over sleep deprivation length were calculated within each 4-h interval, and plotted in the bar graph (B). The larger slope during earlier recovery periods suggests higher steady-state HbO2 concentration with increasing sleep deprivation length which returns to baseline after 9 h, when the slope approaches zero (*P < 0.05).
To further examine the recovery time course, steady-state HbO2, and Hb concentrations were binned into 15-min epochs during the baseline, deprivation, and recovery periods for the 0-h and 10-h sleep deprivation conditions (Figure 10). Statistical differences in the steady-state HbO2 concentration between the 10-h deprivation condition and the 0-h deprivation condition were calculated by averaging the responses over eight-15 min epochs, producing 2-h bins. During the deprivation period, the steady- state HbO2 concentration was significantly larger for the entire 10-h period compared to the 0-h deprivation where animals were allowed to sleep (P < 0.1). During recovery, steady-state HbO2 concentration following 10 h of sleep deprivation condition was significantly larger between 4 and 8 h during the recovery period before returning to baseline compared to the HbO2 steady-state response following the 0-h deprivation condition. We observed a difference in HbO2 concentration during the beginning and the end of the baseline period between the 0-h and 10-h deprivation conditions; however, this effect may be due to systematic error in a few of the recordings, or incomplete randomization of the deprivation protocol. Further studies with additional animals are required to explore this result. No significant differences between 0 and 10 h of sleep deprivation were found during the baseline condition for the steady-state Hb concentration. During deprivation, steady-state Hb concentrations were reduced (P < 0.1), but there were no significant differences during the recovery period.
To investigate the effect of daily rhythmicity, a periodogram analysis showed a rhythmic 26-h oscillation in steady-state HbO2 concentration was present (P < 0.05), which may explain the decreased significance of the steady-state response for the first 4 h of the recovery period. The rhythm may not have been exactly 24 h due to the disruption of a new environment.
DISCUSSION
We observed robust ERP and hemodynamic responses from the auditory cortex following auditory stimulation across all wake and sleep states. There were no significant differences in ERP or hemodynamic response amplitudes during the sleep deprivation period or the wake condition of the recovery period. Following sleep deprivation, animals most of the time were in either LS or DS, making it difficult to measure responses during the waking state for these periods. During LS and DS, ERP amplitudes increased with deprivation length whereas evoked HbO2 and Hb response amplitudes decreased compared to 0 h of deprivation. Following 10 h of sleep deprivation, the ERP and hemodynamic responses took at least 9 h to return to baseline levels.
Evoked Response Potentials
ERPs show state dependent characteristics,28–32 and can be used to probe cortical state and information processing levels.33 Our previous studies demonstrated that average ERP amplitudes correspond directly to the amount of time that an animal spends in a given sleep state because the peak-to-trough ERP amplitude depends on whether the cells within the cortical column are depolarized or hyperpolarized.26 Consequently, low ERP amplitudes corresponded to wake and high ERP amplitudes occurred during slow wave sleep. Thus, we expected relatively constant and low ERP amplitudes during wake, regardless of deprivation condition because cells are predominantly in a depolarized state. This result also helps demonstrate the effectiveness of our sleep deprivation procedure. Namely, consistently low ERP amplitudes across deprivation conditions meant we were effective at keeping the animals awake.
During slow wave sleep, neural activity oscillates between a depolarized and hyperpolarized state with approximately equal ratio at a 0.5 to 3 Hz delta rhythm.34–37 This synchronized neural activity generates the underlying SWA recorded from surface EEG electrodes. As sleep pressure builds during deprivation, SWA increases during subsequent recovery sleep,23,38–40 resulting in increased synchronization and more time that cortical cells spend in a hyperpolarized state. We expected significantly larger ERPs following sleep deprivation because SWA is higher and the average ERP size is dependent on the amount of time and number of cortical cells in the hyperpolarized state.26
Hemodynamic Evoked Responses
Consistent with our previous work, evoked hemodynamic responses were largest during QS compared to wake and REM during the control condition.6,7 Oxyhemoglobin and deoxyhemoglobin changes, as measured in the current study, occur by several mechanisms. An increase in neural activity will increase oxygen consumption, locally depleting HbO2 and increasing Hb concentration.41 However, these changes are small and usually overshadowed by the vascular response. The major contributors to HbO2 and Hb changes involve rapid modulation of cerebral blood volume (CBV) and blood flow (CBF) by both electrical activity and chemical (e.g. adenosine, NO, TNF, IL-1) signals in response to neural activation. Because most chemical vaso-modulators have also been characterized as sleep regulatory substances,9 it is possible they play a critical role in sleep related vascular changes. An increase in blood volume will produce an increase in total Hb concentration, and an increase in flow will increase HbO2 to the region.
The most advanced anatomical studies of vascular changes and neural activity involve classic balloon or windkessel models.42 At a basic level, fluid dynamics suggests a direct relationship between blood pressure, volume, and flow, where blood flow is proportional to the differential driving pressure divided by the vascular resistance as determined by cross sectional area, or volume of a segment, and viscosity.43 According to the windkessel model,42 fast electrical impulse responses with the same metabolic requirements should initiate hemodynamic responses with the same onset timing, regardless of the vascular state. A more detailed analysis of Figures 4 and 5 show no difference in onset timing for any condition. However, because the vascular response is much slower, a less compliant system in its saturated state should exhibit a lower amplitude response with an earlier plateau and shorter recovery. Again, our results demonstrate that evoked hemodynamic responses after sleep deprivation plateau earlier and recover sooner than during baseline conditions.
Many studies have explored neurovascular coupling and the relationship between neural activity with changes in CBF and CBV, and show regional differences in CBF and CBV responses to the same stimuli.44 Depending on which vascular compartment is involved, we would expect either arterial or venous blood to affect the Hb concentration.45 For example, if the arterial compartment dominates, then we should observe an increase in HbO2 concentration, whereas venous compartment changes would result in decreased HbO2 concentration. This is particularly important because most current noninvasive methods to assess neural activity use hemodynamic markers as indicators of metabolism and activity.46 However, to date, most studies are performed on anesthetized animals in whom basal neural activity is low, and few studies take into consideration that there may be a physical limit to vascular dilation during high activity associated with waking behavior. Further studies are required for imaging of the dynamics of individual capillaries across sleep/wake cycles and under different neural activity levels to understand the mechanisms underlying state-dependent responses.
When comparing the evoked hemodynamic responses between wake and sleep, we observed several important results. First, because the evoked hemodynamic changes are significantly larger during sleep, the muted responses during wake may result from higher metabolic demand, greater basal blood flow and volume,11 and a lower vascular compliance. Second, the large evoked decrease in HbO2 following stimulation during sleep suggests that our measurements are more sensitive to the venous components. Third, after sleep deprivation, the increased metabolic demand accrued during the prolonged waking period may be carried over into the subsequent sleep period, resulting in the blunted hemodynamic responses during recovery sleep, lasting at least 9 h. Thus, sleep may be required to restore vascular compliance to a baseline level.
Hemodynamic Steady-State Responses
Following 8 and 10 h of sleep deprivation, steady-state HbO2 concentration was significantly larger during the initial recovery period when compared to the 0-h deprivation recovery period. The steady-state HbO2 concentration remained higher for at least 9 h into the recovery period, even though animals spent most of the time in LS and DS (Figure 10B). Steady-state Hb concentration was lower during the sleep deprivation period and restored immediately during recovery sleep. Most of the hemodynamic response was dominated by the change in HbO2 concentration, with small changes in Hb, which suggests a combination of blood volume and blood flow changes.41 As the duration of sleep deprivation increased, the evoked HbO2 responses during LS and DS were blunted, suggesting decreased blood volume/flow changes and decreased vascular compliance.
During extended waking periods, regional blood flow is increased compared to postsleep wakefulness,11 and glucose uptake is decreased in associated areas of the brain.47,48 Based on the premise that blood delivery must increase with higher tissue activity,8 we expected a sustained and localized increase in metabolic activity during sleep deprivation. However, we hypothesize that there is a physical limit to how much additional blood can be delivered to a given region during sustained activity. Increased HbO2 and concomitant oxygen/metabolite delivery can only be achieved by decreased consumption, increased CBV, or increased CBF. Heat and waste removal are also affected in reverse. If vessels have expanded to the point where CBV can no longer increase, then there is a physical limit in metabolite delivery to the tissue and waste removal. Similarly, if the driving pressure has reached its limit, then CBF changes can no longer move more blood through the region. Thus, an evoked vascular response may approach saturation, manifesting itself as a muted evoked hemodynamic response, whereas the steady-state Hb concentration remains high. Decreased glucose uptake from PET imaging,11 in spite of increased steady-state HbO2 as demonstrated in Figure 10, suggests vessels may be expanded, approaching their physiological limit and unable to meet the neural demand for metabolites. In response, the tissue could enter a localized sleep-like, hyperpolarized state to circumvent a metabolic deficit.26 If sleep is not achieved, cognitive function deficits may occur. Over the long term, tissue damage may result if the metabolic needs are not met.
Potential Long Term Consequences of Sleep Deprivation
Metabolic demand is decreased during sleep compared to wakefulness11; however, immediately following sleep deprivation, steady-state HbO2 concentration remains high, and evoked HbO2 responses remain blunted. Because local decreases in BOLD fMRI signals are associated with increases in delta power and K-complexes,49 tissue hyperpolarization usually associated with sleep36 may be less metabolically demanding, allowing for vascular recovery. Although the current study did not assess metabolic demand during the hyperpolarized state, future analysis correlating HbO2 concentration with the delta rhythm may reveal a relationship between tissue state and metabolism. If there is a limit in the ability of the vasculature to deliver nutrients to the tissue, and recovery sleep is required to restore resources used during the deficit, then chronic exposure to sleep restriction could prevent the restorative properties of sleep and lead to neural trauma.
CONCLUSIONS
Even though neural activity is decreased during recovery sleep following sleep deprivation periods, metabolic demand remains high and vessels have not fully returned to the compliant state typically observed during sleep. Prolonged wakefulness may cause vessels to expand toward a physiological limit, potentially restricting nutrient delivery. These vascular consequences of sleep deprivation persisted throughout the initial period of recovery sleep. Longer sleep deprivation periods lead to significant decreases in the evoked hemodynamic response amplitudes, and longer recovery time periods were required to restore responses to baseline levels. Silent or hyperpolarized periods of neural activity, characterized by SWA, may serve as a restorative state50 by reducing metabolic demand, allowing for nutrient replenishment and vascular compliance restoration. Chronic exposure to sleep deprivation or sleep restriction could lead to vascular compliance limits being constantly approached, which may decrease the tissue's ability to maintain activity required during information processing. In addition, limiting tissue restoration may result in cellular trauma and death, decreasing brain mass in critical areas.22 Alternatively, neural tissue may detect metabolic deficient conditions and be forced into a hyperpolarized state as a neuroprotective mechanism. Either way, such conditions could be at the root of compromised cognitive and performance abilities in sleep deprived individuals.
DISCLOSURE STATEMENT
This was not an industry supported study. The authors have indicated no financial conflicts of interest.
ACKNOWLEDGMENTS
This work was funded by NIH MH71830, W.M. Keck Foundation, The Poncin Foundation and NSF DGE-0900781.
Footnotes
A commentary on this article appears in this issue on page 1415.
REFERENCES
- 1.Devor A, Dunn AK, Andermann ML, Ulbert I, Boas DA, Dale AM. Coupling of total hemoglobin concentration, oxygenation, and neural activity in rat somatosensory cortex. Neuron. 2003;39:353–9. doi: 10.1016/s0896-6273(03)00403-3. [DOI] [PubMed] [Google Scholar]
- 2.Hillman EMC, Devor A, Bouchard MB, et al. Depth-resolved optical imaging and microscopy of vascular compartment dynamics during somatosensory stimulation. Neuroimage. 2007;35:89–104. doi: 10.1016/j.neuroimage.2006.11.032. [DOI] [PMC free article] [PubMed] [Google Scholar]
- 3.Logothetis NK, Pauls J, Augath M, Trinath T, Oeltermann A. Neurophysiological investigation of the basis of the fMRI signal. Nature. 2001;412:150–7. doi: 10.1038/35084005. [DOI] [PubMed] [Google Scholar]
- 4.Martin C, Martindale J, Berwick J, Mayhew J. Investigating neural-hemodynamic coupling and the hemodynamic response function in the awake rat. Neuroimage. 2006;32:33–48. doi: 10.1016/j.neuroimage.2006.02.021. [DOI] [PubMed] [Google Scholar]
- 5.Oakes TR, Pizzagalli DA, Hendrick AM, et al. Functional coupling of simultaneous electrical and metabolic activity in the human brain. Hum Brain Mapp. 2004;21:257–70. doi: 10.1002/hbm.20004. [DOI] [PMC free article] [PubMed] [Google Scholar]
- 6.Schei JL, Foust AJ, Rojas MJ, Navas JA, Rector DM. State-dependent auditory evoked hemodynamic responses recorded optically with indwelling photodiodes. Appl Opt. 2009;48:121–9. doi: 10.1364/ao.48.00d121. [DOI] [PMC free article] [PubMed] [Google Scholar]
- 7.Schei JL, Rector DM. Evoked electrical and cerebral vascular responses during sleep and following sleep deprivation. Prog Brain Res. 2011;193:233–44. doi: 10.1016/B978-0-444-53839-0.00015-6. [DOI] [PMC free article] [PubMed] [Google Scholar]
- 8.Roy CS, Sherrington C. On the regulation of the blood supply of the brain. J Physiol. 1890;11:85–108. doi: 10.1113/jphysiol.1890.sp000321. [DOI] [PMC free article] [PubMed] [Google Scholar]
- 9.Krueger JM, Rector DM, Roy S, Van Dongen HPA, Belenky G, Panksepp J. Sleep as a fundamental property of neuronal assemblies. Nat Rev Neurosci. 2008;9:910–9. doi: 10.1038/nrn2521. [DOI] [PMC free article] [PubMed] [Google Scholar]
- 10.Schei JL, Rector DM. Assessment of network states: local hemodynamics. Curr Top Med Chem. 2011;11:2447–51. doi: 10.2174/156802611797470349. [DOI] [PubMed] [Google Scholar]
- 11.Braun AR, Balkin TJ, Wesenten NJ, et al. Regional cerebral blood flow throughout the sleep-wake cycle. An H2(15)O PET study. Brain. 1997;120:1173–97. doi: 10.1093/brain/120.7.1173. [DOI] [PubMed] [Google Scholar]
- 12.Hublin C, Kaprio J, Partinen M, Koskenvuo M. Insufficient sleep--a population-based study in adults. Sleep. 2001;24:392–400. doi: 10.1093/sleep/24.4.392. [DOI] [PubMed] [Google Scholar]
- 13.Chee MWL, Chuah YML. Functional neuroimaging and behavioral correlates of capacity decline in visual short-term memory after sleep deprivation. Proc Natl Acad Sci U S A. 2007;104:9487–92. doi: 10.1073/pnas.0610712104. [DOI] [PMC free article] [PubMed] [Google Scholar]
- 14.Van Dongen HPA, Dinges DF. Sleep, circadian rhythms, and psychomotor vigilance. Clin Sports Med. 2005;24:237–49. vii–viii. doi: 10.1016/j.csm.2004.12.007. [DOI] [PubMed] [Google Scholar]
- 15.Van Dongen HPA. Shift work and inter-individual differences in sleep and sleepiness. Chronobiol Int. 2006;23:1139–47. doi: 10.1080/07420520601100971. [DOI] [PubMed] [Google Scholar]
- 16.Spiegel K, Leproult R, Van Cauter E. Impact of sleep debt on metabolic and endocrine function. Lancet. 1999;354:1435–9. doi: 10.1016/S0140-6736(99)01376-8. [DOI] [PubMed] [Google Scholar]
- 17.Curcio G, Ferrara M, Degennaro L. Sleep loss, learning capacity and academic performance. Sleep Med Rev. 2006;10:323–37. doi: 10.1016/j.smrv.2005.11.001. [DOI] [PubMed] [Google Scholar]
- 18.Palchykova S, Winskysommerer R, Meerlo P, Durr R, Tobler I. Sleep deprivation impairs object recognition in mice. Neurobiol Learn Mem. 2006;85:263–71. doi: 10.1016/j.nlm.2005.11.005. [DOI] [PubMed] [Google Scholar]
- 19.Dinges DF. An overview of sleepiness and accidents. J Sleep Res. 1995;4:4–14. doi: 10.1111/j.1365-2869.1995.tb00220.x. [DOI] [PubMed] [Google Scholar]
- 20.Durmer JS, Dinges DF. Neurocognitive consequences of sleep deprivation. Semin Neurol. 2005;25:117–29. doi: 10.1055/s-2005-867080. [DOI] [PubMed] [Google Scholar]
- 21.Everson CA, Bergmann BM, Rechtschaffen A. Sleep deprivation in the rat: III. Total sleep deprivation. Sleep. 1989;12:13–21. doi: 10.1093/sleep/12.1.13. [DOI] [PubMed] [Google Scholar]
- 22.Macey PM, Kumar R, Woo MA, Valladares EM, Yan-Go FL, Harper RM. Brain structural changes in obstructive sleep apnea. Sleep. 2008;31:967–77. [PMC free article] [PubMed] [Google Scholar]
- 23.Borbély AA, Tobler I, Hanagasioglu M. Effect of sleep deprivation on sleep and EEG power spectra in the rat. Behav Brain Res. 1984;14:171–82. doi: 10.1016/0166-4328(84)90186-4. [DOI] [PubMed] [Google Scholar]
- 24.Rector DM, George JS. Continuous image and electrophysiological recording with real-time processing and control. Methods. 2001;25:151–63. doi: 10.1006/meth.2001.1232. [DOI] [PubMed] [Google Scholar]
- 25.Phillips DJ, Schei JL, Meighan PC, Rector DM. Cortical evoked responses associated with arousal from sleep. Sleep. 2011;34:65–72. doi: 10.1093/sleep/34.1.65. [DOI] [PMC free article] [PubMed] [Google Scholar]
- 26.Rector DM, Schei JL, Van Dongen HPA, Belenky G, Krueger JM. Physiological markers of local sleep. Eur J Neurosci. 2009;29:1771–8. doi: 10.1111/j.1460-9568.2009.06717.x. [DOI] [PMC free article] [PubMed] [Google Scholar]
- 27.Boas DA, Gaudette T, Strangman G, Cheng X, Marota JJ, Mandeville JB. The accuracy of near infrared spectroscopy and imaging during focal changes in cerebral hemodynamics. Neuroimage. 2001;13:76–90. doi: 10.1006/nimg.2000.0674. [DOI] [PubMed] [Google Scholar]
- 28.Colrain IM, Campbell KB. The use of evoked potentials in sleep research. Sleep Med Rev. 2007;11:277–93. doi: 10.1016/j.smrv.2007.05.001. [DOI] [PMC free article] [PubMed] [Google Scholar]
- 29.Hall RD, Borbely AA. Acoustically evoked potentials in the rat during sleep and waking. Exp Brain Res. 1970;11:93–110. doi: 10.1007/BF00234203. [DOI] [PubMed] [Google Scholar]
- 30.Knight RT, Brailowsky S, Scabini D, Simpson GV. Surface auditory evoked potentials in the unrestrained rat: component definition. Electroencephalogr Clin Neurophysiol. 1985;61:430–9. doi: 10.1016/0013-4694(85)91035-1. [DOI] [PubMed] [Google Scholar]
- 31.Phillips DJ, Schei JL, Meighan PC, Rector DM. State-dependent changes in cortical gain control as measured by auditory evoked responses to varying intensity stimuli. Sleep. 2011;34:1527–37. doi: 10.5665/sleep.1392. [DOI] [PMC free article] [PubMed] [Google Scholar]
- 32.Rector DM, Topchiy IA, Carter KM, Rojas MJ. Local functional state differences between rat cortical columns. Brain Res. 2005;1047:45–55. doi: 10.1016/j.brainres.2005.04.002. [DOI] [PubMed] [Google Scholar]
- 33.Coenen AML, Drinkenburg WHIM. Animal models for information processing during sleep. Int J Psychophysiol. 2002;46:163–75. doi: 10.1016/s0167-8760(02)00110-1. [DOI] [PubMed] [Google Scholar]
- 34.Steriade M, Timofeev I, Grenier F. Natural waking and sleep states: a view from inside neocortical neurons. J. Neurophysiol. 2001;85:1969–85. doi: 10.1152/jn.2001.85.5.1969. [DOI] [PubMed] [Google Scholar]
- 35.Steriade M. The corticothalamic system in sleep. Front Biosci. 2003;8:878–99. doi: 10.2741/1043. [DOI] [PubMed] [Google Scholar]
- 36.Timofeev I, Grenier F, Steriade M. Disfacilitation and active inhibition in the neocortex during the natural sleep-wake cycle: an intracellular study. Proc Natl Acad Sci U S A. 2001;98:1924–9. doi: 10.1073/pnas.041430398. [DOI] [PMC free article] [PubMed] [Google Scholar]
- 37.Massimini M, Rosanova M, Mariotti M. EEG slow (approximately 1 Hz) waves are associated with nonstationarity of thalamo-cortical sensory processing in the sleeping human. J Neurophysiol. 2003;89:1205–13. doi: 10.1152/jn.00373.2002. [DOI] [PubMed] [Google Scholar]
- 38.Franken P, Dijk DJ, Tobler I, Borbély AA. Sleep deprivation in rats: effects on EEG power spectra, vigilance states, and cortical temperature. Am J Physiol. 1991;261:R198–208. doi: 10.1152/ajpregu.1991.261.1.R198. [DOI] [PubMed] [Google Scholar]
- 39.Friedman L, Bergmann BM, Rechtschaffen A. Effects of sleep deprivation on sleepiness, sleep intensity, and subsequent sleep in the rat. Sleep. 1979;1:369–91. doi: 10.1093/sleep/1.4.369. [DOI] [PubMed] [Google Scholar]
- 40.Tobler I, Borbély AA. Sleep EEG in the rat as a function of prior waking. Electroencephalogr Clin Neurophysiol. 1986;64:74–6. doi: 10.1016/0013-4694(86)90044-1. [DOI] [PubMed] [Google Scholar]
- 41.Masamoto K, Vazquez A, Wang P, Kim S-G. Trial-by-trial relationship between neural activity, oxygen consumption, and blood flow responses. Neuroimage. 2008;40:442–50. doi: 10.1016/j.neuroimage.2007.12.011. [DOI] [PMC free article] [PubMed] [Google Scholar]
- 42.Boas DA, Jones SR, Devor A, Huppert TJ, Dale AM. A vascular anatomical network model of the spatio-temporal response to brain activation. Neuroimage. 2008;40:1116–29. doi: 10.1016/j.neuroimage.2007.12.061. [DOI] [PMC free article] [PubMed] [Google Scholar]
- 43.Krieger SN, Streicher MN, Trampel R, Turner R. Cerebral blood volume changes during brain activation. J Cereb Blood Flow Metab. 2012;32:1618–31. doi: 10.1038/jcbfm.2012.63. [DOI] [PMC free article] [PubMed] [Google Scholar]
- 44.Goense J, Merkle H, Logothetis NK. High-resolution fMRI reveals laminar differences in neurovascular coupling between positive and negative BOLD responses. Neuron. 2012;76:629–39. doi: 10.1016/j.neuron.2012.09.019. [DOI] [PMC free article] [PubMed] [Google Scholar]
- 45.Peppiatt CM, Howarth C, Mobbs P, Attwell D. Bidirectional control of CNS capillary diameter by pericytes. Nature. 2006;443:700–4. doi: 10.1038/nature05193. [DOI] [PMC free article] [PubMed] [Google Scholar]
- 46.Devor A, Sakadžić S, Srinivasan VJ, et al. Frontiers in optical imaging of cerebral blood flow and metabolism. J Cereb Blood Flow Metab. 2012;32:1259–76. doi: 10.1038/jcbfm.2011.195. [DOI] [PMC free article] [PubMed] [Google Scholar]
- 47.Thomas M, Sing H, Belenky G, et al. Neural basis of alertness and cognitive performance impairments during sleepiness. I. Effects of 24 h of sleep deprivation on waking human regional brain activity. J Sleep Res. 2000;9:335–52. doi: 10.1046/j.1365-2869.2000.00225.x. [DOI] [PubMed] [Google Scholar]
- 48.Wu JC, Gillin JC, Buchsbaum MS, et al. The effect of sleep deprivation on cerebral glucose metabolic rate in normal humans assessed with positron emission tomography. Sleep. 1991;14:155–62. [PubMed] [Google Scholar]
- 49.Czisch M, Wehrle R, Kaufmann C, et al. Functional MRI during sleep: BOLD signal decreases and their electrophysiological correlates. Eur J Neurosci. 2004;20:566–74. doi: 10.1111/j.1460-9568.2004.03518.x. [DOI] [PubMed] [Google Scholar]
- 50.Benington JH, Heller HC. Restoration of brain energy metabolism as the function of sleep. Prog Neurobiol. 1995;45:347–60. doi: 10.1016/0301-0082(94)00057-o. [DOI] [PubMed] [Google Scholar]


