

Abstract
Objective
Linear repair of left ventricular aneurysm has been performed with mixed clinical results. By using finite element analysis, this study evaluated the effect of this procedure on end-systolic stress.
Methods
Nine sheep underwent myocardial infarction and aneurysm repair with a linear repair (13.4 ± 2.3 weeks postmyocardial infarction). Satisfactory magnetic resonance imaging examinations were obtained in 6 sheep (6.6 ± 0.5 weeks postrepair). Finite element models were constructed from in vivo magnetic resonance imaging-based cardiac geometry and postmortem measurement of myofiber helix angles using diffusion tensor magnetic resonance imaging. Material properties were iteratively determined by comparing the finite element model output with systolic tagged magnetic resonance imaging strain measurements.
Results
At the mid-wall, fiber stress in the border zone decreased by 39% (sham = 32.5 ± 2.5 kPa, repair = 19.7 ± 3.6 kPa, P = .001) to the level of remote regions after repair. In the septum, however, border zone fiber stress remained high (sham = 31.3 ± 5.4 kPa, repair = 23.8 ± 5.8 kPa, P = .29). Cross-fiber stress at the mid-wall decreased by 41% (sham = 13.0 ± 1.5 kPa, repair = 7.7 ± 2.1 kPa, P = .01), but cross-fiber stress in the un-excluded septal infarct was 75% higher in the border zone than remote regions (remote = 5.9 ± 1.9 kPa, border zone = 10.3 ± 3.6 kPa, P < .01). However, end-diastolic fiber and cross-fiber stress were not reduced in the remote myocardium after plication.
Conclusion
With the exception of the retained septal infarct, end-systolic stress is reduced in all areas of the left ventricle after infarct plication. Consequently, we expect the primary positive effect of infarct plication to be in the infarct border zone. However, the amount of stress reduction necessary to halt or reverse nonischemic infarct extension in the infarct border zone and eccentric hypertrophy in the remote myocardium is unknown.
Surgical ventricular remodeling or restoration has been proposed as a way to reduce left ventricular (LV) volume and improve long-term mortality after anteroapical myocardial infarction (MI). Linear repair was initially popular;1 however, results were mixed, and more recently patch aneurysmorrhaphy has been in favor.2–4 On the other hand, results are difficult to interpret because objectively evaluating the effect of the repair itself is complicated by concomitant procedures such as valve repair and coronary revascularization.
A previous study from our laboratory analyzed the end-diastolic and end-systolic pressure–volume relationships in a cohort of sheep treated with LV aneurysm plication.5 The results showed acute decreases in LV volume and diastolic compliance, an increase in end-systolic elastance, and an acute decrease in the Starling relationship. After 6 weeks, however, these parameters returned to preplication values. This redilation was hypothesized to be the result of high wall stress in the repair border zone and remote myocardium. More recently, we analyzed end-systolic 3-dimensional strain in another cohort of sheep treated with LV aneurysm plication and found that repair of LV aneurysm significantly increases systolic circumferential shortening at the border zone in sheep.6
Because there is no available method to directly measure LV wall stress,7 it must be estimated computationally or from simplified analytic expressions. At present, there are various equations available to compute approximate LV stress;8 however, the most versatile estimates use the finite element (FE) method.9–13
By using FE analysis, a recent study from our laboratory calculated mid-wall stresses in 4 sheep LVs with anteroapical aneurysms.14 Material properties in FE models were iteratively determined by comparing calculated with experimentally measured strains. FE models also included the most recent estimates of aneurysm material properties15 and myofiber helix angles.16 Stress measurements in the infarct border zone showed a 24% increase in fiber stress and a 115% increase in cross-fiber stress relative to noninfarct tissue. Moreover, it was found that a transverse contracting stress equal to 40% of that along the muscle fiber improved agreement with experimental measurements by 24%.
By using the same methodology, the present study used FE analysis to compute mid-wall stress in sheep hearts that have undergone aneurysm plication. Material properties were determined that allowed the FE models to reproduce end-systolic 3-dimensional strain measurements made with tagged magnetic resonance imaging (MRI). FE models included myocyte fiber angle measurements made for the first time after this procedure.16 The present study was undertaken to test the hypothesis that end-systolic stress is reduced in all areas of the LV after infarct plication.
Materials and Methods
A previous study from our laboratory reported myocardial strains in an ovine infarct model (n =8) 6 weeks postplication.6 The same animals were used for the present study. Animals used in this study were treated in compliance with the “Guide for the Care and Use of Laboratory Animals” prepared by the Institute of Laboratory Animal Resources, National Research Council, and published by the National Academy Press, revised in 1996.
Myocardial Infarction
The infarct procedure has been described in detail.17 In brief, 8 adult sheep underwent anteroapical MI. Male Dorsett sheep (40–50 kg) were anesthetized (ketamine, 33 mg/kg (intramuscularly), maintained with isoflurane (2%–4% inspired), and mechanically ventilated (tidal volume 20 mL/kg; model 309-0612-800, Ohio Medical Products, Madison, Wis). A left thoracotomy was performed using a sterile technique, and the left anterior descending and second left anterior descending diagonal coronary arteries were ligated at a point 40% of the distance from the apex to the base as previously described.17 If present, branches of the posterior descending artery that also perfused this region were ligated 20% of the distance from the apex to the base. The thoracotomy was closed in layers, and the sheep recovered from anesthesia.
Aneurysm Plication
After development of a ventricular aneurysm, aneurysm plication was performed without cardiopulmonary bypass (13.4 ± 2.3 weeks post-MI). A partial lower sternotomy was performed under general anesthesia, and pericardial adhesions were divided. The transition between infarcted and noninfarcted myocardium was palpated, and the LV aneurysm was plicated between 2 strips of Dacron felt. Polypropylene sutures (2-0 Prolene, MH needle, Ethicon Inc, Sommerville, NJ) were passed through the felt, through and through the aneurysm at its border, and through the opposite strip of felt in a horizontal mattress fashion. The sternotomy was closed, and the sheep recovered from anesthesia.
Experimental Measurements
Six weeks after the plication procedure (20.0 ± 2.9 weeks post-MI, 6.6 ± 0.5 weeks postplication), systolic strains were measured with tagged MRI as described in greater detail previously.6 In summary, the sheep was intubated and anesthetized (1% inspired isoflurane [Forane]). Under fluoroscopic guidance, a nonferromagnetic transducer-tipped pressure catheter (model SPC-320, Millar Instruments, Houston, Tex) was introduced into the LV via sterile neck incisions. The animal was transported to the MRI scanner and positioned on its left side in the magnet (Siemens Symphony MRI scanner, 1.5 Tesla with Quantum gradients; Siemens Medical Systems, Iselin, NJ) with its chest centered in a Helmholtz coil. A series of tagged magnetic resonance images were acquired in orthogonal short- and long-axis planes synchronized to the R wave of the electrocardiogram signal at 40-ms intervals for the approximate completion of the cardiac cycle. LV pressure was recorded intermittently between slice acquisitions.
Image acquisition was synchronized to the R wave of the electrocardiogram signal. During the actual image data acquisition, the ventilator (Hallowell 2000, Hallowell EMC, Pittsfield, Mass) was stopped for approximately 10 seconds at maximum inspiration (to minimize respiratory motion and the associated motion artefacts in our magnetic resonance images). During this time period, a series of images were acquired at 50-ms intervals until the approximate completion of the entire cardiac cycle. A segmented cine gradient echo sequence was used, the cardiac cycle was divided into 50-ms windows, and 7 phase encoding lines were acquired in each window. Image data were collected during 16 heart cycles providing 99 phase encoding steps. The number of cardiac phases collected depended on the specific animal’s R-R interval, with 10 cardiac phases being typical. The gradient echo sequence had an echo time of 4 ms, an excitation angle (α) of 20 degrees, and an acquisition matrix of 256 × 102. The field of view was set to 280 × 230 mm2 and 280 × 230 mm2 for the short- and long-axis images, respectively. Total MRI study time was approximately 45 minutes. Raw data were interpolated to 256 × 256 pixel images, and these were transferred to a Silicon Graphics workstation (Silicon Graphics Inc, Mountain View, Calif) and converted from Siemens format to SGI format using custom software. Systolic myocardial strains were calculated from tag-line deformation18 in cardiac coordinates (ie, circumferential, longitudinal, and radial) at the mid-wall in 12 equally spaced “sectors” around the circumference in each short-axis slice.
Fiber Angles
Helix angle measurements made using diffusion tensor magnetic resonance imaging (DTMRI) in the same hearts16 were incorporated into the FE model by aligning geometry from the 2 data sets and sampling the nearest points from the DTMRI data set, as described previously.14 For the data set alignment, we aligned the valve plane, LV long-axis, and right ventricular insertion points. All alignments were rigid body motions. The long axes were determined from a least-squares fit to the centroid of the epicardial short-axis contours. Fiber angles in the septal aneurysm were set to 0 degrees. The aneurysmal fiber angle is assumed to be zero because the anisotropy of the aneurysm is referred to “cardiac” coordinates. Fiber angles of zero and 90 degrees correspond to the circumferential and longitudinal directions, respectively. During biaxial mechanical testing of sheep LV aneurysms, the specimens are stretched in the circumferential and longitudinal directions. The results from these tests indicate that sheep LV aneurysms are anisotropic (ie, significantly stiffer in the longitudinal direction).
Finite Element Analysis
The FE analysis followed the same methodology as described previously14 and summarized here. FE models replicated in vivo geometry at end-isovolumic relaxation and contained 18 elements longitudinally, 12 elements circumferentially, and 1 element transmurally with linear interpolation in prolate spheroidal coordinates. Remote, border zone, and aneurysmal (in the septum) regions were determined from ventricular wall thickness. The border zone region was defined at the steep transition in wall thickness between the remote and aneurysm regions. As in previous studies,13,14 azimuthal displacements at all nodes at the base and apex and circumferential displacement of the basal epicardial nodes were constrained. In prolate spheroidal coordinates, the azimuthal direction is aligned with the longitudinal or LV apex-to-base direction only at the equator. At the apex, the azimuthal direction is aligned with the circumferential direction. Thus, these azimuthal constraints do not prevent apex-to-base shortening.
Material Law
The material laws have been described.13,14 In short, the passive myocardium was modeled by a strain energy function, W, that is anisotropic relative to the local fiber direction:
| (1) |
where
| (2) |
Eff is strain in the fiber direction, Ecc cross fiber in-plane strain, Err radial strain transverse to the fiber, and the associated shear strains. C, bf, bt, and bfs are material parameters.
Active contraction was simulated by adding stress in the muscle fiber direction defined by a time-varying elastance model.19 For end systole, this reduced to the following:
| (3) |
where Tmax is the maximum isometric tension achieved at the longest sarcomere length and maximum peak intracellular calcium concentration (Cao)max;
| (4) |
m and b are constants. Length-dependent calcium sensitivity is given by
| (5) |
B is a constant, lois the sarcomere length at which no active tension develops, and lR is the stress free sarcomere length. Active material parameters were set to the following values as previously described:13,14 Tmax = 135.7 kPa, Cao = 4.35μmol/L, (Cao)max= 4.35μmol/L, m =1.0489 seconds·μm−1, b =−1.429seconds, B =4.75μm−1, lo=1.58μm; lR is the sarcomere length in the unloaded configuration and was assumed to vary linearly from 1.78 μm at the endocardium to 1.91 μm at the epicardium (as measured by Rodriguez and colleagues20 in specimens of rat LV myocardium fixed in the unloaded state). The second Piola-Kirchhoff stress tensor was defined as the sum of the passive and active stress components and incorporated into the conservation laws of continuum mechanics and solved with the FE method.21
Determination of Material Parameters
In the septal aneurysm, material parameters determined from biaxial stretching experiments were used.15 In the border zone, Tmax from equation 3 was reduced by 50% in accordance with results from Guccione and colleagues13 and Walker and colleagues.14 Because of a lack of experimental data of aneurysm tissue under shear loading, bfs was kept constant across all regions. In accordance with biaxial stretching experiments of Lin and Yin22 and results from our previous study,14 an in-plane, cross-fiber stress was added equal to 40% of that along the muscle fiber direction.
By following an iterative approach described previously14 and illustrated in Figure 1, transversely isotropic material parameters were systematically varied and Tmax scaled to reproduce measured ventricular volumes and myocardial strains. The FE model was first inflated to the measured offset end-diastolic pressure (Table 1) with initial material parameters from previously published studies;23–25 material parameter C from equation 1 was scaled in nonaneurysmal regions to obtain the correct end-diastolic volume. Once the end-diastolic volume was within a few percent, the model was inflated to the offset end-systolic pressure and systolic contraction simulated in the remote region and Tmax was scaled accordingly to obtain the end-systolic volume within a few percent.14
Figure 1.

Iterative process for determining material parameters. Initial parameters were taken from previously published studies. C’s from equation 1 in aneurysmal and nonaneurysmal regions, and Tmax from equation 3 were iteratively scaled to achieve correct volumes. Remaining parameters were then scaled to achieve good agreement with tagged MRI strains as measured by rms error. EDV, End-diastolic volume; ESV, end-systolic volume; rms, Root-mean-square.
TABLE 1.
Experimental pressures
| Animal | Pressures (mm Hg)
|
||||
|---|---|---|---|---|---|
| Minimum | EDP | ESP | Offset EDP | Offset ESP | |
| 305 | 3.73 | 9.02 | 110.69 | 5.29 | 106.96 |
| 356 | 8.95 | 16.61 | 100.53 | 7.66 | 91.58 |
| 357 | 28.89 | 41.26 | 107.68 | 12.37 | 78.79 |
| 363 | 3.66 | 10.85 | 74.7 | 7.19 | 71.04 |
| 109 | 5.68 | 11.32 | 124.84 | 5.64 | 119.16 |
| 346 | 10.21 | 13.17 | 77.45 | 2.96 | 67.24 |
| Mean ± SD | 10.2 ± 9.5 | 17.0 ± 12.1 | 99.3 ± 19.7 | 6.9 ± 3.2 | 89.1 ± 20.7 |
EDP, End-diastolic pressure; ESP, end-systolic pressure; SD, standard deviation.
Once FE volumes were within a few percent, mid-wall systolic strains were compared between tagged MRI measurements and FE calculations. Root-mean-square (rms) error was computed between measured and FE predicted strains for each strain component across the entire LV. Radial strain was not used because it cannot be measured with sufficient accuracy with tagged MRI.26 The strain component with the highest rms error was addressed by scaling its corresponding passive material parameter in equation 2, and the entire process was manually iterated until overall rms error did not improve between iterations. Once material properties were determined, end-systolic stresses were calculated at an averaged afterload (85.0 mm Hg, average of offset end-systolic pressure from this study and our previous study14). Each iteration required approximately 1.6 hours per diastole and approximately 14.4 hours per systole, 16 hours total time per iteration on a Silicon Graphics Octane II workstation (Silicon Graphics Inc).
Statistical Analysis
Stress values were taken from the central integration point of each element, weighted by the element volume, and averaged over regions. Statistical analysis was performed using paired t tests within groups and unpaired t tests between groups. Stress calculations addressed 4 fundamental questions (1 and 2: Is ventricular stress (fiber and cross-fiber) reduced after plication? 3 and 4: Is ventricular stress (fiber and cross-fiber) elevated in the border zone relative to remote regions after plication?); consequently, a Bonferroni adjustment for 4 comparisons was applied to all end-systolic stress statistics. All other statistics presented were for exploratory purposes and were not adjusted. All data are presented as mean ± standard deviation.
Results
Nine sheep underwent MI and subsequent infarct plication without mortality. One sheep died 10 days after MI, but all others completed the protocol. Two studies could not be analyzed because of poor electrocardiogram gating that prevented acquiring systolic strains leaving 6 analyzable plication studies. Compared with our previous study on sham-operated animals (n = 4),14 FE models of linear repair reproduced tagged MRI measurements equally well (overall rms error: plication = 0.060 ± 0.009, sham = 0.054 ± 0.011, P =.37; Figure 2). Material constants that reproduced the tagged MRI measurements are listed in Table E1. Passive material properties for animals 305 and 357 were close to those determined previously by Okamoto and colleagues25 (C = 0.512, bf = 67.1, bt = 24.2, bfs = 21.6). Values for animals 356, 363, 109, and 346 converged closer to those from Omens and colleagues24 (C = 1.1, bf = 9.2, bt = 2, bfs = 3.7).
Figure 2.
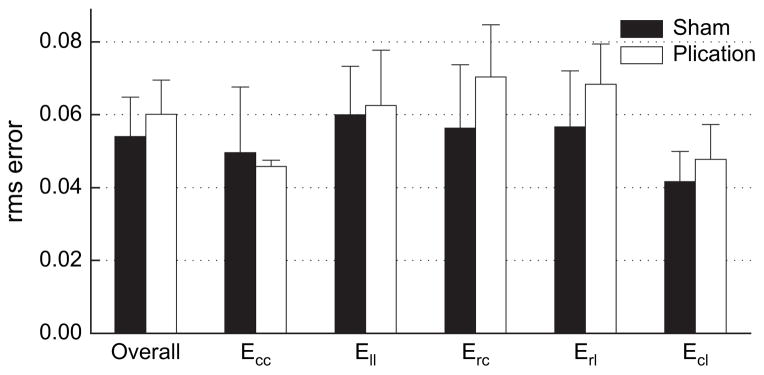
rms error of model predictions relative to strain measurements made with tagged MRI. rms error in the plication models was the same as rms error in the aneurysm models, indicating both FE models reproduced strain measurements with the same certainty. rms, Root-mean-square.
End-systolic Stress
Fiber Stress
In general, mid-wall fiber stress after a linear repair was lower than in sham-operated animals (Figure 3). In the retained infarct, fiber stress decreased by 52% (sham = 36.6 ± 5.7, plication = 17.5 ± 5.3, P = .003). In the border zone, overall fiber stress decreased by 39% (sham = 32.5 ± 2.5, plication =19.7 ±3.6, P =.001); moreover, fiber stress in this region decreased to the level of remote regions after plication. In the septum, however, border zone fiber stress remained high (sham = 31.3 ± 5.4, plication = 23.8 ± 5.8, P = .29).
Figure 3.
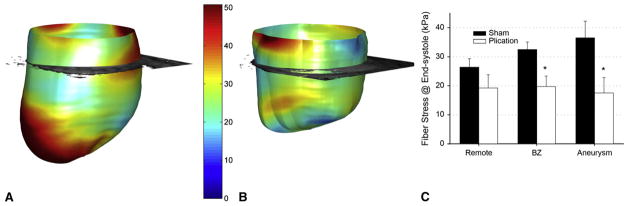
End-systolic midwall fiber stress in a representative aneurysmal heart (A) and postplication heart (B), septal-posterior view. Averaged across all models (C), fiber stress decreased in the border zone and infarct but did not significantly decrease in remote regions. After plication, border zone stress was at the same level as remote regions. *P <.05 plication versus sham. BZ, Border zone.
Cross-fiber Stress
Cross-fiber stress decreased after plication in border zone and infarct regions (Figure 4). Cross-fiber stress decreased by 47% in the retained infarct (sham = 38.7 ± 5.0, plication = 20.6 ± 7.1, P < .01) and decreased 41% overall in the border zone (sham =13.0 ±1.5, plication = 7.7 ± 2.1, P = .01). However, in the septal border zone the cross-fiber stress was still 75% higher than in remote regions after plication (remote = 5.9 ± 1.9, border zone = 10.3 ± 3.6, P < .01).
Figure 4.
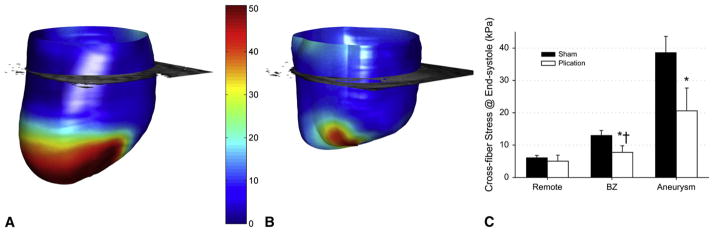
End-systolic midwall cross-fiber stress in a representative aneurysmal heart (A) and postplication heart (B), septal-posterior view. Cross-fiber stress concentration exists in the infarct of the aneurysmal heart (A) and remains in the nonexcluded septal infarct after plication (B). Averaged across all models (C), cross-fiber stress decreased in the border zone and infarct but not in remote regions. After plication, border zone cross-fiber stress was still significantly elevated above remote regions. *P < .05 plication versus sham. †P < .05 plication remote versus border zone. BZ, Border zone.
End-diastolic Stress
End-diastolic fiber and cross-fiber stresses (Figure E1) are approximately an order of magnitude lower than end-systolic stresses, but the statistics are generally the same. End-diastolic stress calculations, however, must be considered exploratory because diastolic strains were not measured to validate the model in diastole. Diastolic strains were not measured because this requires additional tagged magnetic resonance images to be acquired in which the tags are laid down earlier (ie, early in diastole instead of at end diastole, as in the case of systolic strain measurement). Because the systolic tags (laid down at end diastole) disappear before the beginning of diastole, it is not possible to measure diastolic strain from the data we collected for the present study.
Discussion
With the exception of the retained septal infarct, systolic stress is reduced after plication. In the infarct border zone, mean fiber stress decreased by 39% relative to aneurysmal hearts. Moreover, mean fiber stress in the border zone (which was 24% higher than in remote regions in aneurysmal hearts14) decreased to the same level as in remote regions after plication. However, a stress concentration remained in the septum; cross-fiber stress was still 75% higher than in remote regions because of the retained infarct.
Although there have been several FE studies of MI,9,13 to our knowledge none have been performed on LV aneurysm plication. Savage and coworkers27 computed wall stress in the ovine LV aneurysm model before and after plication using a closed form equation developed by Janz.8 Comparison of circumferential stress from Savage and colleagues’ study with mid-wall fiber stress (which is predominantly circumferential at the mid-wall28) from the present study indicates serious discrepancies, as much as 122% difference in the anterior aneurysm preplication and 60% difference in the anterior border zone postplication (data taken from Table 2,27 assuming the units posted are dynes/cm2 and not dynes/sec/cm2). In addition, large standard deviations exist in their stress estimates, suggesting sensitivity in the method. Taniguchi and colleagues2 used the same closed-form equation for their study and also present large variations in their stress estimates. Because of the simplifying assumptions made to develop the closed form equation and the regional validation to tagged MRI presented in the current study, we expect that our stress calculations are more accurate.
The assumption in DTMRI applied to myocardium is that the direction of the muscle fibers is collinear with the direction of the eigenvector associated with the largest eigen diffusivity.29 We believe our results were made more accurate by incorporating 3-dimensional variations in myofiber orientation in our FE models. However, a uniform transmural myofiber variation gave comparable results.
The relatively wide variance in some of the material parameters that are expressed in Table E1 is typical of soft tissues.30 Incorporating this variance allows us to equally fit the measured end-systolic strain with our FE models. Currently, we are developing and validating a user-friendly software tool that performs a formal optimization of myocardial material properties.
Stress in the Myocardium
The reason that infarct plication fails to stabilize LV volume must be that stress reduction is not sufficiently great. Stress is important because it determines myocardial energy expenditure31 and coronary blood flow,32 causes hypertrophy,10,33 and may lead to apoptosis34 and nonischemic infarct extension (NIIE), a process in which normally perfused segments adjacent to the infarct increase in size over time in response to high systolic stress.35,36 Even if the effect of a surgical ventricular remodeling operation on function is neutral, the effect on stress may make the operation worthwhile. Specifically, a reduction in systolic border zone stress may stop or reduce NIIE in the border zone, and a reduction in diastolic stress in the remote myocardium may stop or reduce eccentric hypertrophy after MI. Our FE-based calculations show that end-systolic fiber and cross-fiber stress in the border zone and residual aneurysm were reduced after infarct plication. However, preliminary end-diastolic stress calculations suggest that end-diastolic fiber and cross-fiber stresses were not reduced in the remote myocardium after plication. Consequently, we expect the primary positive effect of infarct plication to be in the infarct border zone.
However, the amount of stress reduction necessary to halt or reverse NIIE in the infarct BZ and eccentric hypertrophy in the remote myocardium is unknown. In a recent study, Moustakidis and coworkers37 reported that peak systolic stress (circumferential) in normal sheep was approximately 12 kPa (Figure 4, A). It should be noted that plication, which reduces end-systolic fiber stress to 19.2 ± 4.6 kPa, does not succeed in “normalizing” stress.
Moustakidis and colleagues37 did not calculate diastolic stress, so there is no way to say whether plication “normalizes” diastolic fiber stress. Moreover a strict comparison cannot be performed because Moustakidis and colleagues did not report the pressures in their models or validate their models against tagged MRI measurements.37 Further evaluation of end-systolic and end-diastolic stress levels in normal sheep using the methods in this study may be warranted.
Other Analytic Approaches
In the past, analytic estimates of stress have used equations based on force balance and LaPlace’s law.8,10 However, these equations cannot account for varying myofiber orientation or regional material properties (eg, a stiffer aneurysm). In recent literature, ventricular stress calculations have been presented from FE models with detailed geometry and loading conditions but a linear elastic, infinitesimal deformation analysis.37,38 The advantage to this FE approach is that the computation time is much shorter because it does not require incremental loading or iterative solutions. However, this does not reflect the nonlinear behavior of myocardium or account for the large deformations of the beating heart. More than 20 years ago, Janz and Grimm39 showed circumferential strains can be off by as much as 90% with linear elasticity. Furthermore, solutions were off by as much as 100% when not accounting for large deformations.40 The FE method in the present study incorporates a large-deformation, nonlinear elastic analysis that is anisotropic relative to the local myofiber orientation (measured in detail with DTMRI). Moreover, because of the rigorous comparison with systolic strain measurements made from tagged MRI, we expect our calculations to be the best estimates of end-systolic stress in the LV after a linear aneurysm repair to date. Diastolic strain will be measured to further validate the diastolic model in the future but is not currently available.
Persistent systolic stress in the retained septal infarct may have been responsible for ongoing NIIE and the redilation seen in our previous study of aneurysm plication.5 Of note, the Dor operation41 excludes the septal infarct completely, and therefore ongoing NIIE is not possible. Nevertheless, there may still be stress concentrations around the inserted patch. FE analysis of this and similar operations is currently being pursued in our laboratory.
We chose to intervene at 13 weeks (and 16 weeks in our Dor study) because the LV has remodeled significantly at that point. From a practical standpoint, the hearts are large enough to perform cardiac operations with (Dor) and without (plication) cardiopulmonary bypass. We thought that the 2-and 6-week postplication time points were reasonable early and intermediate times after the intervention. However, long-term observation after plication and the Dor procedure in this animal model may be beneficial.
Limitations
Because the methods used are the same as in our previous study, the same limitations apply. In summary, long computation times prohibit a formal optimization of material constants25 and greater mesh refinement. Software and hardware upgrades, currently being pursued in our laboratory, will address both of these issues. Second, limited accuracy of measurements of radial strain (Err) have been acknowledged by multiple researchers as a limitation of tagged MRI26 but would be valuable for further validation of the FE analysis. It is important to note here that we calculate Err (and the other 5 strain components) in our FE model, but we do not try to fit model material properties to the experimental Err data (only to the other 5 components). This does not result in significant inaccuracy because Err can be determined from the other 5 strain components (assuming incompressibility). Third, a stress-free state in the beating heart is difficult to obtain, especially when complicated with a dyskinetic infarct. Kresh and Wechsler42 have argued that the dilated LV is devoid of residual stress. Our previous study using a cylindric model of the equatorial region of the normal canine LV23 suggests that the passive material properties would be different but not overly so if the unloaded model configuration is not stress free. Our previous study of partial left ventriculectomy43 suggests that fiber stress is not significantly affected by residual stress. Fourth, for simplicity we did not include secondary effects, such as those associated with scarring around the surgical repair (there is a lack of model restraint in the area of the aneurysm plication), Teflon felt (we did not include different material properties for this), and the right ventricle (we did not load the opposite side of the septum with right ventricular pressures or include the right ventricular attachments to the septum). Fifth, the transmural change in myofiber helix angle is rapid, and small spatial misalignments can cause inaccurate extraction of myofiber data. This is a limitation of applying ex vivo data to in vivo data. However, it is at least as good if not better than histologic sectioning in which the heart is also removed and the measured angles mapped back to in vivo locations. Last, our FE model includes only mechanical effects, whereas aneurysm plication probably has significant effects on LV electrophysiology, metabolic activity, and so forth.
Conclusions
FE analysis demonstrates that aneurysm plication decreases fiber stress without depressing stroke volume. On the basis of these results, aneurysm plication should be an effective therapeutic strategy relative to no treatment. However, a high cross-fiber stress remains in the border zone of the retained septal infarct. Surgical remodeling procedures that exclude the septum may decrease stress in this region and warrant future studies. Future work will also include comparison of our method with analytic and competing FE methods.44,45
Supplementary Material
Acknowledgments
The authors thank Dr Charles McCulloch for guidance on the statistical analysis.
This study was supported by National Institutes of Health grant R01-HL-63348 (Dr Ratcliffe), VA Merit Review (Dr Wallace), an award from the American Heart Association (Dr Walker), Whitaker grant RG-01-0438 (Dr Hsu), and R01-HL-77921 (Dr Guccione).
Abbreviations and Acronyms
- DTMRI
diffusion tensor magnetic resonance imaging
- FE
finite element
- LV
left ventricular
- MI
myocardial infarction
- MRI
magnetic resonance imaging
- NIIE
nonischemic infarct extension
- rms
root-mean-square
Footnotes
Supplemental material is available online
References
- 1.Cooley D, Collins H, Morris G, Chapman D. Ventricular aneurysm after myocardial infarction: surgical excision with use of temporary cardio-pulmonary bypass. JAMA. 1958;167:557. doi: 10.1001/jama.1958.02990220027008. [DOI] [PubMed] [Google Scholar]
- 2.Taniguchi K, Sakurai M, Takahashi T, Imagawa H, Mitsuno M, Nakano S, et al. Postinfarction left-ventricular aneurysm: regional stress, function, and remodeling after aneurysmectomy. J Thorac Cardiovasc Surg. 1998;46:253–9. doi: 10.1055/s-2007-1010234. [DOI] [PubMed] [Google Scholar]
- 3.Kramer CM, Magovern JA, Rogers WJ, Vido D, Savage EB. Reverse remodeling and improved regional function after repair of left ventricular aneurysm. J Thorac Cardiovasc Surg. 2002;123:700–6. doi: 10.1067/mtc.2002.120710. [DOI] [PubMed] [Google Scholar]
- 4.Versteegh MI, Lamb HJ, Bax JJ, Curiel FB, van der Wall EE, de Roos A, et al. MRI evaluation of left ventricular function in anterior LV aneurysms before and after surgical resection. Eur J Cardiothorac Surg. 2003;23:609–13. doi: 10.1016/s1010-7940(03)00002-2. [DOI] [PubMed] [Google Scholar]
- 5.Ratcliffe MB, Wallace AW, Salahieh A, Hong J, Ruch S, Hall TS. Ventricular volume, chamber stiffness, and function after anteroapical aneurysm plication in the sheep. J Thorac Cardiovasc Surg. 2000;119:115–24. doi: 10.1016/s0022-5223(00)70225-x. [DOI] [PubMed] [Google Scholar]
- 6.Guccione JM, Walker JC, Beitler JR, Moonly SM, Zhang P, Guttman MA, et al. The effect of anteroapical aneurysm plication on end-systolic three-dimensional strain in the sheep: a magnetic resonance imaging tagging study. J Thorac Cardiovasc Surg. 2006;131:579–86. e3. doi: 10.1016/j.jtcvs.2005.07.065. [DOI] [PMC free article] [PubMed] [Google Scholar]
- 7.Huisman RM, Elzinga G, Westerhof N, Sipkema P. Measurement of left ventricular wall stress. Cardiovasc Res. 1980;14:142–53. doi: 10.1093/cvr/14.3.142. [DOI] [PubMed] [Google Scholar]
- 8.Janz RF. Estimation of local myocardial stress. Am J Physiol. 1982;242:H875–81. doi: 10.1152/ajpheart.1982.242.5.H875. [DOI] [PubMed] [Google Scholar]
- 9.Bogen DK, Rabinowitz SA, Needleman A, McMahon TA, Abelmann WH. An analysis of the mechanical disadvantage of myocardial infarction in the canine left ventricle. Circ Res. 1980;47:728–41. doi: 10.1161/01.res.47.5.728. [DOI] [PubMed] [Google Scholar]
- 10.Yin FC. Ventricular wall stress. Circ Res. 1981;49:829–42. doi: 10.1161/01.res.49.4.829. [DOI] [PubMed] [Google Scholar]
- 11.Bovendeerd PH, Arts T, Delhaas T, Huyghe JM, van Campen DH, Reneman RS. Regional wall mechanics in the ischemic left ventricle: numerical modeling and dog experiments. Am J Physiol. 1996;270(1 Pt 2):H398–410. doi: 10.1152/ajpheart.1996.270.1.H398. [DOI] [PubMed] [Google Scholar]
- 12.Usyk TP, Mazhari R, McCulloch AD. Effect of laminar orthotropic myofiber architecture on regional stress and strain in the canine left ventricle. J Elast. 2000;61:143–64. [Google Scholar]
- 13.Guccione JM, Moonly SM, Moustakidis P, Costa KD, Moulton MJ, Ratcliffe MB, et al. Mechanism underlying mechanical dysfunction in the border zone of left ventricular aneurysm: a finite element model study. Ann Thorac Surg. 2001;71:654–62. doi: 10.1016/s0003-4975(00)02338-9. [DOI] [PubMed] [Google Scholar]
- 14.Walker JC, Ratcliffe MB, Zhang P, Wallace AW, Fata B, Hsu EW, et al. MRI-based finite-element analysis of left ventricular aneurysm. Am J Physiol Heart Circ Physiol. 2005;289:H692–700. doi: 10.1152/ajpheart.01226.2004. [DOI] [PubMed] [Google Scholar]
- 15.Moonly SM. Experimental and computational analysis of left ventricular aneurysm mechanics (PhD) San Francisco: University of California San Francisco with the University of California Berkeley; 2003. [Google Scholar]
- 16.Walker JC, Guccione JM, Jiang Y, Zhang P, Wallace AW, Hsu EW, et al. Helical myofiber orientation after myocardial infarction and left ventricular surgical restoration in sheep. J Thorac Cardiovasc Surg. 2005;129:382–90. doi: 10.1016/j.jtcvs.2004.06.006. [DOI] [PubMed] [Google Scholar]
- 17.Markovitz LJ, Savage EB, Ratcliffe MB, Bavaria JE, Kreiner G, Iozzo RV, et al. Large animal model of left ventricular aneurysm. Ann Thorac Surg. 1989;48:838–45. doi: 10.1016/0003-4975(89)90682-6. [DOI] [PubMed] [Google Scholar]
- 18.Ozturk C, McVeigh ER. Four-dimensional B-spline based motion analysis of tagged MR images: introduction and in vivo validation. Phys Med Biol. 2000;45:1683–702. doi: 10.1088/0031-9155/45/6/319. [DOI] [PMC free article] [PubMed] [Google Scholar]
- 19.Guccione JM, Waldman LK, McCulloch AD. Mechanics of active contraction in cardiac muscle: Part II—Cylindrical models of the systolic left ventricle. J Biomech Eng. 1993;115:82–90. doi: 10.1115/1.2895474. [DOI] [PubMed] [Google Scholar]
- 20.Rodriguez EK, Omens JH, Waldman LK, McCulloch AD. Effect of residual stress on transmural sarcomere length distributions in rat left ventricle. Am J Physiol. 1993;264:H1048–56. doi: 10.1152/ajpheart.1993.264.4.H1048. [DOI] [PubMed] [Google Scholar]
- 21.Costa KD, Hunter PJ, Wayne JS, Waldman LK, Guccione JM, McCulloch AD. A three-dimensional finite element method for large elastic deformations of ventricular myocardium: II—prolate spheroidal coordinates. J Biomech Eng. 1996;118:464–72. doi: 10.1115/1.2796032. [DOI] [PubMed] [Google Scholar]
- 22.Lin DH, Yin FC. A multiaxial constitutive law for mammalian left ventricular myocardium in steady-state barium contracture or tetanus. J Biomech Eng. 1998;120:504–17. doi: 10.1115/1.2798021. [DOI] [PubMed] [Google Scholar]
- 23.Guccione JM, McCulloch AD, Waldman LK. Passive material properties of intact ventricular myocardium determined from a cylindrical model. J Biomech Eng. 1991;113:42–55. doi: 10.1115/1.2894084. [DOI] [PubMed] [Google Scholar]
- 24.Omens JH, MacKenna DA, McCulloch AD. Measurement of strain and analysis of stress in resting rat left ventricular myocardium. J Biomech. 1993;26:665–76. doi: 10.1016/0021-9290(93)90030-i. [DOI] [PubMed] [Google Scholar]
- 25.Okamoto RJ, Moulton MJ, Peterson SJ, Li D, Pasque MK, Guccione JM. Epicardial suction: a new approach to mechanical testing of the passive ventricular wall. J Biomech Eng. 2000;122:479–87. doi: 10.1115/1.1289625. [DOI] [PubMed] [Google Scholar]
- 26.Denney TS, Jr, Gerber BL, Yan L. Unsupervised reconstruction of a three-dimensional left ventricular strain from parallel tagged cardiac images. Magn Reson Med. 2003;49:743–54. doi: 10.1002/mrm.10434. [DOI] [PubMed] [Google Scholar]
- 27.Savage EB, Downing SW, Ratcliffe MB, Fallert M, Gupta KB, Tyson GS, et al. Repair of left ventricular aneurysm. Changes in ventricular mechanics, hemodynamics, and oxygen consumption. J Thorac Cardiovasc Surg. 1992;104:752–62. [PubMed] [Google Scholar]
- 28.Greenbaum RA, Ho SY, Gibson DG, Becker AE, Anderson RH. Left ventricular fibre architecture in man. Br Heart J. 1981;45:248–63. doi: 10.1136/hrt.45.3.248. [DOI] [PMC free article] [PubMed] [Google Scholar]
- 29.Le Bihan D, Mangin JF, Poupon C, Clark CA, Pappata S, Molko N, et al. Diffusion tensor imaging: concepts and applications. J Magn Reson Imaging. 2001;13:534–46. doi: 10.1002/jmri.1076. [DOI] [PubMed] [Google Scholar]
- 30.Fung YC. Biomechanics: Mechanical Properties of Living Tissues. New York, NY: Springer Verlag; 1993. [Google Scholar]
- 31.Schwitter J, Eberli FR, Ritter M, Turina M, Krayenbuehl HP. Myocardial oxygen consumption in aortic valve disease with and without left ventricular dysfunction. Br Heart J. 1992;67:161–9. doi: 10.1136/hrt.67.2.161. [DOI] [PMC free article] [PubMed] [Google Scholar]
- 32.Jan KM. Distribution of myocardial stress and its influence on coronary blood flow. J Biomech. 1985;18:815–20. doi: 10.1016/0021-9290(85)90478-6. [DOI] [PubMed] [Google Scholar]
- 33.Grossman W. Cardiac hypertrophy: useful adaptation or pathologic process? Am J Med. 1980;69:576–84. doi: 10.1016/0002-9343(80)90471-4. [DOI] [PubMed] [Google Scholar]
- 34.Di Napoli P, Taccardi AA, Grilli A, Felaco M, Balbone A, Angelucci D, et al. Left ventricular wall stress as a direct correlate of cardiomyocyte apoptosis in patients with severe dilated cardiomyopathy. Am Heart J. 2003;146:1105–11. doi: 10.1016/S0002-8703(03)00445-9. [DOI] [PubMed] [Google Scholar]
- 35.Ratcliffe MB. Non-ischemic infarct extension: a new type of infarct enlargement and a potential therapeutic target. J Am Coll Cardiol. 2002;40:1168–71. [Google Scholar]
- 36.Jackson BM, Gorman JH, Moainie SL, Guy TS, Narula N, Narula J, et al. Extension of borderzone myocardium in postinfarction dilated cardiomyopathy. J Am Coll Cardiol. 2002;40:1160–71. doi: 10.1016/s0735-1097(02)02121-6. [DOI] [PubMed] [Google Scholar]
- 37.Moustakidis P, Maniar HS, Cupps BP, Absi T, Zheng J, Guccione JM, et al. Altered left ventricular geometry changes the border zone temporal distribution of stress in an experimental model of left ventricular aneurysm: a finite element model study. Circulation. 2002;106(12 Suppl 1):I168–75. [PubMed] [Google Scholar]
- 38.Aikawa Y, Rohde L, Plehn J, Greaves SC, Menapace F, Arnold MO, et al. Regional wall stress predicts ventricular remodeling after antero-septal myocardial infarction in the Healing and Early Afterload Reducing Trial (HEART): an echocardiography-based structural analysis. Am Heart J. 2001;141:234–42. doi: 10.1067/mhj.2001.112237. [DOI] [PubMed] [Google Scholar]
- 39.Janz RF, Grimm AF. Deformation of the diastolic left ventricle. Nonlinear elastic effects. Biophys J. 1973;13:689–704. doi: 10.1016/s0006-3495(73)86015-1. [DOI] [PMC free article] [PubMed] [Google Scholar]
- 40.Janz RF, Kubert BR, Moriarty TF, Grimm AF. Deformation of the diastolic left ventricle—II. Nonlinear geometric effects. J Biomech. 1974;7:509–16. doi: 10.1016/0021-9290(74)90085-2. [DOI] [PubMed] [Google Scholar]
- 41.Menicanti L, Di Donato M. The Dor procedure: what has changed after fifteen years of clinical practice? J Thorac Cardiovasc Surg. 2002;124:886–90. doi: 10.1067/mtc.2002.129140. [DOI] [PubMed] [Google Scholar]
- 42.Kresh JY, Wechsler AS. Heart reduction surgery can reconstitute the residual stress-strain state of the left ventricle. J Thorac Cardiovasc Surg. 1998;116:1084–6. doi: 10.1016/s0022-5223(98)70070-4. [DOI] [PubMed] [Google Scholar]
- 43.Guccione JM, Moonly SM, Wallace AW, Ratcliffe MB. Residual stress produced by ventricular volume reduction surgery has little effect on ventricular function and mechanics: a finite element model study. J Thorac Cardiovasc Surg. 2001;122:592–9. doi: 10.1067/mtc.2001.114939. [DOI] [PubMed] [Google Scholar]
- 44.Tendulkar AP, Walker JC, Guccione JM, Gundiah R, Tseng E, Ratcliffe MB. Mechanical stresses in left ventricular apical aneurysm. J Am Coll Surg. 2005;201:S22. [Google Scholar]
- 45.Tendulkar AP, Walker JC, Guccione JM, Ratcliffe MB. Finite element analysis of transmural stress in left ventricular aneurysm. J Am Coll Surg. 2006:S21–2. [Google Scholar]
Associated Data
This section collects any data citations, data availability statements, or supplementary materials included in this article.