

Abstract
The signal-response characteristics of a living cell are determined by complex networks of interacting genes, proteins, and metabolites. Understanding how cells respond to specific challenges, how these responses are contravened in diseased cells, and how to intervene pharmacologically in the decision-making processes of cells requires an accurate theory of the information-processing capabilities of macromolecular regulatory networks. Adopting an engineer’s approach to control systems, we ask whether realistic cellular control networks can be decomposed into simple regulatory motifs that carry out specific functions in a cell. We show that such functional motifs exist and review the experimental evidence that they control cellular responses as expected.
Keywords: signal transduction, feedback, feed-forward, switches, clocks
1. INTRODUCTION
The living cell, as described in any biology textbook, is a miniature, membrane-bound, self-instructed, and self-maintaining biochemical machine, which responds to its environment in remarkably complex ways that support its own survival and reproduction (or the survival and reproduction of the multicellular organism of which it is a part). The cell membrane is studded with receptors that are sensitive to the cell’s external chemical environment (e.g., attractants, repellants, and hormones) as well as to pressure, osmotic stress, attachment sites, and other signaling agents. Within the cell are receptors for temperature, damaged proteins or DNA, energy availability, and other indicators of internal state. The cell is continually processing these streams of information and making decisions about its appropriate response in terms of gene expression, metabolic activity, movement, growth and division, and (in some circumstances) programmed cell death. The suite of signal-response characteristics available to a cell is what we call its physiology.
The information-processing abilities of a cell are carried out by complex networks of interacting genes and proteins (1), an example of which is given in Figure 1. The receptors and transducers of signals are proteins; the output responses are mostly implemented by proteins; and the intermediate decision-making is done by proteins, genes, and RNA molecules that govern one another’s production, destruction, localization, and activity by a variety of biochemical transformations that are connected in feedback and feed-forward loops of bewildering complexity. The grand accomplishment of molecular cell biology from 1980 to 2000 (see the millennium issue of Cell, Vol. 100, No. 1) was the identification and characterization of the components of this biochemical machine and their basic relationships to one another (i.e., the wiring diagram of the biocomputer in Figure 1). The grand challenge of molecular systems biology for the next 30 years is to understand, predict, and intervene in the decision-making of the cell.
Figure 1.

Some representative information-processing systems in a cell. The dark blue rectangles embedded in the cell membrane are receptors for external signal molecules (gray boxes). The components in yellow ovals are transcription factors. Proteins that promote (green) or repress (red) progression through the cell cycle are indicated, as well as proteins that promote (purple) or repress (blue) programmed cell death. Red boxes inside the cell indicate internal signals (DNA damage, unreplicated DNA) and responses (e.g., repair, DNA synthesis, and cell death). Dashed lines indicate questionable interactions. MOMP, mitochondrial outer-membrane permeability.
To this end, we must first identify and characterize the basic information-processing modules in protein regulatory networks. Just as an engineering student must first master the properties of simple electrical circuits and mechanical devices, so the nascent systems biologist must first identify regulatory motifs in molecular control systems and determine their possible functional significance in signal processing and output generation.
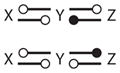
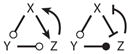
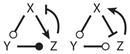
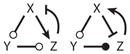
We can already identify some basic motifs in Figure 1. Some receptors (e.g., the receptor for antigrowth factors in the upper-left corner of Figure 1) directly activate transcription factors (Smads, in this case), which then stimulate the production of response proteins (p15), which in turn interact with downstream components (in this case, p15 inhibits cyclin D, a key protein promoting cell growth and division). The basic motif here is a signal-transduction pathway (X → Y ⊣ Z) comprising elementary activation and inhibition signals. Activation may be accomplished by upregulating protein synthesis (as Smads do for p15), by inhibiting protein degradation (e.g., Emi1 inhibits Cdh1, which promotes the degradation of cyclins A and B), by forming multimeric protein complexes (e.g., Cdh1 must associate with the anaphase promoting complex to label A- and B-type cyclins for degradation), or by post-translational modifications (e.g., MEK activates ERK by phosphorylation, and Caspase 8 activates Bid by trimming off a few amino acids). Inhibition may be accomplished by downregulating protein synthesis (e.g., cyclin B–dependent kinase phosphorylates and inactivates E2F, the transcription factor for cyclins A and E), by inducing protein degradation (as Mdm2 does to p53), by complex formation (as p21 does with cyclin D– and E–dependent kinases), or by post-translational modifications (e.g., Wee1 phosphorylates and inactivates the kinase subunit of cyclin B–dependent kinase).
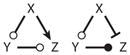
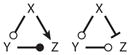
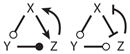
Another common motif in Figure 1 is a feed-forward loop (FFL), in which protein X affects the activity of protein Z by two different routes. For example, E2F promotes the synthesis of CycA directly, and by an indirect route E2F produces Emi1, which binds to Cdh1 and turns off the degradation of CycA. The prototype of an FFL is Motif A in Scheme 1. As the interactions in the FFL can be either activation (→) or inhibition (⊣), there are eight different types of FFLs: four coherent and four incoherent, depending on whether the net effect on the long arm is the same as or opposite to the effect on the short arm.
Scheme 1.
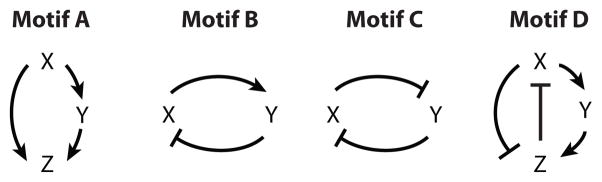
Protein regulatory networks typically contain feedback loops (FBLs) of activatory and inhibitory signals, as in Motifs B and C. For example, Figure 1 has a negative FBL (Motif B) between p53 and Mdm2, and a double-negative FBL (Motif C) between BAX and BCL. More complex, intertwined FFLs and FBLs are also common; for example, Motif D is embodied in X = CycB, Z = Cdh1, and Y = Cdc20 + Cdc14.
From these examples, it should be clear that by a network motif we mean a simple pattern of activation and inhibition among a small number of genes and/or proteins. Of course, such patterns are inevitable in any network of interacting genes and proteins. The real question is whether such motifs serve identifiable information-processing functions in real regulatory networks. That is, are the topological motifs actually functional modules of real significance for the cell’s physiology? We address this issue by answering three specific questions: (a) Can we classify interaction motifs into a complete set of nonoverlapping patterns? (b) Can we identify potential functions of each motif ? (c) And, for motifs represented in known regulatory networks, are they sufficiently isolated to serve their expected function(s) within the network?
This review draws on a significant body of work from the laboratory of Uri Alon, much of which is summarized in his excellent review article (2) and textbook (3). Other points of view about motifs and modules in biochemical networks can be found in the excellent work of Thomas & D’Ari (4), Wolf & Arkin (5), Prill et al. (6) and Soyer et al. (7).
2. CLASSIFICATION OF NETWORK MOTIFS
By our definition, a motif is a pattern of activatory (+) or inhibitory (−) interactions between a small number (N) of components (genes, mRNAs, proteins, metabolites) of a biochemical reaction network. We can represent a motif as an array of signs [aij], where each aij (i,j = 1, …, N) is chosen from the set {−, 0, +}, with ± indicating the sign of the effect of species j on species i, and 0 indicating no effect. For N = 2, the total number of arrays (34 = 81) would be manageable, but for N = 3 the number of arrays (39 = 19,683) is daunting, even after accounting for the symmetries induced by permutation of the indices. To make our classification problem easier, we assume that all self-interactions are inhibitory (aii = −, for all i). This is a reasonable assumption for protein regulatory networks, in which direct autoactivation (e.g., by autophosphorylation) is rare. (It is not a valid assumption for pure gene regulatory networks, for which one ignores the proteins that mediate the interactions among genes.)
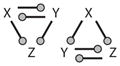
For the case of inhibitory self-interactions and N = 2, there are 32 = 9 sign patterns and 6 distinct motifs (when permutations of X and Y are taken into account) (see Table 1). For N = 3, there are 36 = 729 sign patterns and 138 distinct motifs. For a complete list of three-component motifs, please consult the Supplemental Appendix and Supplemental Table 1 (follow the Supplemental Material link from the Annual Reviews home page at http://www.annualreviews.org). Table 2 presents an abbreviated list of three-component motifs that are of interest for this review.
Table 1.
Two-component motifs
| Motif number | Motif | Sign pattern | Degeneracy | Description | |
|---|---|---|---|---|---|
| 0 |
|
|
1 | Null | |
| 1 |
|
|
2 | Transducer | |
| 2 |
|
|
2 | Inverter | |
| 3 |
|
|
2 | Negative feedback | |
| 4 |
|
|
1 | Positive feedback | |
| 5 |
|
|
1 | Double-negative feedback |
Table 2.
Three-component motifs, with inhibitory self-interactions only
| # of links | Motif number | Motif | Description | Functions |
|---|---|---|---|---|
| 2 | 6 |
|
Signal transduction | Threshold, inversion, … |
| 7 |

|
Branch | ||
| 8 |

|
Logic gate | AND, OR, … | |
| 3 | 9 |

|
Positive FBL | MSS |
| 10 |

|
Negative FBL | OSC | |
| 11 |
|
Coherent FFL | Noise | |
| 12 |
|
Incoherent FFL | Adaptation, cock & fire | |
| 4 | 13 |
|
|
|
| 14 |
|
|
||
| 15 |
|
Amplified NFL |
OSC | |
| 16 |
|
|
||
| 17 |
|
|
||
| 18 |
|
|
||
| 19 |
|
Amplified NFL |
OSC | |
| 20 |
|
Overlapping feed-forward loops | ||
| 5 | 21 |

|
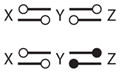
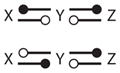
 A gray circle in a motif indicates an interaction that may be either + or −. All white circles in a motif must have the same sign, either + or −, and they must be of opposite sign to any black circles in the same motif.
3. FUNCTIONAL ROLES OF NETWORK MOTIFS
Our next job is to assign possible functional roles to the network motifs identified in Tables 1 and 2. To do so, we must associate a dynamical system to each motif and investigate the temporal responses of each dynamical system. There are many options in this regard.
3.1. Dynamical Equations for Protein Regulatory Networks
We could associate to each motif a Boolean network, where each state variable (X1, X2, …, XN) is a Boolean variable (either 0 or 1) that updates in discrete time (t = 0, 1, 2, …) according to
| (1) |
where
 (X1, X2, …, XN) are Boolean functions that implement the network motif.
Boolean networks have been used to model gene regulatory networks since the classical work of Kauffman (8) (for recent examples, see 9–11). Although Boolean models are intuitively appealing, they do not faithfully represent the dynamics of chemical reaction networks that evolve continuously in time and in state space. For such networks, nonlinear ordinary differential equations (ODEs) are more appropriate:
| (2) |
In this case, the nonlinear functions Fi(X1, X2, …, XN) describe the net rate of change of the concentration of the i-th state variable as the difference between the rates of reactions that are producing Xi with stoichiometric coefficients υir+ and the rates of reactions that are consuming Xi with stoichiometric coefficients υir−. The rates of these reactions are typically described by standard rate laws of biophysical chemistry, such as the law of mass action, the Michaelis-Menten rate law, or the Hill equation. Each of these rate laws expresses the rate of a reaction in terms of the concentrations of the reaction’s substrates and phenomenological rate constants (the kr’s in Equation 2). Protein regulatory networks formulated in this way can be simulated either deterministically by solving Equation 2 with standard nonlinear ODE integrators, or stochastically by using Gillespie’s stochastic simulation algorithm (12). Although the nonlinear ODE approach can represent the dynamics of protein regulatory networks accurately (13–18), this approach requires a great deal of background information in terms of the precise biochemical mechanism of the reaction network and numerical values of the reaction rate constants.
For this review, we seek an intermediate modeling strategy that employs nonlinear ODEs to describe protein regulatory networks but is not tied to specific reaction mechanisms and rate constants. We take a clue from the work of Reinitz and colleagues (19) who have modeled gene regulatory networks using ODEs of the form
| (3) |
where Xi is the expression level of gene i, 0 ≤ Xi ≤ 1, and F(σW) = 1/(1 + e−σW) is a sigmoidal function that varies from 0 (when W ≪ −1/σ) to 1 (when W ≫ 1/σ). The parameter σ controls the steepness of the sigmoidal function at its inflection point. Wi is the net effect on gene i of all genes in the network. The coefficient ωij is less than 0 if gene j inhibits the expression of gene i, more than 0 if gene j activates gene i, or equal to 0 if there is no effect of gene j on gene i. Equation 3 has the great advantage that it is subject to all the powerful analytical and simulation tools of nonlinear ODEs, yet, in the limit of large σi’s, it behaves like a discrete Boolean network. [When σi ≫ 1, then Xi tends to flip (on a timescale ≈ γi−1) between 0 and 1, and the dynamical system 3 approximates a Boolean network, Equation 1, where the nature of the Boolean function
is determined by the coefficients ωij, j = 0, …, N.]
We now consider a network of interacting protein kinases and phosphatases. We let Xi(t) equal the active fraction of the i-th protein, and 1 − Xi(t) equal the inactive fraction. Then we may describe the temporal evolution of the active forms by the nonlinear dynamical system
| (4) |
where Ai and Bi are raw rates of activation and inhibition of protein Xi. These rates are exponentially increasing functions of the total activation (or inhibition) impressed on the i-th protein by all other proteins in the network, as determined by the coefficients αij (or βij). The raw rates, Ai and Bi, must be scaled by Ai + Bi to keep the relative rates of activation and inhibition in the range [0,1]. In that case, Equation 4 is an alternative form of Equation 1 that is suitable for describing a protein regulatory network. The parameter γi controls the timescale on which protein i approaches its steady-state concentration:
| (5) |
where ωij = αij − βij, i = 1, …, N, and j = 0, …, N.
We assume the following restrictions on the parameters in Equation 4: 0.1 ≤ γi ≤ 10 (we will assume all γi = 1, unless otherwise noted), 1 ≤ σi ≤ 20, αii = βii = 0 (no self-interactions), 0 ≤ αij ≤ 1 and 0 ≤ βij ≤ 1, αij · βij = 0 for j ≥ 0 (no dual-regulation of protein i by protein j), αi0 ≤ 0, and βi0 ≤ 0.
3.2. Qualitative Dynamics of Two-Component Motifs
In this section we use ODE 4 to explore the dynamical features of the two-component motifs in Table 1. In each case, we add a signal, S(t), to α10 (the background rate of activation of protein 1, which is X in Table 1), and we consider either X1(t) or X2(t) to be the response of the motif. We probe each motif with a signal that increases and decreases in a stepwise fashion with increasing t. The characteristic responses of each motif are shown in Figure 2. (For parameter settings in each case, see Supplemental Table 2.) The transducer (Figure 2a) simply relays the signal, whereas the inverter (Figure 2b) changes the sign of the signal. The negative FBL (Figure 2c) tends to dampen the magnitude of the signal; in this case, large changes in S lead to relatively smaller changes in X1ss. The positive FBL (Figure 2d) and the double-negative FBL (Figure 2e) are both able to function as toggle switches. They have two alternative stable steady states (on and off), and transient signals can flip the switch back and forth between the two states.
Figure 2.

Functional properties of two-component phosphoprotein interaction networks. We are solving Equation 4 for N = 2 and selected values of the interaction parameters αij and βij (see Supplemental Table 2 for parameter values). In each case, the signal (red line) is added to the parameter α10; i.e., the signal provides an external activation of the motif. (a) Transducer: S → X1 → X2. (b) Inverter: S → X1 ⊣ X2. (c) Homeostasis [negative feedback loop (FBL)]. If we consider X1(t) as the response, then we see that the steady-state response varies over a much smaller range of values than the range of input signals. (d) Toggle switch (positive FBL). (e) Toggle switch (double-negative FBL). In the neutral position (S = 0.3) of a toggle switch, it may persist in one or the other of two stable steady states (on or off ). The switch can be flipped from one state to the other by toggling the signal up and down from its neutral position. (f) The differential equations (Equation 3) for the two-component motifs in Table 1.
The toggle functions of these two motifs are most clearly illustrated by one- and two-parameter bifurcation diagrams. The one-parameter bifurcation diagram (Figure 3a) shows that the double-negative FBL has two stable steady states in the region 0.08 < S < 0.46 (for σ = 7). To flip the switch on, S must be increased above 0.46, and to flip the switch off, S must be decreased below 0.08. The critical switching limits of S depend on σ, as shown in the two-parameter bifurcation diagram (Figure 3b). For σ less than ~5, the double-negative FBL can no longer sustain bistable behavior. Of course, the precise numerical values of these limits depend on the values of the other parameters in the dynamical system, but, in general, we find that both the positive feedback motif and the double-negative feedback motif exhibit bistability over a range of signal strengths, Soff < S < Son, and that Soff and Son pull closer together as σ decreases, finally merging at a cusp bifurcation for a critical value σ = σcrit.
Figure 3.

Bifurcation diagrams for the double-negative toggle switch. (a) One-parameter bifurcation diagram. Plotting X1ss as a function of S, we see that the toggle switch is indeed bistable for S = 0.3. By raising S above Son ≈ 0.46, we can be sure the switch is on. Once the switch is on, we must lower S below Soff ≈ 0.08 to flip it off. Son and Soff are known as saddle-node bifurcation points. (b) This two-parameter bifurcation diagram illustrates how the bifurcation points, Son and Soff, depend on a second parameter, in this case, σ, the steepness of the nonlinear functions in Equation 4.
3.3. Qualitative Dynamics of Three-Component Motifs
According to Supplemental Table 1, there are 138 distinct motifs for protein regulatory networks with three components and only inhibitory self-interactions (aii = −). Each motif has its own unique characteristics, and we cannot explore them all owing to space limitations. Instead, we focus on some of the more common and important three-component motifs catalogued in Table 2.
Motif 6 (in Table 2) is a simple signal-transduction pathway, which behaves like its two-component counterpart (inverting the signal if one of the links is negative). Motif 7 splits a signal in two different directions. Motif 8 is a basic logic gate. Depending on parameter values, the output (Z) of the gate can implement 14 of the 16 possible Boolean functions on two inputs (X and Y) (for details, see Supplemental Table 3). Some examples are shown in Figure 4. For the AND gate, the output is True (Z = 1) when both inputs are True (X = 1 and Y = 1), and Z = 0 otherwise. For the NAND gate, Z = 0 when X = 1 and Y = 1, and Z = 1 otherwise.
Figure 4.

Some logic gates (Motif 8 in Table 2): (a) AND, (b) NOR, (c) NAND, and (d) NOT(A → B). Parameter values are provided in Supplemental Table 3. The two input signals (X and Y) are plotted in red and blue, respectively, and the output (Z) is in black. The numbers 00, 10, 11, and 01 indicate the states of the input signals.
Motifs 9 and 10 are simple FBLs on three variables. If the FBL is positive (a21 · a32 · a13 = +), then the motif may create a toggle switch (similar to the cases in Figure 2d,e). The negative FBL (a21 · a32 · a13 = −) exhibits a new kind of behavior: sustained oscillations in X(t), Y(t), and Z(t) (see Figure 5a). Oscillations are possible only over a restricted range of signal strength, SHB1 < S < SHB2 (Figure 5b). The points where oscillations begin and end are called Hopf bifurcation points. As σ decreases, the Hopf bifurcation points come closer together (Figure 5c), and the capacity of this negative FBL to oscillate is lost for σ less than ~8.
Figure 5.

Oscillations in three-component negative feedback loops (FBLs) (Motifs 10, 18, and 19 in Table 2). Parameter values are given in Supplemental Table 4. (a) Oscillations of a simple negative FBL (Motif 10) for S = 0.6. (b) One-parameter bifurcation diagram for Motif 10. Oscillations exist in the interval SHB1 < S < SHB2. The end points are known as Hopf bifurcation (HB) points. (c) Two-parameter bifurcation diagram for Motif 10 shows an oscillatory region bounded by an HB locus for σ > 8. (d) The interval of oscillations, SHB1 < S < SHB2, shrinks as α23 increases; i.e., Motif 10 morphs into Motif 18. (e) Oscillations of Motif 18 for S = 0.6 and α23 = 0.4. Compared with panel a, the amplitude and period of oscillation decrease as α23 increases. (f) Oscillations of Motif 19 for S = 0.6 and β23 = 0.6. Compared with panel a, the amplitude and period of oscillation increase as β23 increases. (g) One-parameter bifurcation diagram for Motif 19 at S = 0.9. Oscillations commence at an HB at β23 = 0.2765 and end at an infinite-period bifurcation at β23 = 0.7018. (h) Two-parameter bifurcation diagram for Motif 19. The oscillatory domain is bounded on the left and right by loci of HBs and at the top by a locus of infinite-period (IP) bifurcations. The motif has three steady states in the wedge-shaped region in the upper-right corner, but it is bistable only in the shaded region to the right of the HB locus.
Oscillations in a simple negative FBL are modified in characteristic ways if a two-component FBL is inserted into the three-component loop as in Motifs 18 and 19. Inserting a two-component negative FBL tends to destroy the capacity of the three-component negative FBL to oscillate. To illustrate this effect, we modify the simple negative FBL in Figure 5 (X → Y ⊣ Z → X) by adding some positive feedback from Z to Y, i.e., by increasing the parameter α23 from zero. The effect of increasing α23 (at constant σ = 10) is to decrease the range of S values for which the network oscillates (see Figure 5d). As α23 increases, the oscillations lose amplitude (Figure 5e) and eventually vanish for α23 larger than ~0.45.
Conversely, inserting a two-component positive (or double-negative) FBL into a three-component negative FBL changes the character of the oscillations quite dramatically. To illustrate how, we add some negative feedback from Z to Y by increasing the parameter β23 from zero. As β23 increases, the oscillations grow in amplitude, lengthen in period, and become less sinusoidal and more spiky, as illustrated in Figure 5f. The reasons for this behavior become evident in a one-parameter bifurcation diagram (see Figure 5g). For β23 > ~0.6, the control system has three coexisting steady states (one stable and two unstable). As β23 increases, the oscillations grow in amplitude until they coalesce with the unstable saddle point and disappear at an infinite-period bifurcation. (In Figure 5g, the infinite-period bifurcation occurs at β23 ≈ 0.7.) The two-parameter bifurcation diagram (the S-β23 plane in Figure 5h) shows a region of robust oscillations that is bounded on the sides by loci of Hopf bifurcations and capped off at the top by a locus of infinite-period bifurcations.
Motif 11 has been studied in great detail by Mangan & Alon (20), who have emphasized its role in noise suppression when X and Y activate Z according to an AND gate (or inactivate Z according to a NOR gate). In that case, brief pulses of X are insufficient to activate Z because there is not enough time for X to receive the necessary assistance from Y. Once Z is activated, then removal of the signal from X results in immediate inactivation of Z. So this motif is described as slow on, fast off.
Motif 12 has been proposed (21, 22) as a simple mechanism for perfect adaptation. In this case (Figure 6a), a stepwise increase in the signal, X(t), induces a pulse-like response in Z(t), but the response returns to its original steady-state value (or nearly so). As this is a common response in sensory systems, Tyson et al. (23) called it a “sniffer.” Incoherent FFLs can also operate similar to the triggering mechanism of a gun (Figure 6b). In this case, Z(t) exhibits a pulse-like response to a square-wave signal [i.e., X(t) varies from high to low and then back to high]. When X(t) is high, the motif is in a steady state of low Y and low Z. X(t) must drop to a sufficiently low value for a sufficiently long time for Y to accumulate (like cocking a gun). Then X(t) must rise sufficiently rapidly and strongly to activate Z before Y disappears (like pulling the trigger on a cocked gun). Notice in Figure 6 that these two behaviors are responses of the same motif (with the same parameter values) to different temporal signaling patterns.
Figure 6.

Alternative responses of incoherent feed-forward loops (Motif 12 in Table 2): (a) sniffer and (b) trigger. Parameter values are provided in Supplemental Table 4.
Motif 13 has two positive FBLs coupled together through a common intermediate. Clearly, such a motif can exhibit multiple steady states but not oscillations. Indeed, for some parameter values, Motif 13 can exhibit three stable steady states (i.e., tristability) (see Figure 7).
Figure 7.

Tristability (Motif 13 in Table 2). Parameter values are provided in Supplemental Table 4. (a) One-parameter bifurcation diagram for σ = 8, with three stable steady states for S in the vicinity of 0.5. (b) Two-parameter bifurcation diagram; tristability exists in the narrow strip where the two cusp-shaped regions overlap.
In Motif 15, a positive and a negative FBL are coupled through a common intermediate. This motif is a powerful generator of limit cycle oscillations (e.g., see Figure 8).
Figure 8.

Oscillations in an activator-amplified negative feedback loop (Motif 15 in Table 2): (a) oscillations at S = 0 and (b) one-parameter bifurcation diagram. Parameter values are provided in Supplemental Table 4.
Motifs 14, 16, 17, and 20 have been not much studied by theoreticians, to our knowledge. We have not yet identified and catalogued their information-processing potentials. Motifs 16 and 17 will generate multiple steady states but not oscillations. Motif 20 may have some interesting properties as logic gates. Neither have motifs with five and six links been studied systematically by theoreticians.
4. FUNCTIONAL MODULES IN REAL BIOCHEMICAL NETWORKS
Our third and last task is to determine whether any of these motifs are actually functioning as expected in real, experimentally characterized, biochemical regulatory networks. Transducers and inverters (Table 1, Motifs 1 and 2; and Table 2, Motif 6) are the most common features of signaling networks, like Figure 1. Typically we expect to see a hyperbolic relationship between the signal (X) and the response (Y), but more threshold-like (sigmoidal) relationships are often observed (Figure 9). Sigmoidal response curves may derive from cooperative interactions among signal molecules (24), from zero-order ultrasensitivity in enzyme-catalyzed reactions (25), from competition with other binding proteins (26, 27), or from multisite modifications of response molecules (28).
Figure 9.
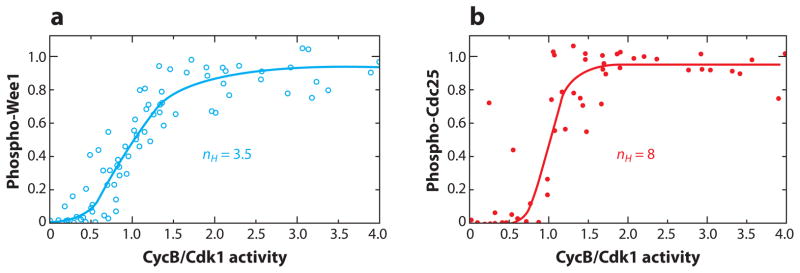
Signal transduction and inversion in the Wee1-CycB-Cdc25 axis. (a) Wee1 phosphorylation and (b) Cdc25 phosphorylation by cyclin B–dependent kinase (a dimer of CycB and Cdk1) in frog-egg extracts. In each panel, the experimental data are fitted to a Hill function with exponent nH . Because phospho-Wee1 is the inactive form and phospho-Cdc25 is the active form, panel a is an example of signal inversion and panel b of signal transduction. In the case of Wee1, Kim & Ferrell (27) presented evidence that the sigmoidal response curve results from competitive binding of CycB/Cdk1 to some other proteins in the extract. In the case of Cdc25, J.E. Ferrell (private communication) has evidence that the sigmoidal response curve results from multisite phosphorylation of Cdc25. Data in panel a from Reference 27, used by permission; unpublished data in panel b from J.E. Ferrell, used by permission.
Negative feedback (as in Table 1, Motif 3) is commonly used to maintain species X at a relatively constant level in a fluctuating environment. This seems to be the role of IκBα in keeping NF-κB in check, and the role of Mdm2 in keeping p53 at a constant low level in undamaged cells.
Motifs 4 and 5 (Table 1) are also common in Figure 1, and they are often implicated in situations where a cell undergoes an irreversible change of state or toggles back and forth between two stable steady states. Bistability was first described in the lactose utilization pathway of bacteria by Novick & Weiner (29) and characterized more recently by Ozbudak et al. (30). Gardner et al. (31) were the first to engineer bistability into a synthetic gene regulatory system. Double-negative FBLs abound in the cell cycle control network, where they are thought to create the fundamental distinction between G1 phase (unreplicated chromosomes) and S/G2/M phase (replicated chromosomes) (15, 26, 32). Positive feedback and bistability are common themes in theories of cellular memory (33, 34) and differentiation (35).
Bistability is also observed in three-component motifs, such as the Cdc25-CycB-Wee1 system (Motif 13b in Table 2), as first predicted by Novak & Tyson (17) and later verified independently by Sha et al. (36) and Pomerening et al. (37). The Rb-E2F-CycE system is a three-component positive FBL (Motif 9 in Table 2), and evidence for bistability in this motif has been garnered by Yao et al. (38).
Programmed cell death is another natural place to look for evidence of a bistable switch, because the caspase control network should be activated only when the damage to a cell exceeds a certain threshold. (Caspases should remain inactive indefinitely in cells that are undamaged or that have not received any suicide signals.) Bistability in the cell-death response was attributed by Eissing et al. (39) to the three-component positive FBL (Casp3 → Casp6 → Casp8 → Casp3) in Figure 1, and by Bagci et al. (40) to the long positive FBL created by Casp3 degradation of BCL. Albeck et al. (13, 41), however, presented evidence that these positive FBLs are not relevant to the cell-death response, and their snap-action model eschews any reference to bistability. While accepting the MIT group’s evidence for snappy release of SMAC and CytoC from mitochondria, Zhang et al. (42) believe nonetheless that the decision for this release must be implemented by a bistable switch, which they locate upstream of MOMP in the interactions of BH3-BCL-BAX (compare Figure 1 with Motif 21 in Table 2).
Branching outputs (Motif 7 in Table 2) are also common signaling motifs because transcription factors (such as E2F or p53) often modulate the expression of more than one gene, and enzymes (such as CycB-dependent kinase) often modify more than one substrate. Logic gates (Motif 8) are prevalent in transcriptional regulatory networks, where the expression of a gene is controlled by two or more transcription factors that bind to upstream regulatory sequences. In our protein regulatory network (Figure 1), the transcription factor E2F receives signals from many sources, and we show just two of them: RB and CycB. RB binds to E2F and changes its effect on target genes (from + to 0 or even to −), and E2F is inhibited by phosphorylation by CycB-dependent kinase. E2F activity is a NOR function of RB and CycB; i.e., E2F is active if and only if both RB and CycB are inactive. The transcriptional coactivator β-catenin is another good example of a logic gate. β-Cat is a NOT(A → B) function (Figure 4d) of cell-cell and cell-matrix interactions: β-Cat = True if and only if cell-cell = False and cell-matrix = True. This logic is essential to wound healing, because it promotes cell proliferation (β-Cat = True) if and only if cell-cell contacts are broken (i.e., the tissue is wounded) but cell-matrix interactions are still intact (i.e., the repair cell is properly located in the tissue rather than, say, misplaced in the blood stream or lymphatic system).
Negative FBLs with three or more components (Motif 10 in Table 2) are also common in Figure 1: for example, CycB → Cdc20 → Cdc14 → Cdh1 ⊣ CycB, or CycE ⊣ p27 ⊣ CycB ⊣ E2F → CycE. These negative FBLs are important in driving cell cycle events through a periodic sequence of states (32). Other cases in Figure 1 that appear to be two-component negative FBLs (e.g., p53-Mdm2 and NFκB-IκBα) may actually be longer loops because the interactions involve transcription-translation delays and transport between nucleus and cytoplasm (43). As anticipated, these control loops exhibit sustained oscillations under proper conditions (44–47). The famous repressilator is a synthetic gene network (X ⊣ Y ⊣ Z ⊣ X) constructed by Elowitz & Leibler (48) to prove the capacity of a simple negative FBL to generate sustained oscillations in single cells.
FFLs (Motifs 11 and 12 in Table 2) are interesting and important motifs in many regulatory networks. Using bioinformatic methods, Alon and colleagues (49, 50) have shown that FFLs are unusually common (i.e., much more common than would be expected by chance) in gene regulatory networks and in signal-transduction networks. Using dynamic models, they uncovered possible functions of these FFLs (noise suppression and adaptation), and they have presented experimental evidence for these dynamic properties (20, 51). Ghosh et al. (52) have studied the noise-suppressive characteristics of FFLs, and Wall et al. (53) have catalogued the dynamical properties of FFL circuits.
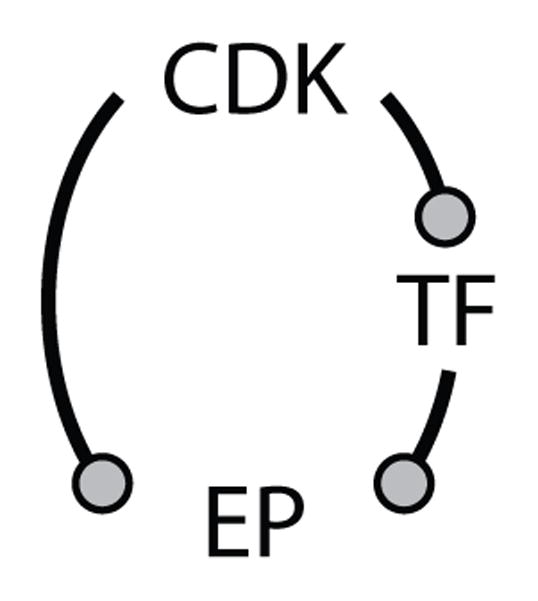
In our protein interaction network (Figure 1), we see both coherent FFLs (e.g., E2F promotes CycA synthesis directly, and E2F promotes CycA activation indirectly through CycE removal of p27, an inhibitor of CycA) and incoherent FFLs (e.g., CycB phosphorylates and inhibits Cdh1 directly, and CycB activates Cdc14, an enzyme that dephosphorylates and activates Cdh1). In these cases, the FFLs are embedded in more complex networks, and we discuss their functional properties below. We refer the reader to a recent paper by Csikasz-Nagy et al. (54) that presents evidence for the over-representation (i.e., more common than chance expectation) of the FFL motif shown in Scheme 2 that exists in the budding yeast transcriptome-phosphoproteome. In this motif, CDK is the cyclin-dependent kinase, TF is the transcription factor, and EP is the executor protein (i.e., a protein that drives some event of the cell cycle, such as DNA synthesis, chromosome condensation, spindle assembly, or cell division). In this motif, executor-protein synthesis is either promoted or repressed by the transcription factor, and both the transcription factor and executor protein are phosphorylated by cyclin-dependent kinase, which may have either positive or negative effects on their activity. By dynamic modeling, Csikasz-Nagy et al. (54) suggest that coherent FFLs should be associated with executor proteins that are active either in the G1 phase of the cell cycle (when cyclin-dependent kinase activity is low) or in the S/G2/M phase of the cell cycle (when cyclin-dependent kinase activity is high), and incoherent FFLs may be expected to function as triggering modules (cock-and-fire) at the G1/S transition or at exit from mitosis (the metaphase-anaphase-telophase transition). The authors present some modest evidence for these suggestions, which for the most part must be considered predictions of motif analysis, yet to be tested experimentally.
Scheme 2.
Motif 14 is seen in Figure 1 in the Wip1-p53-Mdm2 axis. The dynamical implications of this motif are not understood. Is one of the negative FBLs responsible for homeostatic preservation of p53 at low levels in undamaged cells, and the other responsible for p53 oscillations in damaged cells? [See Batchelor et al. (55) for recent considerations of this particular motif.]
Motif 15 (amplified negative FBL) is a common source of oscillations in cell physiology (56). It lies behind classical cellular oscillators, like the cyclic AMP signaling system in slime molds (57, 58) and MPF (M-phase promoting factor) oscillations in frog eggs (17, 59). MPF was first discovered in frog eggs by Masui & Markert (60), and many years later Maller and colleagues (61–63) identified MPF as a dimer of cyclin B and a protein kinase subunit (p34cdc2). MPF oscillations drive periodic rounds of DNA synthesis and mitosis in cytoplasmic extracts prepared from frog eggs (64). Recent experiments by Pomerening et al. (65) show conclusively that MPF oscillations depend on an amplified negative FBL (Motif 15) in the Cdc25-CycB-Cdc20 axis. The intact system shows sustained oscillations (Figure 10a,b) exactly as predicted by a mathematical model of the motif. If the positive feedback side of the motif is abrogated, the negative FBL by itself generates MPF oscillations that (in comparison to the intact motif) are more rapid, more sinusoidal, and of smaller amplitude (Figure 10c,d), exactly as predicted by the model. Although some might argue that the effects are subtle, they seem to have dramatic consequences for nuclei in the two extracts. For the extract sporting an intact control system, the nuclei show synchronous, periodic rounds of alternating DNA synthesis and mitosis, exactly as they should. For the extract lacking the positive FBL and exhibiting less robust MPF oscillations, the nuclei are replicating their DNA asynchronously and show no clear mitotic figures. Hence, the positive FBL seems to be necessary for proper coordination of DNA synthesis and mitosis during cell cycles of the early frog embryo.
Figure 10.

MPF oscillations in frog-egg extracts. MPF is a dimer of CycB and Cdk1 and can be inactivated by phosphorylation of the Cdk1 subunit by Wee1, and activated by the removal of the phosphate group by Cdc25. (a) Cyclin B protein (red) and MPF activity (dark blue) are measured at 2-min intervals. (b) The data are plotted (parametrically in time) on the MPF-cyclin phase plane. The trajectory traces out a limit cycle, exactly as predicted by Motif 15 in Table 2. (c) Same as panel a, except that the authors have pooled the results of many experiments run for longer periods of time. (d) Same as panel c, except that the positive feedback loop has been weakened by supplementing the extract with a nonphosphorylable form of Cdk1. Data from Reference 65, used by permission.
Motif 15 also exhibits a behavior known as excitability, which has been used by Suel et al. (66) to explain the competence network in bacteria. Motif 16, with a short positive FBL embedded in a long positive FBL, may be evident in Figure 1 if we assume, along with Bagci et al. (40), that caspase 3 can degrade BCL and thereby promote BAX activation. Laslo et al. (67) modeled a hematopoietic cell-fate decision (neutrophil versus macrophage) with a mathematical model based on Motif 16. Ciliberto et al. (68) used a mechanism similar to Motif 17 to model p53 oscillations. In addition to the p53-Mdm2 negative FBL, they proposed a long, overlapping positive FBL: p53 → PTEN ⊣ PIP3 → Akt → Mdm2 ⊣ p53. Although Motif 17 cannot oscillate (56), Ciliberto et al.’s (68) mechanism shows robust oscillations because the negative FBL incorporates some time delay due to Mdm2 phosphorylation and transport into the nucleus. Motif 18, with long and short overlapping negative FBLs, is represented in Figure 1 in the IRAK-NFκB-SOCS3 axis. It is not known what role, if any, the long negative FBL may play in generating NFκB oscillations.
Motif 19 is a powerful mechanism for generating bistability and oscillations. This motif plays a major role in temporal organization of the eukaryotic cell cycle (32). Motif 20 is also evident in Figure 1. For example, Cdh1 and CycB (X and Y) are coupled by mutual inhibition, and Cdh1 promotes the degradation of CycA (Z), whereas CycB represses the production of CycA by phosphorylating and inactivating E2F. The other version of this motif is exemplified by XIAP (X), which inhibits both Casp9 (Y) and Casp3 (Z), two species coupled by a positive FBL. The dynamic consequences of such overlapping FFLs, called regulating feedback and regulated feedback by Alon (3), have not been studied in any detail.
5. FUTURE DIRECTIONS
Real protein regulatory networks, such as that shown in Figure 1, are complex combinations of the simple regulatory motifs classified in this review. Although the motifs seem to be exhibiting their expected dynamical behaviors in many cases, it is not yet known to what extent the modular functionality we have described can be used to understand the information processing of real intracellular networks. The living cell is not a human-engineered system, built from carefully designed components that hook together by standardized interfaces. In the living cell, there is likely to be considerable interference (retroactivity) among the component modules (69). It remains to be understood how complex cellular control functions can be accomplished by coupling together functional modules that may be strongly interacting with each other.
Supplementary Material
SUMMARY POINTS.
The living cell is an information-processing system.
Information is processed by complex networks of interacting genes, proteins, and metabolites.
These networks can be decomposed into small interaction motifs that carry out specific information-processing functions.
The basic functions are signal transduction, homeostasis, noise suppression, logic gate, adaptation, cock-and-fire, toggle switch, and oscillation.
Examples of all these basic motifs, functioning as expected, are found in the macromolecular regulatory networks of living cells.
Understanding the functional motifs employed by cells will be crucial to future efforts to predict and intervene in their decision-making capabilities.
Acknowledgments
The authors are grateful to Martin Golubitsky, of the Mathematical Biosciences Institute at Ohio State University, for invaluable help in classifying three-component motifs, as explained in the Supplemental Appendix. J.J.T. is grateful for financial support from the NIH (GM079207 and GM078989) and for the hospitality of Merton College, Oxford, when this review was written. B.N. acknowledges support from the BBSRC (UK) and from the European Community’s seventh Framework Program (FP7/2007-2013) under grant agreement no. 201142.
Glossary
- Programmed cell death
the activation of specific proteases (caspases) and nucleases that disassemble the cell’s proteins and nucleic acids, leading to an orderly and noninflammatory death
- Module
a network motif that is carrying out a specific dynamical function in a cell
- Motif
a simple pattern of activation and inhibition among a small number of interacting molecular species
- Transcription factor
a protein that binds (often with partners) to regulatory sequences of DNA to activate or inhibit transcription of a protein-coding gene
- Kinase
an enzyme that phosphorylates a substrate molecule using ATP as the phosphate donor
- FFL
feed-forward loop
- FBL
feedback loop
- ODE
ordinary differential equation
- Phosphatase
an enzyme that removes a phosphate group from its substrate by hydrolysis of the C–O–(PO32−) bond to C–OH + HO–PO32−
- Bifurcation diagram
a plot of the asymptotic state of a variable (e.g., steady state or oscillation) as it depends on the value of a parameter in the differential equations
- Cell cycle
the sequence of events by which a growing cell replicates all its components and divides them evenly between two daughter cells
- MPF
M-phase promoting factor
Footnotes
DISCLOSURE STATEMENT
The authors are not aware of any affiliations, memberships, funding, or financial holdings that might be perceived as affecting the objectivity of this review.
Contributor Information
John J. Tyson, Email: tyson@vt.edu.
Béla Novák, Email: bela.novak@bioch.ox.ac.uk.
LITERATURE CITED
- 1.Bray D. Protein molecules as computational elements in living cells. Nature. 1995;376:307–12. doi: 10.1038/376307a0. [DOI] [PubMed] [Google Scholar]
- 2.Alon U. Network motifs: theory and experimental approaches. Nat Rev Genet. 2007;8:450–61. doi: 10.1038/nrg2102. [DOI] [PubMed] [Google Scholar]
- 3.Alon U. An Introduction to Systems Biology: Design Principles of Biological Circuits. Boca Raton, FL: Chapman & Hall/CRC; 2007. [Google Scholar]
- 4.Thomas R, D’Ari R. Biological Feedback. Boca Raton, FL: CRC; 1990. [Google Scholar]
- 5.Wolf DM, Arkin AP. Motifs, modules and games in bacteria. Curr Opin Microbiol. 2003;6:125–34. doi: 10.1016/s1369-5274(03)00033-x. [DOI] [PubMed] [Google Scholar]
- 6.Prill RJ, Iglesias PA, Levchenko A. Dynamic properties of network motifs contribute to biological network organization. PLoS Biol. 2005;3:e343. doi: 10.1371/journal.pbio.0030343. [DOI] [PMC free article] [PubMed] [Google Scholar]
- 7.Soyer OS, Pfeiffer T, Bonhoeffer S. Simulating the evolution of signal transduction pathways. J Theor Biol. 2006;241:223–32. doi: 10.1016/j.jtbi.2005.11.024. [DOI] [PubMed] [Google Scholar]
- 8.Kauffman SA. Metabolic stability and epigenesis in randomly constructed genetic nets. J Theor Biol. 1969;22:437–67. doi: 10.1016/0022-5193(69)90015-0. Pioneering use of Boolean networks to model gene regulation. [DOI] [PubMed] [Google Scholar]
- 9.Thomas R. Laws for the dynamics of regulatory networks. Int J Dev Biol. 1998;42:479–85. [PubMed] [Google Scholar]
- 10.Li F, Long T, Lu Y, Ouyang Q, Tang C. The yeast cell-cycle network is robustly designed. Proc Natl Acad Sci USA. 2004;101:4781–86. doi: 10.1073/pnas.0305937101. [DOI] [PMC free article] [PubMed] [Google Scholar]
- 11.Davidich MI, Bornholdt S. Boolean network model predicts cell cycle sequence of fission yeast. PLoS One. 2008;3:e1672. doi: 10.1371/journal.pone.0001672. [DOI] [PMC free article] [PubMed] [Google Scholar]
- 12.Gillespie DT. Stochastic simulation of chemical kinetics. Annu Rev Phys Chem. 2007;58:35–55. doi: 10.1146/annurev.physchem.58.032806.104637. [DOI] [PubMed] [Google Scholar]
- 13.Albeck JG, Burke JM, Spencer SL, Lauffenburger DA, Sorger PK. Modeling a snap-action, variable-delay switch controlling extrinsic cell death. PLoS Biol. 2008;6:2831–52. doi: 10.1371/journal.pbio.0060299. [DOI] [PMC free article] [PubMed] [Google Scholar]
- 14.Bray D, Bourret RB, Simon MI. Computer simulation of the phosphorylation cascade controlling bacterial chemotaxis. Mol Biol Cell. 1993;4:469–82. doi: 10.1091/mbc.4.5.469. [DOI] [PMC free article] [PubMed] [Google Scholar]
- 15.Chen KC, Calzone L, Csikasz-Nagy A, Cross FR, Novak B, Tyson JJ. Integrative analysis of cell cycle control in budding yeast. Mol Biol Cell. 2004;15:3841–62. doi: 10.1091/mbc.E03-11-0794. [DOI] [PMC free article] [PubMed] [Google Scholar]
- 16.Lee E, Salic A, Kruger R, Heinrich R, Kirschner MW. The roles of APC and Axin derived from experimental and theoretical analysis of the Wnt pathway. PLoS Biol. 2003;1:e10. doi: 10.1371/journal.pbio.0000010. [DOI] [PMC free article] [PubMed] [Google Scholar]
- 17.Novak B, Tyson JJ. Numerical analysis of a comprehensive model of M-phase control in Xenopus oocyte extracts and intact embryos. J Cell Sci. 1993;106(Pt. 4):1153–68. doi: 10.1242/jcs.106.4.1153. Theoretical study of bistability and oscillations of MPF activity in frog-egg extracts. [DOI] [PubMed] [Google Scholar]
- 18.Schoeberl B, Eichler-Jonsson C, Gilles ED, Muller G. Computational modeling of the dynamics of the MAP kinase cascade activated by surface and internalized EGF receptors. Nat Biotechnol. 2002;20:370–75. doi: 10.1038/nbt0402-370. [DOI] [PubMed] [Google Scholar]
- 19.Mjolsness E, Sharp DH, Reinitz J. A connectionist model of development. J Theor Biol. 1991;152:429–53. doi: 10.1016/s0022-5193(05)80391-1. [DOI] [PubMed] [Google Scholar]
- 20.Mangan S, Alon U. Structure and function of the feed-forward loop network motif. Proc Natl Acad Sci USA. 2003;100:11980–85. doi: 10.1073/pnas.2133841100. Pioneering study of the functional significance of network motifs. [DOI] [PMC free article] [PubMed] [Google Scholar]
- 21.Levchenko A, Iglesias PA. Models of eukaryotic gradient sensing: application to chemotaxis of amoebae and neutrophils. Biophys J. 2002;82:50–63. doi: 10.1016/S0006-3495(02)75373-3. [DOI] [PMC free article] [PubMed] [Google Scholar]
- 22.Iglesias PA, Levchenko A. Modeling the cell’s guidance system. Sci STKE. 2002:RE12. doi: 10.1126/stke.2002.148.re12. [DOI] [PubMed] [Google Scholar]
- 23.Tyson JJ, Chen KC, Novak B. Sniffers, buzzers, toggles and blinkers: dynamics of regulatory and signaling pathways in the cell. Curr Opin Cell Biol. 2003;15:221–31. doi: 10.1016/s0955-0674(03)00017-6. [DOI] [PubMed] [Google Scholar]
- 24.Segel LA. Biological Kinetics. Cambridge, UK: Cambridge Univ. Press; 1991. [Google Scholar]
- 25.Goldbeter A, Koshland DE., Jr An amplified sensitivity arising from covalent modification in biological systems. Proc Natl Acad Sci USA. 1981;78:6840–44. doi: 10.1073/pnas.78.11.6840. [DOI] [PMC free article] [PubMed] [Google Scholar]
- 26.Thron CD. Mathematical analysis of binary activation of a cell cycle kinase which down-regulates its own inhibitor. Biophys Chem. 1999;79:95–106. doi: 10.1016/s0301-4622(99)00041-1. [DOI] [PubMed] [Google Scholar]
- 27.Kim SY, Ferrell JE., Jr Substrate competition as a source of ultrasensitivity in the inactivation of Wee1. Cell. 2007;128:1133–45. doi: 10.1016/j.cell.2007.01.039. [DOI] [PubMed] [Google Scholar]
- 28.Gunawardena J. Multisite protein phosphorylation makes a good threshold but can be a poor switch. Proc Natl Acad Sci USA. 2005;102:14617–22. doi: 10.1073/pnas.0507322102. [DOI] [PMC free article] [PubMed] [Google Scholar]
- 29.Novick A, Weiner M. Enzyme induction as an all-or-none phenomenon. Proc Natl Acad Sci USA. 1957;43:553–66. doi: 10.1073/pnas.43.7.553. Earliest experimental evidence for bistability and hysteresis in the lac operon of bacteria. [DOI] [PMC free article] [PubMed] [Google Scholar]
- 30.Ozbudak EM, Thattai M, Lim HN, Shraiman BI, Van Oudenaarden A. Multistability in the lactose utilization network of Escherichia coli. Nature. 2004;427:737–40. doi: 10.1038/nature02298. [DOI] [PubMed] [Google Scholar]
- 31.Gardner TS, Cantor CR, Collins JJ. Construction of a genetic toggle switch in Escherichia coli. Nature. 2000;403:339–42. doi: 10.1038/35002131. First application of dynamical systems theory to the design of a synthetic gene network exhibiting multiple steady states. [DOI] [PubMed] [Google Scholar]
- 32.Tyson JJ, Novak B. Temporal organization of the cell cycle. Curr Biol. 2008;18:R759–68. doi: 10.1016/j.cub.2008.07.001. [DOI] [PMC free article] [PubMed] [Google Scholar]
- 33.Demongeot J, Kaufman M, Thomas R. Positive feedback circuits and memory. C R Acad Sci III. 2000;323:69–79. doi: 10.1016/s0764-4469(00)00112-8. [DOI] [PubMed] [Google Scholar]
- 34.Ferrell JE., Jr Self-perpetuating states in signal transduction: positive feedback, double-negative feedback and bistability. Curr Opin Cell Biol. 2002;14:140–48. doi: 10.1016/s0955-0674(02)00314-9. [DOI] [PubMed] [Google Scholar]
- 35.Bolouri H, Davidson EH. Modeling transcriptional regulatory networks. Bioessays. 2002;24:1118–29. doi: 10.1002/bies.10189. [DOI] [PubMed] [Google Scholar]
- 36.Sha W, Moore J, Chen K, Lassaletta AD, Yi CS, et al. Hysteresis drives cell-cycle transitions in Xenopus laevis egg extracts. Proc Natl Acad Sci USA. 2003;100:975–80. doi: 10.1073/pnas.0235349100. Experimental confirmation of bistability of MPF activity in frog-egg extracts. [DOI] [PMC free article] [PubMed] [Google Scholar]
- 37.Pomerening JR, Sontag ED, Ferrell JE., Jr Building a cell cycle oscillator: hysteresis and bistability in the activation of Cdc2. Nat Cell Biol. 2003;5:346–51. doi: 10.1038/ncb954. [DOI] [PubMed] [Google Scholar]
- 38.Yao G, Lee TJ, Mori S, Nevins JR, You L. A bistable Rb-E2F switch underlies the restriction point. Nat Cell Biol. 2008;10:476–82. doi: 10.1038/ncb1711. [DOI] [PubMed] [Google Scholar]
- 39.Eissing T, Conzelmann H, Gilles ED, Allgower F, Bullinger E, Scheurich P. Bistability analyses of a caspase activation model for receptor-induced apoptosis. J Biol Chem. 2004;279:36892–97. doi: 10.1074/jbc.M404893200. [DOI] [PubMed] [Google Scholar]
- 40.Bagci EZ, Vodovotz Y, Billiar TR, Ermentrout GB, Bahar I. Bistability in apoptosis: roles of bax, bcl-2, and mitochondrial permeability transition pores. Biophys J. 2006;90:1546–59. doi: 10.1529/biophysj.105.068122. [DOI] [PMC free article] [PubMed] [Google Scholar]
- 41.Albeck JG, Burke JM, Aldridge BB, Zhang M, Lauffenburger DA, Sorger PK. Quantitative analysis of pathways controlling extrinsic apoptosis in single cells. Mol Cell. 2008;30:11–25. doi: 10.1016/j.molcel.2008.02.012. [DOI] [PMC free article] [PubMed] [Google Scholar]
- 42.Zhang T, Brazhnik P, Tyson JJ. Computational analysis of dynamical responses to the intrinsic pathway of programmed cell death. Biophys J. 2009;97:415–34. doi: 10.1016/j.bpj.2009.04.053. [DOI] [PMC free article] [PubMed] [Google Scholar]
- 43.Monk NA. Oscillatory expression of Hes1, p53, and NF-κB driven by transcriptional time delays. Curr Biol. 2003;13:1409–13. doi: 10.1016/s0960-9822(03)00494-9. [DOI] [PubMed] [Google Scholar]
- 44.Lahav G, Rosenfeld N, Sigal A, Geva-Zatorsky N, Levine AJ, et al. Dynamics of the p53-Mdm2 feedback loop in individual cells. Nat Genet. 2004;36:147–50. doi: 10.1038/ng1293. [DOI] [PubMed] [Google Scholar]
- 45.Geva-Zatorsky N, Rosenfeld N, Itzkovitz S, Milo R, Sigal A, et al. Oscillations and variability in the p53 system. Mol Syst Biol. 2006;2:20060033. doi: 10.1038/msb4100068. Experimental proof of sustained oscillations in p53 and Mdm2 levels in single cells. [DOI] [PMC free article] [PubMed] [Google Scholar]
- 46.Hoffmann A, Levchenko A, Scott ML, Baltimore D. The IκB-NF-κB signaling module: temporal control and selective gene activation. Science. 2002;298:1241–45. doi: 10.1126/science.1071914. [DOI] [PubMed] [Google Scholar]
- 47.Nelson DE, Ihekwaba AE, Elliott M, Johnson JR, Gibney CA, et al. Oscillations in NF-κB signaling control the dynamics of gene expression. Science. 2004;306:704–8. doi: 10.1126/science.1099962. Experimental proof of sustained oscillations in NF-κB level in single cells. [DOI] [PubMed] [Google Scholar]
- 48.Elowitz MB, Leibler S. A synthetic oscillatory network of transcriptional regulators. Nature. 2000;403:335–38. doi: 10.1038/35002125. First application of dynamical systems theory to the design of a synthetic gene network exhibiting sustained oscillations. [DOI] [PubMed] [Google Scholar]
- 49.Shen-Orr SS, Milo R, Mangan S, Alon U. Network motifs in the transcriptional regulation network of Escherichia coli. Nat Genet. 2002;31:64–68. doi: 10.1038/ng881. [DOI] [PubMed] [Google Scholar]
- 50.Yeger-Lotem E, Sattath S, Kashtan N, Itzkovitz S, Milo R, et al. Network motifs in integrated cellular networks of transcription-regulation and protein-protein interaction. Proc Natl Acad Sci USA. 2004;101:5934–39. doi: 10.1073/pnas.0306752101. [DOI] [PMC free article] [PubMed] [Google Scholar]
- 51.Mangan S, Itzkovitz S, Zaslaver A, Alon U. The incoherent feed-forward loop accelerates the response-time of the gal system of Escherichia coli. J Mol Biol. 2006;356:1073–81. doi: 10.1016/j.jmb.2005.12.003. [DOI] [PubMed] [Google Scholar]
- 52.Ghosh B, Karmakar R, Bose I. Noise characteristics of feed forward loops. Phys Biol. 2005;2:36–45. doi: 10.1088/1478-3967/2/1/005. [DOI] [PubMed] [Google Scholar]
- 53.Wall ME, Dunlop MJ, Hlavacek WS. Multiple functions of a feed-forward-loop gene circuit. J Mol Biol. 2005;349:501–14. doi: 10.1016/j.jmb.2005.04.022. [DOI] [PubMed] [Google Scholar]
- 54.Csikasz-Nagy A, Kapuy O, Toth A, Pal C, Jensen LJ, et al. Cell cycle regulation by feed-forward loops coupling transcription and phosphorylation. Mol Syst Biol. 2009;5:236. doi: 10.1038/msb.2008.73. [DOI] [PMC free article] [PubMed] [Google Scholar]
- 55.Batchelor E, Mock CS, Bhan I, Loewer A, Lahav G. Recurrent initiation: a mechanism for triggering p53 pulses in response to DNA damage. Mol Cell. 2008;30:277–89. doi: 10.1016/j.molcel.2008.03.016. [DOI] [PMC free article] [PubMed] [Google Scholar]
- 56.Novak B, Tyson JJ. Design principles of biochemical oscillators. Nat Rev Mol Cell Biol. 2008;9:981–91. doi: 10.1038/nrm2530. [DOI] [PMC free article] [PubMed] [Google Scholar]
- 57.Gerisch G, Wick U. Intracellular oscillations and release of cyclic AMP from Dictyostelium cells. Biochem Biophys Res Commun. 1975;65:364–70. doi: 10.1016/s0006-291x(75)80102-1. [DOI] [PubMed] [Google Scholar]
- 58.Martiel JL, Goldbeter A. A model based on receptor desensitization for cyclic AMP signaling in Dictyostelium cells. Biophys J. 1987;52:807–28. doi: 10.1016/S0006-3495(87)83275-7. [DOI] [PMC free article] [PubMed] [Google Scholar]
- 59.Gerhart J, Wu M, Kirschner M. Cell cycle dynamics of an M-phase-specific cytoplasmic factor in Xenopus laevis oocytes and eggs. J Cell Biol. 1984;98:1247–55. doi: 10.1083/jcb.98.4.1247. [DOI] [PMC free article] [PubMed] [Google Scholar]
- 60.Masui Y, Markert CL. Cytoplasmic control of nuclear behavior during meiotic maturation of frog oocytes. J Exp Zool. 1971;177:129–45. doi: 10.1002/jez.1401770202. [DOI] [PubMed] [Google Scholar]
- 61.Lohka MJ, Hayes MK, Maller JL. Purification of maturation-promoting factor, an intracellular regulator of early mitotic events. Proc Natl Acad Sci USA. 1988;85:3009–13. doi: 10.1073/pnas.85.9.3009. [DOI] [PMC free article] [PubMed] [Google Scholar]
- 62.Gautier J, Minshull J, Lohka M, Glotzer M, Hunt T, Maller JL. Cyclin is a component of maturation-promoting factor from Xenopus. Cell. 1990;60:487–94. doi: 10.1016/0092-8674(90)90599-a. [DOI] [PubMed] [Google Scholar]
- 63.Gautier J, Norbury C, Lohka M, Nurse P, Maller J. Purified maturation-promoting factor contains the product of a Xenopus homolog of the fission yeast cell cycle control gene cdc2+ Cell. 1988;54:433–39. doi: 10.1016/0092-8674(88)90206-1. [DOI] [PubMed] [Google Scholar]
- 64.Murray AW, Kirschner MW. Cyclin synthesis drives the early embryonic cell cycle. Nature. 1989;339:275–80. doi: 10.1038/339275a0. [DOI] [PubMed] [Google Scholar]
- 65.Pomerening JR, Kim SY, Ferrell JE., Jr Systems-level dissection of the cell-cycle oscillator: bypassing positive feedback produces damped oscillations. Cell. 2005;122:565–78. doi: 10.1016/j.cell.2005.06.016. Thorough experimental study of MPF oscillations in frog-egg extracts. [DOI] [PubMed] [Google Scholar]
- 66.Suel GM, Garcia-Ojalvo J, Liberman LM, Elowitz MB. An excitable gene regulatory circuit induces transient cellular differentiation. Nature. 2006;440:545–50. doi: 10.1038/nature04588. [DOI] [PubMed] [Google Scholar]
- 67.Laslo P, Spooner CJ, Warmflash A, Lancki DW, Lee HJ, et al. Multilineage transcriptional priming and determination of alternate hematopoietic cell fates. Cell. 2006;126:755–66. doi: 10.1016/j.cell.2006.06.052. [DOI] [PubMed] [Google Scholar]
- 68.Ciliberto A, Novak B, Tyson JJ. Steady states and oscillations in the p53/Mdm2 network. Cell Cycle. 2005;4:488–93. doi: 10.4161/cc.4.3.1548. [DOI] [PubMed] [Google Scholar]
- 69.Del Vecchio D, Ninfa AJ, Sontag ED. Modular cell biology: retroactivity and insulation. Mol Syst Biol. 2008;4:161. doi: 10.1038/msb4100204. [DOI] [PMC free article] [PubMed] [Google Scholar]
Associated Data
This section collects any data citations, data availability statements, or supplementary materials included in this article.