

Abstract
Objectives:
Data from generalized epidemic settings have consistently found that patients on antiretroviral therapy (ART) reduce sexual risk behaviours, but how sexual behaviour changes in the general population in response to ART availability, including amongst HIV-uninfected and undiagnosed adults, has not been characterized in these settings.
Design:
General population open cohort.
Methods:
We report trends in sexual behaviour indicators for men aged 17–54 years and women aged 17–49 years in rural KwaZulu-Natal province, based on annual sexual behaviour surveys during ART scale-up from 2005 to 2011. Estimates are adjusted for survey nonparticipation and nonresponse to individual survey items using inverse probability weighting and multiple imputation. Trends are presented by HIV status, knowledge of status, age and marital status.
Results:
Reports of condom use at last sex with a regular partner increased by 2.6% points per year [95% confidence interval (CI) 1.5%, 3.7%] for men and 4.1% per year (3.0%, 5.3%) for women. Condom use at last sex with a casual partner was high and did not change significantly over the period for both sexes. There were statistically significant declines in the percentage reporting multiple partnerships in the last year and the point prevalence of concurrency. Trends within subgroups were generally consistent with overall estimates.
Conclusion:
We find no evidence of increased sexual risk-taking following ART availability and protective changes in some behaviours, suggesting that general trends in sexual behaviour are not counter-acting preventive effects of HIV treatment. Continued monitoring of population-level sexual behaviour indicators will be essential to interpret the success of combination-prevention programmes.
Keywords: Africa, antiretroviral therapy, HIV, sexual behaviour, trends
Introduction
Although new biomedical prevention technologies offer promise for reducing HIV incidence, protective changes in sexual behaviour have been an essential component in all countries that have experienced substantial reductions in the burden of HIV, including Uganda, Zimbabwe and Thailand [1–4]. The availability of antiretroviral therapy (ART) and the promotion of HIV counselling and testing have increased the numbers of adults knowing they are HIV-infected. In South Africa, knowledge of HIV status was low in 2005, with only 28% of adults aged 15 years or older ever having been tested and 8% testing in the previous 12 months [5]. A 15-month national campaign tested over 13 million adults by June 2011 [6]. The South African National Strategic Plan 2012–2016 recommends annual HIV testing of every sexually active, never tested or previously tested negative adult [7]. In addition to being the entry point for HIV care and treatment, knowledge of HIV status is an opportunity to consider protective choices in sexual behaviour.
The call for combination-prevention programmes that include biomedical, behavioural and structural interventions has highlighted the continued need to monitor trends in sexual risk behaviour [8]. In settings in which ART has been available for longer periods, increases in sexual risk behaviour amongst high-risk populations may have offset the preventive benefits of treatment [9,10]. Data from generalized epidemic settings where ART has been introduced more recently have consistently found that patients initiating ART report reducing sexual risk behaviour, but insufficient data exist to characterize how sexual behaviour in the general population, which includes HIV-uninfected and undiagnosed adults, will change in response to the availability of ART [11]. Persons may engage in riskier sexual behaviours from a belief that their risk of infection has decreased or that HIV is now a treatable infection [12], or, alternatively, counselling, knowledge of status and general awareness may motivate greater responsibility among both HIV-positive and HIV-negative individuals towards preventing transmission [13]. Sexual partner mixing in the general population may also change with HIV-infected individuals more likely to choose other HIV-positive individuals as sexual partners and with ART clinic environments providing a setting for HIV-positive individuals to meet each other [14].
We use annual surveillance data to examine population-level trends in sexual risk behaviour within a general population cohort in rural KwaZulu-Natal during the period of local ART scale-up from 2005 to 2011. As a single indicator can be influenced by concomitant trends in the denominator over time, we examine trends in several related indicators [15].
Methods
Longitudinal demographic and health data of over 90 000 resident and nonresident members of more than 11 000 households in the Hlabisa sub-district in Northern Kwa-Zulu Natal, South Africa, have been collected since January 2000 in the Africa Centre Demographic Surveillance system (ACDSS) (www.africacentre.ac.za) [16]. Routine data, including births, deaths and migrations, were reported by key household respondents during bi-annual visits. Annual HIV surveillance began in 2003. All resident household members aged 15 years and older at the most recent household visit were eligible to participate in HIV testing, and a sample of nonresident household members (women aged 15–49 years and men aged 15–54 years) was selected. Consenting participants donated a dried blood spot sample via fingerprick for HIV testing in a central laboratory. HIV prevalence among adults aged 15–49 years was 29% in 2011 [17]. Sexual behaviour data, including details about each participant's three most recent sexual partners in the past year, had been collected annually as part of the HIV surveillance visit since 2005. Participants were able to choose to participate in sexual behaviour surveillance, but not give a blood sample for HIV testing, or vice versa. Since 2006, a question about whether the respondent knows his or her own HIV status had been asked.
The local government-run HIV treatment and care programme was established in late 2004, initially at the local hospital and one primary healthcare clinic. The ART programme expanded rapidly, first to 6 clinics and 1800 adult patients by 2006 [18], and later to 17 clinics by January 2008. A total of 20 598 adults had initiated treatment by December 2011, estimated to be 31% of all HIV-infected adults aged 15–49 years [17]. The estimated crude HIV incidence in the area was 2.63 per 100 person-years [95% confidence interval (CI) 2.50, 2.77] during the period 2004–2011 [19].
We analysed trends in population-level sexual behaviour indicators amongst men aged 17–54 years and women aged 17–49 years over the period of ART scale-up from 2005 through 2011 (sexual behaviour data were not available for 15–16-year-olds in 2008 and 2011). Indicators considered were the percentage who ever had sex, the percentage sexually active in the past year, the average number of sexual partners in the past year, the percentage reporting multiple partnerships in the past year, the point-prevalence of concurrent sexual partnerships, the percentage reporting a casual partner in the past year, the percentage reporting condom use at last sex with the most recent casual partner, the percentage reporting condom use at last sex with the most recent regular partner and the average age difference in years between the respondent and his or her most recent regular partner.
Ethics approval for all surveillance data collection activities was obtained from the Nelson Mandela Medical School Research Ethics Committee, University of KwaZulu Natal, Durban.
Analyses
To estimate indicators representative of the entire population and ensure that trends were not the result of changes in survey participation, we adjusted estimates for missing data. Missing data resulting from survey nonparticipation, either due to noncontact of eligible respondents or refusal, were adjusted for by weighting analyses using survey-response weights, calculated based on the demographic information routinely collected in ACDSS. For resident household members, response weights were calculated as the inverse probability of survey participation in strata defined by 5-year age group, sex, education level and urban/peri-urban/rural place of residence. For nonresident household members, a 10% stratified random sample was selected for survey participation according to five strata defined by the self-reported frequency of return visits to the surveillance area. In addition, any nonresident member who had tested HIV-negative in the previous two rounds of surveillance was included in the nonresident sample. Weights for the nonresident participants accounted for both the probability of inclusion in the nonresident sample and the probability of survey participation within strata defined by age group, sex and pattern of return visits to the surveillance area.
Missing data resulting from failure to respond to individual survey items were adjusted for using multiple imputation by chained equations. Consistency between related sexual behaviour outcomes was enforced by imputing missing outcomes conditional on the values of other sexual behaviour outcomes [20]. The number of sexual partners in the past year was imputed for individuals who had ever had sex as a one-inflated negative binomial random variable [20]. Concurrency was imputed as a binary outcome at 6 months before the survey for those with multiple partnerships in the past year [21]. Condom use at last sex with a regular partner and with a casual partner were imputed as binary outcomes for those with a regular and casual partner in the past year, respectively. The age difference with the most recent regular partner was imputed as a continuous outcome. Each sexual behaviour outcome, HIV status from the surveillance and knowledge of HIV status were imputed using regression models that included demographic characteristics, individual and household socio-economic status, individual health status, HIV status and knowledge of HIV, ART knowledge and attitudes, number of partners in the past 12 months and concurrency. Imputations were conducted separately for each annual survey round, resident and nonresident household members, and for men and women. Results are based on 100 imputed datasets pooled using Rubin's rule [22].
We report annual population-level estimates and 95% CIs for the nine sexual behaviour indicators described above for all (resident and nonresident together) men aged 17–54 years and women aged 17–49 years. Estimates are reported adjusting for missing data and compared to estimates based on analyses that do not include adjustment for missing data – that is, analyses including only respondents for whom complete data were available for the outcome and covariates of interest. In the case of the nonresident contribution of the data, the unadjusted analyses include the sampling weights but not response weights. Linear trends in sexual behaviour indicators over time were estimated using generalized estimating equations with an exchangeable covariance structure to allow for correlation in individuals appearing in multiple survey rounds [23]. Trends were compared between groups defined by HIV status from the surveillance, knowledge of HIV status, and by age and marital status as a priori we anticipated these characteristics to be associated with different sexual behaviours, for example, motivation to negotiate or use condoms [24,25]. We disaggregate by marital status only for those above age 30 years because very few men and women were married by 30 years of age (<3%).
Analyses were conducted using R[26]. Multiple imputation was implemented using the R package, ‘mi’ [27].
Results
In all surveillance rounds, participation was greater among women than men (Table 1). Participation by both sexes declined over time, as did the percentage of participants with complete responses, with no difference by sex. The decline from 2008 in the percentage with complete sexual behaviour data is completely comprised of an increase in respondents who participated in one component of the survey (e.g. general health or HIV testing), but did not answer any sexual behaviour questions, likely related to a change in the consent procedure in that survey round in which respondents were asked to separately consent for the different components of the survey. There was no systematic change in the probability of answering specific items on the sexual behaviour survey amongst persons who were contacted and consented to participate. Nonresidents were generally more likely to have complete sexual behaviour data if they participated in the study than residents. By the time of the scheduled survey visit, on average 21% of eligible men and 18% of women had out-migrated, were un-contactable, had died or were unable to complete the survey for other reasons. These contributed to the nonresponse rate. Additional analyses of factors associated with survey participation are presented in the Supplementary Information. Previously reported sexual behaviours were not significantly associated with survey participation after adjusting for demographic characteristics. Knowledge of HIV status increased dramatically for both sexes over the period, and was higher among women than men in each round (Table 1).
Table 1.
Survey participation and knowledge of HIV status by sex.
| 2005 | 2006 | 2007 | 2008 | 2009 | 2010 | 2011 | ||||||||
| Men | Women | Men | Women | Men | Women | Men | Women | Men | Women | Men | Women | Men | Women | |
| Eligible population aged 17–54 years (M)/17–49 years (W) | 20 399 | 21 129 | 20 586 | 21 234 | 21 344 | 22 011 | 21 656 | 22 289 | 21 382 | 21 849 | 22 100 | 22 726 | 21 779 | 22 267 |
| Percentage nonresident | 47% | 35% | 48% | 36% | 48% | 36% | 48% | 36% | 48% | 36% | 47% | 35% | 48% | 38% |
| Total number selected for survey participation* | 12 239 | 14 986 | 12 039 | 14 801 | 12 406 | 15 245 | 12 997 | 15 861 | 12 473 | 15 343 | 13 344 | 16 318 | 12 861 | 15 394 |
| Total number of survey participants (%) | 5148 (42%) | 8133 (54%) | 4870 (40%) | 7774 (53%) | 3586 (29%) | 6511 (43%) | 3440 (26%) | 5963 (38%) | 3343 (27%) | 6282 (41%) | 3557 (27%) | 6181 (38%) | 3931 (31%) | 6358 (41%) |
| Number with complete sexual behaviour data (%) | 4311 (84%) | 6916 (85%) | 4040 (83%) | 6626 (85%) | 2864 (80%) | 5303 (81%) | 2372 (69%) | 4371 (73%) | 2126 (64%) | 4018 (64%) | 2185 (61%) | 3670 (59%) | 2336 (59%) | 3573 (56%) |
| Unadjusted % knows HIV status (95% CI) | 30% (27–33) | 46% (44–47) | 33% (28–37) | 52% (48–55) | 33% (29–36) | 59% (57–62) | 54% (50–58) | 75% (73–77) | 55% (51–60) | 78% (76–80) | 55% (50–59) | 82% (80–84) | ||
| Adjusted % knows HIV status (95% CI)† | 33% (29–38) | 48% (45–52) | 37% (30–44) | 53% (49–57) | 38% (31–44) | 62% (58–65) | 56% (50–62) | 77% (74–80) | 57% (52–62) | 78% (75–81) | 55% (51–60) | 83% (80–85) | ||
*Number selected for survey includes all resident household members and sample of nonresident household members (see Methods section).
†Adjusted for item nonresponse using multiple imputation and adjusted for survey nonresponse using inverse probability weighting.
In all, except the most recent year, more women than men reported ever having had sex (Fig. 1), reflective of the older age at first sex for men compared to women in this population. However, men reported more partners in the past year, and much higher levels of multiple partnerships, concurrency and casual partnerships. Less than 1% of women reported multiple partnerships and concurrency, and less than 5% reported a casual partner, since 2008. Men and women reported similar levels of condom usage and average age differences with regular partners. Adjustment for item missingness and nonresponse had little impact generally. However, among men, adjustment increased the estimated percentage of men who had sexually debuted, who had been sexually active in the past year, who had reported concurrent partners in the past year, and the mean number of partners in the past year (Fig. 1).
Fig. 1.
Trends in reported sexual behaviour indicators by sex (men – blue; women – green).
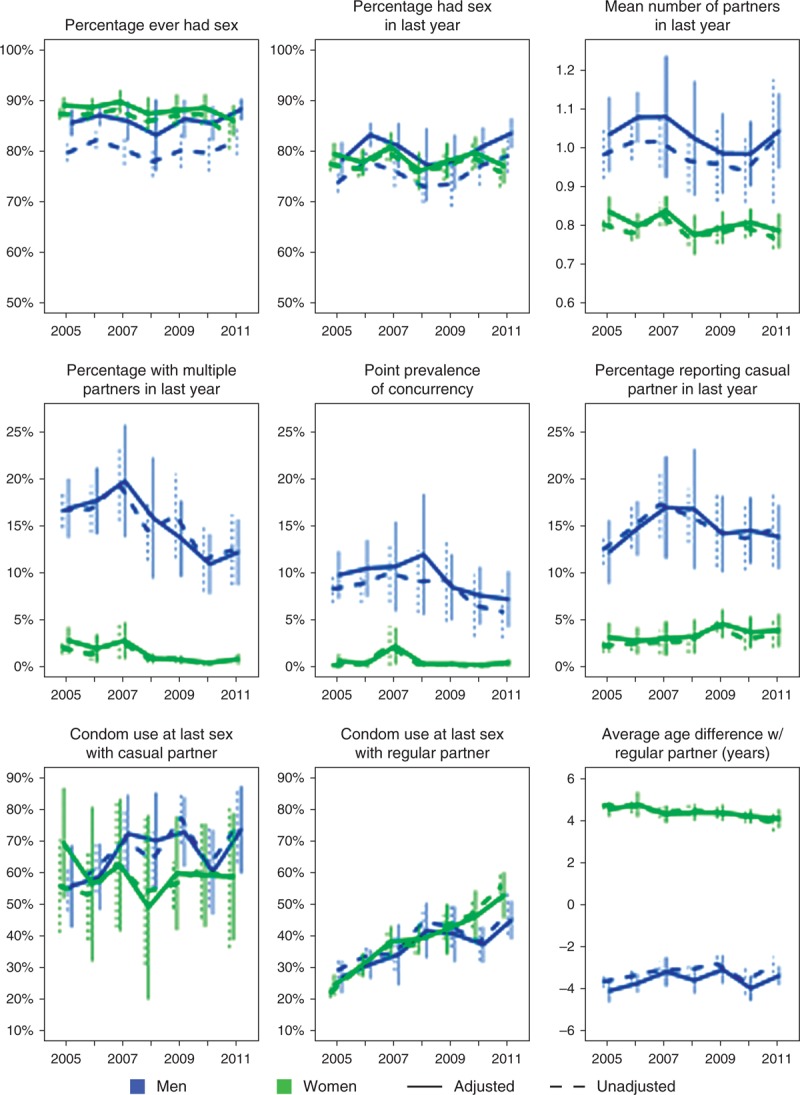
Solid lines indicate trends adjusted for missing data, dashed lines indicate unadjusted. Vertical lines indicate 95% confidence intervals. For condom usage and age difference with last regular partner and last casual partner estimates are amongst all adults who reported having a regular or casual partner in the past year, respectively. For all other indicators the denominator is all adults (age 17–54 years for men, age 17–49 years for women).
The percentage reporting condom use at last sex with a regular partner increased significantly by an average of 2.6% points per year for men (95% CI 1.5%, 3.7%) and 4.1% per year for women (3.0%, 5.3%) (Fig. 2). In contrast, reported condom use at last sex with a casual partner did not change significantly over time for either sex, but it was already over 50% in 2005 compared to less than 30% with regular partners. There were statistically significant declines in the percentage with multiple partnerships in the past year and the point prevalence of concurrency. The proportion with multiple partnerships decreased by 1.2% (0.5%, 1.9%) per annum for men and 0.4% (0.2%, 0.6%) for women, whereas the point prevalence of concurrency decreased by 0.6% (0.0%, 1.1%) per annum for men and 0.1% (0%, 0.2%) for women. There were no other statistically significant trends observed.
Fig. 2.
Average annual change in reported sexual behaviour indicators.
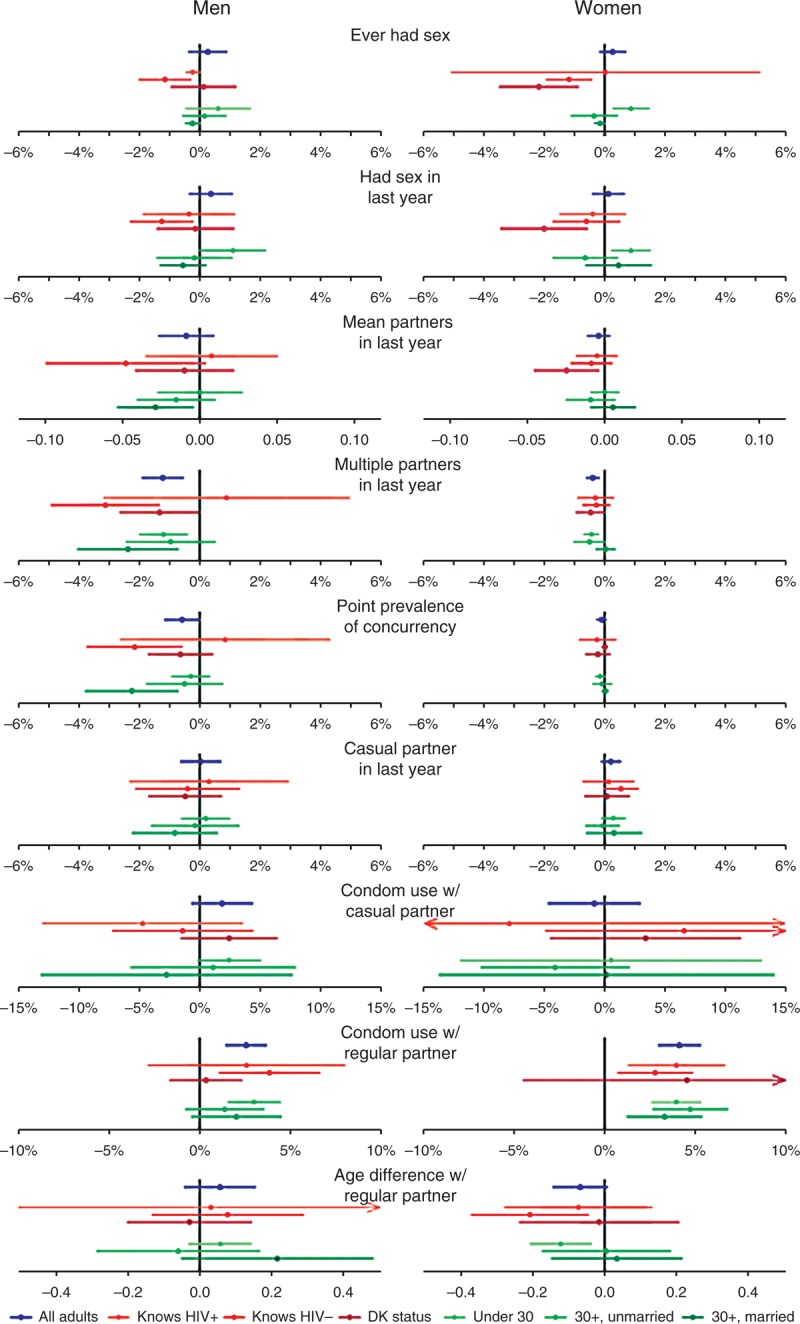
Trends are presented for overall adult population, and for subgroups defined by knowledge of HIV status, and by age group and marital status. Points indicate the average absolute (percentage point) change per year based on an estimated linear trend over the period 2005–2011. Horizontal lines indicate 95% confidence intervals.
Figure 2 shows the point estimate and 95% CI for the slope of the linear trend over the period 2005–2011 for each sexual behaviour outcome within subgroups defined by marital status and age, and by knowledge of HIV status. Generally, trends within subgroups were consistent with the overall slope estimates, although the CIs were wide in many cases. Further to the significant and substantial increase in condom use at last sex with a regular partner over the period (Fig. 1), among men, the annual increase in condom use with regular partners was greater amongst men who reported knowing their status than men who did not (irrespective of actual status), although the difference was not statistically significant (Fig. 2). All age and marital groups of men and women had similar slopes, with condom use levels remaining highest among younger ages and lowest among married men and women.
Figure 3 shows the significant increasing trends in reported condom use by HIV status determined in the surveillance and knowledge of status for each sex. The increase is similar over time in the two groups defined by HIV status. Notably, by 2005, HIV-positive women were already significantly more likely to report using a condom with a regular partner at last sex than HIV-negative women (P < 0.001); this difference was maintained throughout the period. The data suggest slightly higher levels of condom use are reported among those with knowledge of HIV status compared to no knowledge, and among those with knowledge of an HIV-positive vs. HIV-negative status.
Fig. 3.
Trends in reported condom use at last sex with a regular partner for men (top) and women (bottom) for groups defined by HIV status and knowledge of HIV status.
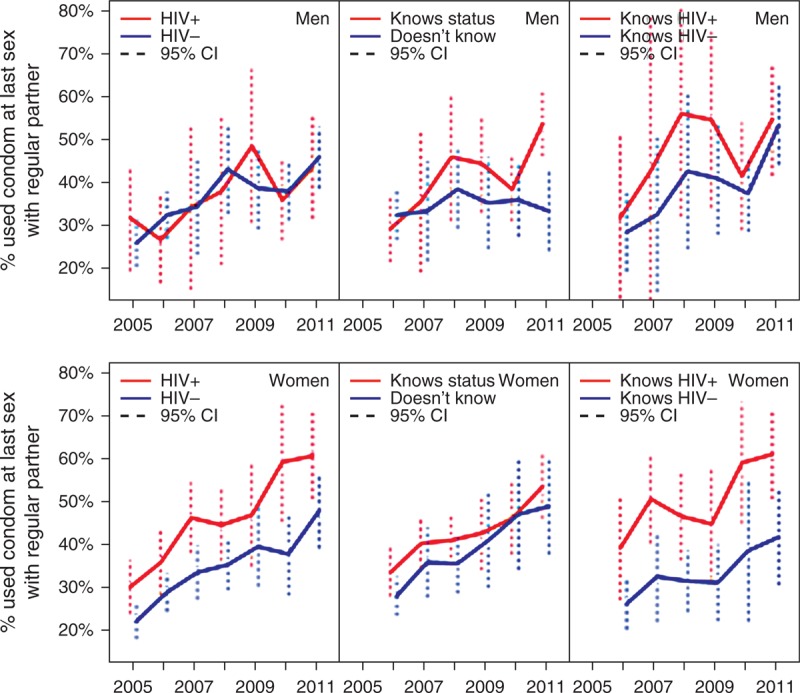
Vertical lines indicate 95% confidence intervals.
Discussion
In this study, we present longitudinal trends in population-level reported sexual behaviour over a 7-year period during which ART was scaled up in rural KwaZulu-Natal, South Africa. We found no evidence of an increase in risky sexual behaviour at the population level as access to ART expanded. Indeed, adjusting for missing data, estimated trends showed evidence of decreases in some reported sexual risk behaviour between 2005 and 2011, including fewer men and women reporting multiple sexual partnerships and concurrency.
There was a substantial increase in reported condom usage at last sex with regular sexual partners from an average of 26% of men and women in 2005, to 49% in 2011. Condom use at last sex with casual partners had already been reported by many by 2005 – 56% of men and 70% of women who reported a casual partner – and did not increase further, but remained higher than condom use at last sex with regular partners throughout the period. An increase in reported condom use with regular partners was consistent with data from another survey in KwaZulu-Natal that found substantial increases in condom use amongst co-habiting and marital partnerships between 1998 and 2008 [28]. High reported levels of condom use with casual partners is consistent with reports from other settings that condoms are still more often perceived as a method for preventing sexually transmitted infection (STI)/HIV infection in extra-marital relationships [25].
The promotion of voluntary counselling and testing (VCT) and ART as a part of the local scale-up of services substantially increased knowledge of HIV status among both sexes between 2005 and 2011 in this population [29]. Beyond these scale-up of services, little HIV-prevention programme activity occurred in the area during this study period. Learning one's HIV status and the associated counselling have been suggested to affect subsequent sexual behaviour [30,31], and so this increase in HIV testing could be partially motivating the observed protective changes in sexual behaviour at the population level. Our analysis does not assess causal relationship between learning one's HIV status and sexual behaviour. Throughout the period, condom use with a regular partner was slightly higher amongst those who knew their HIV status, but the dramatic increase in reported condom usage also occurred amongst those who did not know their status (Fig. 3), suggesting that changes were not solely an aggregated direct response to more individuals learning their HIV status. The level of condom use reported with last regular partner by HIV-positive women was similar in each year to that reported by men, but significantly higher than the level reported by HIV-negative women. Women who are aware of their HIV-positive status may be motivated by a desire to protect their partner and therefore more likely to introduce and negotiate continued condom use [13]. The proportion reporting condom use at last sex with a regular partner did not go beyond 70% for any subgroup, and knowledge of HIV status had plateaued in men at approximately 55% by 2009, whereas among women it reached 82% by 2011. Although the goal should not be 100% condom coverage of all sexual acts – especially if couples make condom use decisions informed by mutual disclosure of HIV status – there remains an opportunity to promote HIV counselling and testing, and informed condom usage based on knowledge of status of both members within a partnership [30].
Establishing the epidemiological consequences of an increase in condom usage at last sex requires further investigation. In another recent study, holding other HIV risk factors constant, we found that the level of condom usage at last sex with a regular partner in the surrounding local community (included in the regression as a space and time-varying variable) was not associated with a reduction in the risk of acquiring HIV infection [19]. This null finding could be a consequence of inconsistent or incorrect usage reducing the long-term effectiveness of condoms for HIV prevention [32]. Trends in reported consistent condom usage [assessed based on the alternate survey question ‘Have you and your partner ever used a condom? (If yes) How often do you use condoms?’] mirrored trends in reports of condom use at last sex with both regular and casual partners (data not shown); however, in both cases, the proportion reporting always using condoms was lower than the proportion reporting condom use at last sex.
We find small reductions in the percentage of the population reporting more than one sexual partner and in the point prevalence of concurrency for men, but no reductions in the proportion reporting a casual sexual partner in the past year. Men reported much higher aggregate levels of sexual risk behaviour than women, as has been commonly observed in other sexual behaviour surveillance, possibly reflecting different social desirability biases [33,34]. If biases in reporting of sexual behaviour remain unchanged over time, trends should still appropriately represent the direction of any changes in sexual behaviour and be useful lead indicators of anticipated trends in the HIV epidemic. However, if social desirability biases change, perhaps in response to public health messages, under-reporting of risk behaviour could increase. Johnson et al.[35] found that their STI–HIV interaction model fit observed epidemic data from South Africa significantly better when the model allowed bias in the increase in reported condom usage. Thus, it is possible that the reported trends over-estimate the changes in sexual risk behaviour over the period, and might partially explain why HIV incidence has remained high, approximately 2.6% annually, in this area [19]. Nevertheless, it is worth noting that in a number of other epidemic settings declines in HIV incidence and prevalence have been successfully predicted by declines in reported sexual risk behaviour [1–4].
The women's and men's sexual behaviour surveys have been subject to nonresponse rates of 40–60% in each round, with participation declining over time. We used multiple imputation and nonresponse weighting to adjust missing data. This produces estimated levels and trends in sexual behaviour indicators representative of the entire general population and ensures that apparent changes were not an artefact of changes in the composition of respondents over time. Such adjustment has not been part of the methodology used in other studies examining sexual behaviour trends [4,36]. In our study, adjusted trends were in several cases attenuated compared to unadjusted trends, so failing to adjust for missing data may have exaggerated the magnitude of behaviour change.
These adjustments, and hence the robustness of our conclusions, rely on the assumption that the missingness may be correlated to the observed characteristics, but not related to the specific value of the missing data [i.e. the missing data are ‘missing at random’ (MAR)] [22]. Sample selection models, in particular, the Heckman model, have been proposed to adjust for this bias when estimating HIV prevalence from household-based biomarker surveys [37,38] in response to evidence that the decision to participate in household-based HIV sero-surveillance may be related to knowledge of HIV status [29,39,40]. For our analysis of sexual behaviour outcomes, we did not use Heckman models because we did not find evidence of violation of the MAR assumption and, unlike for biological markers, there were no obvious selection variables to use as an exclusion restriction in Heckman models with behavioural outcomes [41]. The inclusion of many and diverse covariates in imputation models increased the plausibility of the MAR assumption [42,43] – the additional data available in the demographic surveillance system provided critical information to facilitate this [16].
For a large public ART programme in South Africa, evidence that general trends in sexual behaviour at the population level are not counter-acting preventive effects of HIV treatment during the initial rollout period is welcome news. Continued monitoring of population-level sexual behaviour indicators in the coming years as programmes mature will be essential to interpret the success of combination-prevention programs and will provide evidence of any long-term impact of ART on the sexual risk behaviour of general populations as well as HIV-infected individuals.
Acknowledgements
We thank the individuals who participated in the surveys, the community who live in the DSA for their continued support, the field teams and Colin Newell.
Contributorship statement: N.M. and J.W.E. designed the study. N.M., J.W.E. and T.W.B. contributed to the statistical analysis. J.W.E. created the imputation models. N.M. took primary responsibility for writing the manuscript. N.M., J.W.E., T.W.B., F.T. and M.L.N. contributed to data analysis interpretation and writing and critiquing of the manuscript.
Core support for the Africa Centre, including funding for the population-based HIV surveillance, was received from the Wellcome Trust, (grant # 082384/Z/07/Z). N.M. was supported by a Wellcome Trust fellowship (grant # WT083495MA). J.W.E. received scholarship support from the British Marshall Aid and Commemoration Commission and support from the Bill and Melinda Gates Foundation through a grant to the HIV Modelling Consortium. F.T. and T.B. were supported by 1R01-HD058482-01 from the National Institute of Child Health and Human Development (NICHD), National Institutes of Health (NIH) and 1R01MH083539-01 from the National Institute of Mental Health (NIMH), NIH.
Conflicts of interest
There are no conflicts of interest.
Supplementary Material
Footnotes
Correspondence to Nuala McGrath, Faculty of Medicine, University of Southampton, Mailpoint 805, C floor, South Academic Block, Southampton General Hospital, Southampton SO166YD, UK. Tel: +44 2380796532; e-mail: n.mcgrath@soton.ac.uk
References
- 1.Winkelstein W, Jr, Wiley JA, Padian NS, Samuel M, Shiboski S, Ascher MS, et al. The San Francisco Men's Health Study: continued decline in HIV seroconversion rates among homosexual/bisexual men. Am J Public Health 1988; 78:1472–1474 [DOI] [PMC free article] [PubMed] [Google Scholar]
- 2.Nelson KE, Celentano DD, Eiumtrakol S, Hoover DR, Beyrer C, Suprasert S, et al. Changes in sexual behavior and a decline in HIV infection among young men in Thailand. N Engl J Med 1996; 335:297–303 [DOI] [PubMed] [Google Scholar]
- 3.Stoneburner RL, Low-Beer D. Population-level HIV declines and behavioral risk avoidance in Uganda. Science 2004; 304:714–718 [DOI] [PubMed] [Google Scholar]
- 4.Gregson S, Garnett GP, Nyamukapa CA, Hallett TB, Lewis JJ, Mason PR, et al. HIV decline associated with behavior change in eastern Zimbabwe. Science 2006; 311:664–666 [DOI] [PubMed] [Google Scholar]
- 5.Peltzer K, Matseke G, Mzolo T, Majaja M. Determinants of knowledge of HIV status in South Africa: results from a population-based HIV survey. BMC Public Health 2009; 9:174. [DOI] [PMC free article] [PubMed] [Google Scholar]
- 6.Republic of South Africa Global AIDS response progress report 2012. National Department of Health/South African National AIDS Council; 2012, http://www.unaids.org/en/dataanalysis/knowyourresponse/countryprogressreports/2012countries/ [Accessed 29 July 2013] [Google Scholar]
- 7.South African National AIDS Council National strategic plan on HIV, STIs and TB 2012–2016. 2011, http://www.ilo.org/aids/legislation/WCMS_125657/lang--en/index.htm [Accessed 29 July 2013] [Google Scholar]
- 8.Padian NS, McCoy SI, Manian S, Wilson D, Schwartlander B, Bertozzi SM. Evaluation of large-scale combination HIV prevention programs: essential issues. J Acquir Immune Defic Syndr 2011; 58:e23–e28 [DOI] [PubMed] [Google Scholar]
- 9.Zablotska IB, Crawford J, Imrie J, Prestage G, Jin F, Grulich A, et al. Increases in unprotected anal intercourse with serodiscordant casual partners among HIV-negative gay men in Sydney. AIDS Behav 2009; 13:638–644 [DOI] [PubMed] [Google Scholar]
- 10.Bezemer D, de Wolf F, Boerlijst MC, van Sighem A, Hollingsworth TD, Prins M, et al. A resurgent HIV-1 epidemic among men who have sex with men in the era of potent antiretroviral therapy. AIDS 2008; 22:1071–1077 [DOI] [PubMed] [Google Scholar]
- 11.Venkatesh KK, Flanigan TP, Mayer KH. Is expanded HIV treatment preventing new infections? Impact of antiretroviral therapy on sexual risk behaviors in the developing world. AIDS 2011; 25:1939–1949 [DOI] [PMC free article] [PubMed] [Google Scholar]
- 12.Cassell MM, Halperin DT, Shelton JD, Stanton D. Risk compensation: the Achilles’ heel of innovations in HIV prevention?. BMJ 2006; 332:605–607 [DOI] [PMC free article] [PubMed] [Google Scholar]
- 13.King R, Lifshay J, Nakayiwa S, Katuntu D, Lindkvist P, Bunnell R. The virus stops with me: HIV-infected Ugandans’ motivations in preventing HIV transmission. Soc Sci Med 2009; 68:749–757 [DOI] [PubMed] [Google Scholar]
- 14.Stanley AHV, Timaeus IM.I have chosen to be in love with someone who understands me: disclosure, support and condom use in relationships where both partners take ART. AIDS Impact Conference Gaberone, Botswana 2009http://www.aidsimpact.com/2009/Academics/Programme/abstract/?id=235 [Accessed 29 July 2013] [Google Scholar]
- 15.Slaymaker E. A critique of international indicators of sexual risk behaviour. Sex Transm Infect 2004; 80:13–21 [DOI] [PMC free article] [PubMed] [Google Scholar]
- 16.Tanser F, Hosegood V, Barnighausen T, Herbst K, Nyirenda M, Muhwava W, et al. Cohort Profile: Africa Centre Demographic Information System (ACDIS) and population-based HIV survey. Int J Epidemiol 2008; 37:956–962 [DOI] [PMC free article] [PubMed] [Google Scholar]
- 17.Zaidi J, Grapsa E, Tanser F, Newell ML, Barnighausen T. Dramatic increases in HIV prevalence after scale-up of antiretroviral treatment: a longitudinal population-based HIV surveillance study in rural Kwazulu-Natal. AIDS 2013; May 10 [Epub ahead of print] [DOI] [PMC free article] [PubMed] [Google Scholar]
- 18.Houlihan CF, Bland RM, Mutevedzi PC, Lessells RJ, Ndirangu J, Thulare H, Newell ML. Cohort profile: Hlabisa HIV Treatment and Care Programme. Int J Epidemiol 2011; 40:318–326 [DOI] [PMC free article] [PubMed] [Google Scholar]
- 19.Tanser F, Bärnighausen T, Grapsa E, Zaidi J, Newell ML. High coverage of ART associated with decline in risk of HIV acquisition in rural KwaZulu-Natal, South Africa. Science 2013; 339:966–971 [DOI] [PMC free article] [PubMed] [Google Scholar]
- 20.Eaton JW. Chapter 3: a novel approach to adjusting for missing data in population-based surveillance to estimate trends in sexual behaviour in a high HIV prevalence region in South Africa. The spread and control of HIV in southern Africa. London:Imperial College; 2012 [Google Scholar]
- 21.UNAIDS Reference Group on Estimates, Modelling, and Projections: Working Group on Measuring Concurrent Sexual Partnerships HIV: consensus indicators are needed for concurrency. Lancet 2010; 375:621–622 [DOI] [PubMed] [Google Scholar]
- 22.Rubin DB. Multiple imputation for nonresponse in surveys. New York:John Wiley & Sons; 1987 [Google Scholar]
- 23.Zeger SL, Liang KY, Albert PS. Models for longitudinal data: a generalized estimating equation approach. Biometrics 1988; 44:1049–1060 [PubMed] [Google Scholar]
- 24.Efficacy of voluntary HIV-1 counselling and testing in individuals and couples in Kenya, Tanzania, and Trinidad: a randomised trial. The Voluntary HIV-1 Counseling and Testing Efficacy Study Group. Lancet 2000; 356:103–112 [PubMed] [Google Scholar]
- 25.Chimbiri AM. The condom is an ‘intruder’ in marriage: evidence from rural Malawi. Soc Sci Med 2007; 64:1102–1115 [DOI] [PubMed] [Google Scholar]
- 26.Team RDC R: a language and environment for statistical computing.R Foundation for Statistical Computing Vienna, Austria 2012 [Google Scholar]
- 27.Su YGA, Hill J, Yajima M. Multiple imputation with diagnostics (mi) in R: Opening windows into the black box. J Stat Softw 2011; 45:31 [Google Scholar]
- 28.Maharaj P, Neema S, Cleland J, Busza J, Shah I. Condom use within marriage: an assessment of changes in South Africa and Uganda. AIDS Care 2012; 24:444–450 [DOI] [PubMed] [Google Scholar]
- 29.Barnighausen T, Tanser F, Malaza A, Herbst K, Newell ML. HIV status and participation in HIV surveillance in the era of antiretroviral treatment: a study of linked population-based and clinical data in rural South Africa. Trop Med Int Health 2012; 17:e103–e110 [DOI] [PMC free article] [PubMed] [Google Scholar]
- 30.Delavande A, Kohler HP. The impact of HIV testing on subjective expectations and risky behavior in Malawi. Demography 2012; 49:1011–1036 [DOI] [PMC free article] [PubMed] [Google Scholar]
- 31.Sherr L, Lopman B, Kakowa M, Dube S, Chawira G, Nyamukapa C, et al. Voluntary counselling and testing: uptake, impact on sexual behaviour, and HIV incidence in a rural Zimbabwean cohort. AIDS 2007; 21:851–860 [DOI] [PubMed] [Google Scholar]
- 32.Weller S, Davis K. Condom effectiveness in reducing heterosexual HIV transmission. Cochrane Database Syst Rev 2002. CD003255. [DOI] [PubMed] [Google Scholar]
- 33.Clark S, Kabiru C, Zulu E. Do men and women report their sexual partnerships differently? Evidence from Kisumu, Kenya. Int Perspect Sex Reprod Health 2011; 37:181–190 [DOI] [PMC free article] [PubMed] [Google Scholar]
- 34.Nnko S, Boerma JT, Urassa M, Mwaluko G, Zaba B. Secretive females or swaggering males? An assessment of the quality of sexual partnership reporting in rural Tanzania. Soc Sci Med 2004; 59:299–310 [DOI] [PubMed] [Google Scholar]
- 35.Johnson LF, Hallett TB, Rehle TM, Dorrington RE. The effect of changes in condom usage and antiretroviral treatment coverage on human immunodeficiency virus incidence in South Africa: a model-based analysis. J R Soc Interface 2012; 9:1544–1554 [DOI] [PMC free article] [PubMed] [Google Scholar]
- 36.Biraro S, Shafer LA, Kleinschmidt I, Wolff B, Karabalinde A, Nalwoga A, et al. Is sexual risk taking behaviour changing in rural south-west Uganda? Behaviour trends in a rural population cohort 1993–2006. Sex Transm Infect 2009; 85 Suppl 1:i3–i11 [DOI] [PMC free article] [PubMed] [Google Scholar]
- 37.Barnighausen T, Bor J, Wandira-Kazibwe S, Canning D. Correcting HIV prevalence estimates for survey nonparticipation using Heckman-type selection models. Epidemiology 2011; 22:27–35 [DOI] [PubMed] [Google Scholar]
- 38.Hogan DR, Salomon JA, Canning D, Hammitt JK, Zaslavsky AM, Barnighausen T. National HIV prevalence estimates for sub-Saharan Africa: controlling selection bias with Heckman-type selection models. Sex Transm Infect 2012; 88 Suppl 2:i17–i23 [DOI] [PMC free article] [PubMed] [Google Scholar]
- 39.Reniers G, Eaton J. Refusal bias in HIV prevalence estimates from nationally representative seroprevalence surveys. AIDS 2009; 23:621–629 [DOI] [PMC free article] [PubMed] [Google Scholar]
- 40.Floyd S, Molesworth A, Dube A, Crampin AC, Houben R, Chihana M, et al. Underestimation of HIV prevalence in surveys when some people already know their status, and ways to reduce the bias. AIDS 2013; 27:233–242 [DOI] [PubMed] [Google Scholar]
- 41.Barnighausen T, Bor J, Wandira-Kazibwe S, Canning D. Interviewer identity as exclusion restriction in epidemiology. Epidemiology 2011; 22:446. [DOI] [PMC free article] [PubMed] [Google Scholar]
- 42.Collins LM, Schafer JL, Kam CM. A comparison of inclusive and restrictive strategies in modern missing data procedures. Psychol Methods 2001; 6:330–351 [PubMed] [Google Scholar]
- 43.Harel O, Zhou XH. Multiple imputation: review of theory, implementation and software. Stat Med 2007; 26:3057–3077 [DOI] [PubMed] [Google Scholar]
Associated Data
This section collects any data citations, data availability statements, or supplementary materials included in this article.