

Abstract
Objective
To identify plasma-based biomarkers for Parkinson's Disease (PD) risk.
Methods
In a discovery cohort of 152 PD patients, plasma levels of 96 proteins were measured by multiplex immunoassay; proteins associated with age at PD onset were identified by linear regression. Findings from discovery screening were then assessed in a second cohort of 187 PD patients, using a different technique. Finally, in a third cohort of at-risk, asymptomatic individuals enrolled in the Parkinson's Associated Risk Study (PARS, n=134), plasma levels of the top candidate biomarker were measured, and dopamine transporter (DAT) imaging performed, to evaluate the association of plasma protein levels with dopaminergic system integrity.
Results
One of the best candidate protein biomarkers to emerge from discovery screening was apolipoprotein A1 (ApoA1, p=0.001). Low levels of ApoA1 correlated with earlier PD onset, with a 26% decrease in risk of developing PD associated with each tertile increase in ApoA1 (Cox proportional hazards p<0.001, hazard ratio=0.742). The association between plasma ApoA1 levels and age at PD onset replicated in an independent cohort of PD patients (p<0.001). Finally, in the PARS cohort of high-risk, asymptomatic subjects, lower plasma levels of ApoA1 were associated with greater putaminal DAT deficit (p=0.037).
Interpretation
Lower ApoA1 levels correlate with dopaminergic system vulnerability in symptomatic PD patients and in asymptomatic individuals with physiological reductions in dopamine transporter density consistent with prodromal PD. Plasma ApoA1 may be a new biomarker for PD risk.
INTRODUCTION
Parkinson’s Disease (PD) is a progressive neurodegenerative disorder, characterized by loss of dopaminergic neurons in the substantia nigra. Although the median age at onset is 60 years old,1 30–50% loss of substantia nigra dopaminergic neurons may occur before the clinical diagnosis of PD.2 Thus, there may be a window for intervention to slow or halt disease progression, after the onset of pathophysiology, but prior to the development of manifest clinical disease, if high-risk individuals could be identified.
In this context, an easily assayed biomarker indicative of risk for development of clinical PD would be valuable. For example, in the neurodegenerative dementia Alzheimer's disease (AD), the last 10 years have seen the advent of potential biochemical biomarkers for pre-symptomatic AD, as well as genetic markers indicating increased risk of AD. Specifically, cerebrospinal fluid (CSF) levels of amyloid-beta and tau are possible indicators of pre-symptomatic AD pathology; these markers have been used to risk-stratify individuals with mild cognitive impairment without a diagnosis of AD into higher-risk and lower-risk categories for conversion to frank AD.3 In addition, apolipoprotein E (APOE) genotype is a robust genetic marker correlated with risk of developing AD.4
While these examples illustrate the potential for a biomarker of PD risk, relatively few biomarkers for PD have been identified.5,6,7 Among biochemical biomarkers, CSF alpha-synuclein levels8 and CSF DJ-1 levels9 may indicate risk for PD. Additionally, plasma urate levels reportedly correlate with rate of motor decline in PD.10 Moreover, plasma epidermal growth factor11 and CSF amyloid-beta12 are potential biomarkers for risk of cognitive decline in PD. Finally, a specific mRNA expression profile in peripheral blood has been reported to distinguish PD patients from control individuals.13 While promising, these existing PD biomarkers have yet to be robustly validated, and, with the possible exception of plasma urate, none appears to be particularly modifiable.
In the present study, we conducted an unbiased screen of 96 plasma proteins to find potential biomarkers of PD risk and identified plasma apolipoprotein A1 (ApoA1) as a new, and potentially modifiable, candidate biomarker.
METHODS
For additional details, please see Supplementary Methods
Subjects
The discovery cohort consisted of 152 PD patients from UPenn recruited and clinically characterized as previously described.11 The replication cohort consisted of 187 PD patients from the Pacific Northwest Udall Center (PANUC) recruited and clinically characterized as previously described.14 134 subjects from the asymptomatic PARS cohort15 at high risk for the development of PD formed the third study cohort.
Biomarker quantitation
Unbiased discovery cohort screening for 96 plasma proteins was performed by multiplex immunoassay by Rules-Based Medicine as previously described.11 Plasma ApoA1 levels were measured in the replication and PARS cohorts by ELISA (Abnova, Taiwan, Catalog #0462). For each cohort, ELISA runs were performed in one batch, on a single day, using a shared set of standards for relative quantitation. HDL levels were quantitated at the clinical diagnostic laboratory of the Hospital of the University of Pennsylvania.
DAT scans
Dopamine transporter imaging (DAT) imaging using [123 I] β-CIT SPECT was performed at a single imaging center (Institute for Neurodegenerative Disorders, New Haven, CT). Participants received an intravenous administration of up to 6 mCi [123 I] β-CIT, and SPECT acquisition was performed as previously detailed.15, 16 The primary imaging outcome was the percent of age-expected [123 I] β-CIT lowest putamen binding based on comparison to a previously acquired database of 99 healthy subjects.
Statistical analyses
Discovery and replication cohorts
Linear regressions evaluating the association of each candidate protein with PD age at onset were performed, with age and gender as covariates. Additional covariates (medications, UPDRS motor score) were evaluated as indicated in the text. In addition, subset analyses of the association between ApoA1 and age at PD onset were performed in the same manner on men or women only. Cox proportional hazards models were used to estimate the relative risk of developing PD for different levels of ApoA1.
PARS cohort
Mann-Whitney U-test was used to compare raw values of ApoA1 between groups. A multivariate linear model adjusting for gender and age at scan was used to evaluate the association between ApoA1 and % expected DAT putaminal binding as a continuous variable.
Two-tailed p-values are reported for analyses in the discovery cohort. One-tailed p-values are reported for the replication and PARS cohorts, since expected directionality is known.
RESULTS
Plasma levels of ApoA1 are correlated with age at PD onset
Plasma samples and clinical data were collected from a discovery cohort of 152 PD patients (Supplementary Table 1). In this cohort, 96 plasma proteins were quantified by multiplex immunoassay as previously described11 (Supplementary Table 2). Levels of these 96 proteins were tested for association with age at onset in PD using a linear model adjusted for age at the time of plasma draw and gender.
Eleven proteins showed nominally significant (p<0.05) correlations between plasma levels and age at PD onset (Table 1), with Macrophage inflammatory protein-1β (MIP-1 beta, p<0.001) and ApoA1 (p = 0.001) showing the most significant associations. Lower levels of MIP-1 beta were associated with older age at PD onset, while higher ApoA1 levels were associated with older age at PD onset.
Table 1. Plasma levels of 11 proteins associate with PD age at onset.
11 out of 96 proteins screened showed nominal correlations between plasma levels and PD age at onset (nominal p< 0.05) in linear regression models with age (at time of plasma draw) and gender as covariates. The direction of association for each protein is shown, as well as the significance of association (p-value) for the specific analyte. MIP-1 beta = Macrophage inflammatory protein 1 beta. IL18 = Interleukin 18. CRP= C-reactive protein. CgA = Chromogranin A. MMP9=matrix metalloproteinase 9. IgM=Immunoglobulin M.
| Plasma Protein | Direction | P-value | ||
|---|---|---|---|---|
| 1 | MIP1-Beta | − | <0.001 | *** |
| 2 | Apolipoprotein A1 | + | 0.001 | *** |
| 3 | IL18 | − | 0.002 | ** |
| 4 | CRP | − | 0.003 | ** |
| 5 | CgA | − | 0.016 | * |
| 6 | Prolactin | + | 0.020 | * |
| 7 | MMP9 | − | 0.028 | * |
| 8 | IgM | + | 0.038 | * |
| 9 | Complement3 | − | 0.042 | * |
| 10 | TenascinC | − | 0.042 | * |
| 11 | SerumAmyloidP | − | 0.047 | * |
ApoA1 is the main component of high density lipoprotein (HDL), and plays important roles in reverse cholesterol transport by facilitating the binding of HDL and lecithin cholesterol acyltransferase, which catalyzes the formation of cholesteryl esters. Low levels of HDL/ApoA1 are known to associate with increased incidence of heart disease and cardiovascular mortality,17 and recently, the use of ApoA1-modifying statin medications has been reported to decrease the risk of PD in a prospective cohort study.18 For these biological reasons, as well as a large effect size (coefficient = 11.215), we focused on ApoA1 as a potential biomarker correlating with age at PD onset.
To better determine the effect of ApoA1 levels on age at PD onset, we performed Cox proportional hazards survival analyses, adjusting for gender and age at plasma draw. Strikingly, for each tertile increase in ApoA1 levels, we observed a 26% decreased risk of developing PD in any one year (log rank p<0.001, hazard ratio = 0.742, 95% CI 0.606–0.909, Figure 1a and 1b). Omitting the adjustment for age at plasma draw and gender did not affect results (Supplementary Figure 1a).
Figure 1. Apolipoprotein A1 as a biomarker for age at PD onset.

(A) Low Apolipoprotein A1 levels are predictive of early age at PD onset in the discovery cohort. Survival curves of time to PD onset are shown here for the lowest tertile of Apolipoprotein A1 plasma levels (red line), middle tertile (yellow line) and highest tertile (green line), as measured by multiplex immunoassay. Outcomes for age at PD onset between the different tertiles were significantly different (p<0.001, hazard ratio 0.742, 95% CI 0.606–0.909), after adjustment for age at plasma draw and gender. (B) Number of individuals (N), Apolipoprotein A1 plasma values (median, full range in mg/mL) for each tertile are listed. (C) HDL levels (mg/dL) are shown on the y axis (HDL); ApoA1 levels (mg/mL) are shown on the x axis (Multiplex ApoA1). High density lipoprotein levels correlate well with immunoassay ApoA1 values, as reflected by an R2 of 0.79. (D) In contrast to HDL levels, total cholesterol levels do not correlate with ApoA1 levels. Total cholesterol levels (mg/dL) are shown on the y axis; ApoA1 levels (mg/mL) are shown on the x axis.
The association between plasma ApoA1 levels and age at PD onset is not affected by medications or degree of motoric impairment
We examined the effect of various possible confounders -- medications, degree of motoric impairment -- on the observed association between ApoA1 plasma levels and PD age at onset.
Including the levodopa equivalent daily dose (LEDD)19 in our model did not alter the association between ApoA1 plasma levels and age at PD onset (p=0.026, Table 2), although the LEDD showed a significant inverse correlation with age at onset.
Table 2. Additional variables do not affect the association between plasma Apolipoprotein A1 levels and age at PD onset.
Possible confounders were added independently as additional covariates into the linear model predicting age at PD onset from plasma Apolipoprotein A1, with plasma age and gender as the original covariates. Detailed medication data were available for 103 out of the 152 discovery cohort patients. UPDRS motor scores were available for 127 out of the 152 patients. The 8 significance of the association with PD age at onset (P value) is listed for both the added 9 covariate and for Apolipoprotein A1. In all cases, Apolipoprotein A1 remains significantly associated with age at PD onset.
| Added Covariate | # patients analyzed |
% on medication |
Covariate P value |
ApoA1 P value |
|---|---|---|---|---|
| Niacins/Fibrates | 103 | 8% | 0.284 | 0.007 |
| Statins | 103 | 12% | 0.419 | 0.008 |
| LEDD | 103 | 74% | <0.001 | 0.026 |
| UPDRS Motor Score | 127 | n/a | 0.353 | 0.003 |
| All Additional Covariates | 84 | n/a | n/a | 0.015 |
Several classes of medication are known to affect ApoA1 levels; these include niacins,20 fibrates,21 and statins,22 all of which can elevate ApoA1 levels. In this discovery cohort, use of any of these medications did not affect the relationship between ApoA1 and age at PD onset (p=0.007 for niacins/fibrates, and p=0.008 for statins, Table 2). Notably, however, very few of the patients were taking these medications (n=19/152), limiting our interpretation.
Finally, including a measure of PD motoric impairment (Unified Parkinson’s Disease Rating Scale III motor score23, or UPDRS-III) in our model also did not alter the association between ApoA1 plasma levels and age at PD onset (p=0.003, Table 2).
Plasma ApoA1 levels are correlated with HDL cholesterol levels and gender
ApoA1 is known to be the major component of HDL,24 which is readily measured by routine clinical testing. To evaluate the extent to which ApoA1 values are related to HDL values, we measured plasma levels of both ApoA1 and HDL in a subset of our cohort (n=17) for which we had multiple identical aliquots of plasma. As shown in Figure 1c, ApoA1 values were strongly correlated with HDL values, with an R2 value of 0.79 (p<0.001), whereas ApoA1 values were entirely unrelated to total cholesterol (p=0.979, Figure 1d).
ApoA1 levels are moderated by estrogen levels and have been shown to be higher in women than in men,25 a finding we corroborated in our discovery cohort (Supplementary Figure 2). While we adjusted for gender in the initial screen, we also investigated the relationship between ApoA1 levels and age at onset in gender-specific subgroups. We found significant associations between ApoA1 levels and age at PD onset in both subgroups (women, n=42, p=0.001; men, n=110, p=0.031).
Plasma ApoA1 levels were not significantly associated with age at plasma draw (p=0.157, Supplementary Figure 2).
Association between plasma ApoA1 levels and age at PD onset replicates in an independent cohort
We next replicated our analyses in an independent cohort of 187 PD patients recruited at a different clinical site, using a different technical platform -- enzyme-linked immunosorbent assay (ELISA) -- after verifying that the ELISA assay performed similarly to the multiplex immunoassay (Supplementary Figure 3).
Although the replication cohort differed significantly from the discovery cohort in several clinical measures (Supplementary Table 1), the correlation between age at PD onset and ApoA1 levels persisted (p<0.001), with the same directionality. In a Cox proportional hazards model survival analysis, adjusting for gender and age at plasma draw, higher ApoA1 levels were again associated with increased age at PD onset (log rank test p<0.001, HR 0.647 for each tertile increase in ApoA1, 95% CI 0.536–0.781, Figure 2a and 2b). Omitting the adjustment for age at plasma draw and gender did not affect results (Supplementary Figure 1b).
Figure 2. Association between plasma ApoA1 levels and age at PD onset replicates in an independent cohort.

(A) Survival curves of time to PD onset are shown here for the lowest tertile of Apolipoprotein A1 plasma levels (red line), middle tertile (yellow line) and highest tertile (green line), as measured by ELISA, in the replication cohort. Outcomes for age at PD onset between the different tertiles were significantly different (log rank p<0.001, hazard ratio 0.647, 95% CI 0.536–0.781), after adjustment for age at plasma draw and gender. (B) Number of individuals (N), Apolipoprotein A1 plasma values (median, full range in mg/mL) for each tertile are listed.
ApoA1 levels correlate with degree of dopaminergic deficit in an asymptomatic cohort at high risk of developing PD
The observed strong association between age at PD onset and plasma ApoA1 levels in both our discovery and replication cohorts, using two different methods for measuring ApoA1 levels, led us to hypothesize that ApoA1 levels might be protective against the loss of dopaminergic neurons, resulting in older age at disease onset. To examine this hypothesis, we turned to a cohort of asymptomatic individuals at high risk for developing PD.
The Parkinson's Associated Risk Study (PARS15) has identified ~150 asymptomatic individuals with hyposmia, some at high risk for developing PD, from an initial pool of >5000 individuals. PARS investigators used a sequential biomarker strategy consisting of olfactory testing followed by dopamine transporter imaging to define the high risk group.26 In these at-risk individuals, putaminal dopamine transporter (DAT) uptake27 determined by [123I] β-CIT SPECT has been used as a measure of dopamine transporter density, a proxy for striatal dopaminergic neuron terminal integrity.28
We measured plasma ApoA1 levels by ELISA in this at-risk cohort of PARS subjects (n=134), asking whether lower ApoA1 levels would correlate with increased risk of PD, and specifically with decreased putaminal [123I] β-CIT binding, in these asymptomatic individuals.
Individuals with normal DAT scans (n=84 with >80% expected uptake in the putamen compared to age-matched controls) showed a non-statistically significant trend towards higher ApoA1 plasma raw values compared with individuals with abnormal DAT scans (n=50 with ≤80% expected putaminal uptake compared to age-matched controls (Figure 3a)). Moreover, using the percent expected DAT uptake as a continuous variable, we observed a significant association between plasma ApoA1 levels and the degree of DAT uptake, with lower ApoA1 levels associated with more severe DAT deficit (p=0.015, Figure 3b). Adjusting for age at DAT scan and gender did not remove this significant association (p=0.037).
Figure 3. High plasma ApoA1 levels predict greater putaminal dopaminergic system integrity.

(A) Plasma ApoA1 levels in mg/mL (y axis) are shown for both abnormal putaminal DAT uptake (Low DAT = DAT uptake ≤80% expected for age) and normal putaminal DAT uptake (High DAT = DAT uptake >80% expected for age) groups. (B) Plasma ApoA1 levels in mg/mL are shown on the y axis; percent putaminal DAT uptake relative to age-matched healthy controls is shown on the x axis. Correlation between plasma ApoA1 levels and degree of putaminal DAT uptake was significant (p=0.015). Adjusting for age and gender did not affect this association (p=0.037). (C) Plasma ApoA1 levels in mg/mL (with means +/− SEM, y axis) are shown for normal individuals not at increased risk for PD (n=20), a subset of PD patients from the discovery cohort (n=10), a subset of PD patients from the replication cohort (n=15), and a subset of PARS cohort subjects (n=10). Discovery, replication, and PARS cohort subjects were age- and gender-matched to the normal control subjects, and individuals were drawn evenly from each tertile of ApoA1 values for each cohort. Normal vs. PD, p=0.098 by Mann-Whitney. Normal vs. Low DAT, p=0.036 by Mann-Whitney. Low DAT = DAT uptake ≤80% expected for age. High DAT = DAT uptake >80% expected for age.
We next sought to compare ApoA1 plasma levels in the PARS cohort with ApoA1 levels in PD and normal subjects not at risk for PD. To do this, we repeated ApoA1 measures in fresh aliquots of plasma from a new cohort of normal control individuals (n=20), a subset of previously-sampled PARS cohort subjects (n=10), as well as a subset of PD patients from the discovery (n=10) and replication cohorts (n=15). For each of these groups, we age- and gender-matched the subjects, and for the previously-sampled individuals in the PARS and PD cohorts, we selected equal numbers of individuals from each tertile of ApoA1. The ELISA used to measure ApoA1 is reliable for relative quantitation, rather than absolute quantitation, permitting the comparison of sample values within one run, but allowing less confidence between runs. We therefore performed these ApoA1 measures in a single day, with a single operator and single set of standards, to minimize run-to-run variability.
We found that normal individuals not at risk for PD had the highest levels of ApoA1, while PD subjects in the discovery and replication cohorts had lower levels (Figure 3c, p=0.098 for normal vs. PD). Intriguingly, PARS cohort subjects with low DAT uptake (DAT uptake ≤80%) had the lowest ApoA1 levels (p=0.036 vs. normal controls), while PARS cohort subjects with normal DAT uptake (DAT uptake >80%) had levels close to those of normal subjects.
Taken together, in asymptomatic individuals at risk for development of PD, lower levels of plasma ApoA1 are associated with relative loss of dopaminergic system integrity, while individuals with high dopaminergic system integrity have ApoA1 levels similar to those of normal controls not at risk for PD.
ApoA1 levels correlate with degree of motor impairment in PD
If ApoA1 levels correlate with degree of dopaminergic system integrity in asymptomatic individuals, ApoA1 levels might also correlate with degree of motor impairment in symptomatic PD. We therefore returned to our discovery and replication cohorts and examined the association of ApoA1 levels with degree of motor impairment (UPDRS-III scores) at the time of plasma draw. ApoA1 values were significant predictors of the UPDRS-III score (discovery cohort, p=0.003; replication cohort, p=0.004), with age and gender as covariates. Adding disease duration as a covariate weakened, but did not remove, this association (discovery cohort, p=0.009; replication cohort, p=0.031).
DISCUSSION
In the present study, we simultaneously measured plasma levels of 96 proteins and evaluated their association with age at PD onset in a discovery cohort of 152 PD patients. ApoA1 emerged as the most promising candidate biomarker from this analysis, with lower ApoA1 levels corresponding to earlier age at disease onset. Correlation between ApoA1 level and age at PD onset was subsequently confirmed in an independent cohort of 187 PD patients, demonstrating the robustness of this association. Finally, in the PARS cohort of 134 asymptomatic, at-risk individuals, some of whom may be in prodromal stages of PD, we found that lower ApoA1 levels predicted greater dopaminergic deficit, as measured by putaminal DAT binding. Taken together, our data suggest that higher ApoA1 levels correlate with greater dopaminergic system integrity in symptomatic and pre-symptomatic PD individuals, manifesting as an older age at onset in those who go on to develop clinical disease and as greater DAT density in those who have not yet developed clinically apparent disease.
Several interpretations of the observed associations in the PD and PARS subjects are possible. First, higher ApoA1 values may protect against dopaminergic neurodegeneration. Second, greater dopaminergic system integrity may raise ApoA1 levels in those who are relatively resilient to PD neurodegeneration. Third, an unrelated factor (neither dopaminergic neurons nor ApoA1) may affect both dopaminergic system integrity and plasma levels of ApoA1. In the first situation, ApoA1 may serve as a potentially modifiable risk factor for PD neurodegeneration. In the latter two situations, ApoA1 might serve to risk-stratify individuals for the development of clinical PD.
A consideration of the biology of ApoA1 is useful in assessing these various possibilities. ApoA1 is one of the two main components of HDL.29 ApoA1/HDL, high levels of which are possibly protective against atherosclerosis, has been studied extensively in the cardiovascular literature, and it is important to point out that ApoA1 and HDL levels can be altered. Non-pharmacological ApoA1/HDL-increasing measures include diet modification and exercise,30 which have been reported to have a protective effect in PD in epidemiological studies.31, 32 Pharmacological ApoA1/HDL-increasing measures include treatment with niacins, fibrates, and statins.33–35 Notably, statin use has recently been shown in a prospective epidemiological study to associate with decreased incidence of PD.18 These findings support the possibility that higher ApoA1 levels may protect against PD-associated neurodegeneration.
Notably, we found that plasma ApoA1 levels were correlated with the degree of motoric impairment in both our discovery and replication PD cohorts. Adjusting for the degree of motoric impairment, however, did not remove the association between ApoA1 levels and age at PD onset. These data, while preliminary, suggest that high ApoA1 levels may both protect against the development of PD and slow its motor progression in manifest PD (Figure 4).
Figure 4. Model of the relationship of plasma ApoA1 levels with age at PD onset, degree of motor impairment in PD, and dopaminergic system integrity.
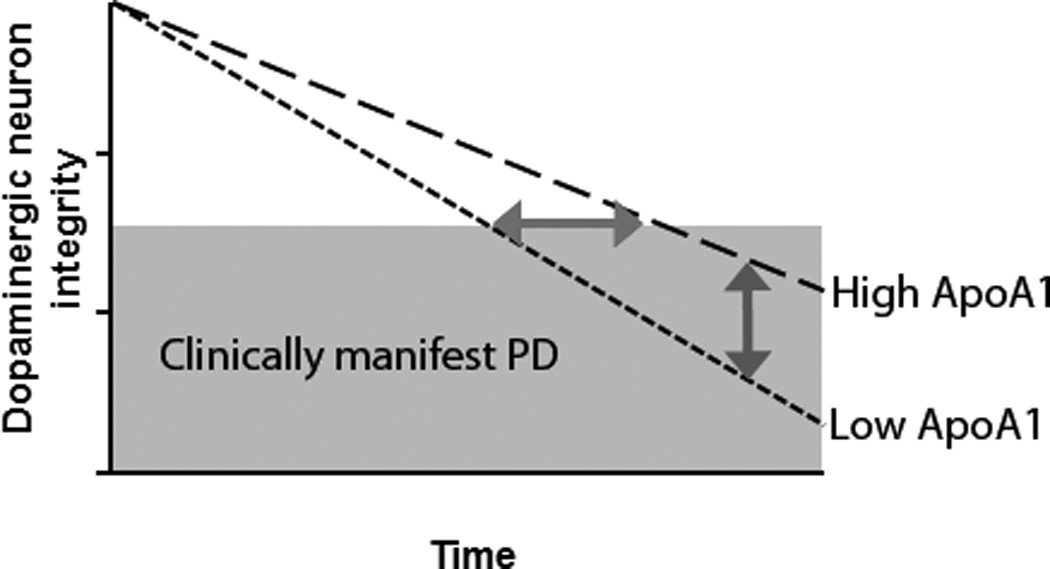
Our results are compatible with a hypothetical model in which high plasma ApoA1 levels influence the rate of dopaminergic neuron loss. The horizontal arrow indicates the difference in age at clinical PD onset for high- vs. low-ApoA1 groups. The vertical arrow indicates the difference in disease severity for high- vs. low-ApoA1 groups.
How might higher ApoA1/HDL levels protect against PD-associated neurodegeneration? While speculative, data regarding the relationship between ApoA1 and the anti-oxidative and anti-inflammatory enzyme paraoxonase 1 (PON1) suggest one potential mechanism. Specifically, higher ApoA1 plasma levels increase the activity of PON1.36 PON1, in turn, decreases the formation from low density lipoproteins to 27-hydroxycholesterol, an oxidized cholesterol metabolite that increases alpha-synuclein levels and causes apoptosis when applied to neuronal cell lines.37 PON1 activity levels have moreover been reported to be reduced in PD patients compared to controls,38 and genetic variants in the PON1 gene which may decrease the activity of the enzyme have been reported to associate with risk of PD in multiple studies.39,40,41 Thus, it is possible that higher ApoA1 levels are protective against the development of PD through PON1-related mechanisms.
We note here that the PARS cohort individuals are still clinically asymptomatic, although it is probable, and indeed expected, that some of them will develop clinical PD in the near future. We would predict based on the data presented here that the low-ApoA1, low-DAT uptake individuals would be more likely to convert to clinical PD than high-ApoA1, high-DAT uptake individuals. Thus, future follow-up of this at-risk cohort, as well as replication in other cohorts of patients, would be a valuable addition to the data presented here.
Finally, should ApoA1 levels prove to influence, rather than simply correlate with, risk of PD, the survival analyses in the present study suggest that increasing ApoA1 plasma levels by even small amounts (e.g. 0.1 mg/mL) might have a profound impact on decreasing the risk of developing PD. In a disease that already affects more than 1 million Americans, the potential benefits of such a measure are significant.
Supplementary Material
Acknowledgments
ACKNOWLEDGEMENTS AND FUNDING
The biomarker data in this project were obtained through a partnership grant between the University of Pennsylvania and Pfizer (Penn Pfizer Alliance). The clinical data in this project were collected through the support of the University of Pennsylvania and University of Washington Morris K. Udall Parkinson's Disease Research Center of Excellence grants from the NINDS (P50 NS053488 and P50 NS062684). Alice Chen-Plotkin is also supported by the NIH (AG-033101, U01NS082134), the Burroughs Wellcome Fund Career Award for Medical Scientists, a Doris Duke Clinician Scientist Development Award, and the Benaroya Fund. Cyrus Zabetian is supported by the NIH (R01 NS065070) and the Department of Veterans Affairs (Merit Award 1I01BX000531). We thank Travis Unger, Young Baek, and Emily Bill for technical and data management assistance. We thank our patients, their families, and the PARS cohort for their participation in this research.
References
- 1.Inzelberg R, Schechtman E, Paleacu D. Onset age of Parkinson disease. Am J Med Genet. 2002;111(4):459–460. doi: 10.1002/ajmg.10586. author reply 461. [DOI] [PubMed] [Google Scholar]
- 2.Fearnley JM, Lees AJ. Ageing and Parkinson's disease: Substantia nigra regional selectivity. Brain. 1991;114(Pt 5):2283–2301. doi: 10.1093/brain/114.5.2283. (Pt 5) [DOI] [PubMed] [Google Scholar]
- 3.Shaw LM, Vanderstichele H, Knapik-Czajka M, et al. Cerebrospinal fluid biomarker signature in Alzheimer's disease neuroimaging initiative subjects. Ann Neurol. 2009;65(4):403–413. doi: 10.1002/ana.21610. [DOI] [PMC free article] [PubMed] [Google Scholar]
- 4.Payami H, Kaye J, Heston LL, et al. Apolipoprotein E genotype and Alzheimer's disease. Lancet. 1993;342(8873):738. [PubMed] [Google Scholar]
- 5.Parkinson Progression Marker Initiative. The Parkinson Progression Marker Initiative (PPMI) Prog Neurobiol. 2011;95(4):629–635. doi: 10.1016/j.pneurobio.2011.09.005. [DOI] [PMC free article] [PubMed] [Google Scholar]
- 6.Wu Y, Le W, Jankovic J. Preclinical biomarkers of Parkinson disease. Arch Neurol. 2011;68(1):22–307. doi: 10.1001/archneurol.2010.321. [DOI] [PubMed] [Google Scholar]
- 7.Leverenz JB, Quinn JF, Zabetian C, et al. Cognitive impairment and dementia in patients with Parkinson disease. Curr Top Med Chem. 2009;9(10):903–912. [PMC free article] [PubMed] [Google Scholar]
- 8.Mollenhauer B, Locascio JJ, Schulz-Schaeffer W, et al. Alpha-synuclein and tau concentrations in cerebrospinal fluid of patients presenting with parkinsonism: A cohort study. Lancet Neurol. 2011;10(3):230–240. doi: 10.1016/S1474-4422(11)70014-X. [DOI] [PubMed] [Google Scholar]
- 9.Hong Z, Shi M, Chung KA, et al. DJ-1 and alpha-synuclein in human cerebrospinal fluid as biomarkers of Parkinson's disease. Brain. 2010;133(Pt 3):713–726. doi: 10.1093/brain/awq008. [DOI] [PMC free article] [PubMed] [Google Scholar]
- 10.Weisskopf MG, O'Reilly E, Chen H, et al. Plasma urate and risk of Parkinson's disease. Am J Epidemiol. 2007;166(5):561–567. doi: 10.1093/aje/kwm127. [DOI] [PMC free article] [PubMed] [Google Scholar]
- 11.Chen-Plotkin AS, Hu WT, Siderowf A, et al. Plasma epidermal growth factor levels predict cognitive decline in Parkinson disease. Ann Neurol. 2011;69(4):655–663. doi: 10.1002/ana.22271. [DOI] [PMC free article] [PubMed] [Google Scholar]
- 12.Siderowf A, Xie SX, Hurtig H, et al. CSF amyloid {beta} 1-42 predicts cognitive decline in Parkinson disease. Neurology. 2010;75(12):1055–1061. doi: 10.1212/WNL.0b013e3181f39a78. [DOI] [PMC free article] [PubMed] [Google Scholar]
- 13.Scherzer CR, Eklund AC, Morse LJ, et al. Molecular markers of early Parkinson's disease based on gene expression in blood. Proc Natl Acad Sci U S A. 2007;104(3):955–960. doi: 10.1073/pnas.0610204104. [DOI] [PMC free article] [PubMed] [Google Scholar]
- 14.Leverenz JB, Watson GS, Shofer J, et al. Cerebrospinal fluid biomarkers and cognitive performance in non-demented patients with Parkinson's disease. Parkinsonism Relat Disord. 2011;17(1):61–6415. doi: 10.1016/j.parkreldis.2010.10.003. [DOI] [PMC free article] [PubMed] [Google Scholar]
- 15.Siderowf A, Jennings D, Eberly S, et al. Impaired olfaction and other prodromal features in the Parkinson at-risk syndrome study. Mov Disord. 2012;27(3):406–412. doi: 10.1002/mds.24892. [DOI] [PMC free article] [PubMed] [Google Scholar]
- 16.Seibyl J, Marek K, Sheff K, et al. Iodine-123-beta-CIT and iodine-123-FPCIT SPECT measurement of dopamine transporters in healthy subjects and Parkinson's patients. J Nucl Med. 1998;39(9):1500–1508. [PubMed] [Google Scholar]
- 17.Pekkanen J, Linn S, Heiss G, et al. Ten-year mortality from cardiovascular disease in relation to cholesterol level among men with and without preexisting cardiovascular disease. N Engl J Med. 1990;322(24):1700–1707. doi: 10.1056/NEJM199006143222403. [DOI] [PubMed] [Google Scholar]
- 18.Gao X, Simon KC, Schwarzschild MA, Ascherio A. Prospective study of statin use and risk of Parkinson disease. Arch Neurol. 2012;69(3):380–384. doi: 10.1001/archneurol.2011.1060. [DOI] [PMC free article] [PubMed] [Google Scholar]
- 19.Hobson DE, Lang AE, Martin WR, et al. Excessive daytime sleepiness and sudden-onset sleep in Parkinson disease: A survey by the canadian movement disorders group. JAMA. 2002;287(4):455–463. doi: 10.1001/jama.287.4.455. [DOI] [PubMed] [Google Scholar]
- 20.Jin FY, Kamanna VS, Kashyap ML. Niacin decreases removal of high-density lipoprotein apolipoprotein A-I but not cholesterol ester by hep G2 cells. implication for reverse cholesterol transport. Arterioscler Thromb Vasc Biol. 1997;17(10):2020–2028. doi: 10.1161/01.atv.17.10.2020. [DOI] [PubMed] [Google Scholar]
- 21.Vu-Dac N, Chopin-Delannoy S, Gervois P, et al. The nuclear receptors peroxisome proliferator-activated receptor alpha and rev-erbalpha mediate the species-specific regulation of apolipoprotein A-I expression by fibrates. J Biol Chem. 1998;273(40):25713–25720. doi: 10.1074/jbc.273.40.25713. [DOI] [PubMed] [Google Scholar]
- 22.Schaefer JR, Schweer H, Ikewaki K, et al. Metabolic basis of high density lipoproteins and apolipoprotein A-I increase by HMG-CoA reductase inhibition in healthy subjects and a patient with coronary artery disease. Atherosclerosis. 1999;144(1):177–184. doi: 10.1016/s0021-9150(99)00053-2. [DOI] [PubMed] [Google Scholar]
- 23.Goetz CG, Fahn S, Martinez-Martin P, et al. Movement disorder society-sponsored revision of the Unified Parkinson's Disease Rating Scale (MDS-UPDRS): Process, format, and clinimetric testing plan. Mov Disord. 2007;22(1):41–47. doi: 10.1002/mds.21198. [DOI] [PubMed] [Google Scholar]
- 24.Gotto AM, Jr, Pownall HJ, Havel RJ. Introduction to the plasma lipoproteins. Methods Enzymol. 1986;128:3–41. doi: 10.1016/0076-6879(86)28061-1. [DOI] [PubMed] [Google Scholar]
- 25.Jungner I, Marcovina SM, Walldius G, et al. Apolipoprotein B and A-I values in 147576 Swedish males and females, standardized according to the World Health Organization-International Federation of Clinical Chemistry First International Reference Materials. Clin Chem. 1998;44(8 Pt 1):1641–1649. [PubMed] [Google Scholar]
- 26.Ross GW, Petrovitch H, Abbott RD, et al. Association of olfactory dysfunction with risk for future Parkinson's disease. Ann Neurol. 2008;63(2):167–173. doi: 10.1002/ana.21291. [DOI] [PubMed] [Google Scholar]
- 27.Brooks DJ. Imaging end points for monitoring neuroprotection in Parkinson's disease. Ann Neurol. 2003;53(Suppl 3):S110–S118. doi: 10.1002/ana.10480. discussion S118-9. [DOI] [PubMed] [Google Scholar]
- 28.Pate BD, Kawamata T, Yamada T, et al. Correlation of striatal fluorodopa uptake in the MPTP monkey with dopaminergic indices. Ann Neurol. 1993;34(3):331–338. doi: 10.1002/ana.410340306. [DOI] [PubMed] [Google Scholar]
- 29.Stampfer MJ, Sacks FM, Salvini S, et al. A prospective study of cholesterol, apolipoproteins, and the risk of myocardial infarction. N Engl J Med. 1991;325(6):373–381. doi: 10.1056/NEJM199108083250601. [DOI] [PubMed] [Google Scholar]
- 30.Bhatt KN, Wells BJ, Sperling LS, Baer JT. High-density lipoprotein therapy: Is there hope? Curr Treat Options Cardiovasc Med. 2010;12(4):315–328. doi: 10.1007/s11936-010-0081-x. [DOI] [PubMed] [Google Scholar]
- 31.Xu Q, Park Y, Huang X, et al. Physical activities and future risk of Parkinson disease. Neurology. 2010;75(4):341–348. doi: 10.1212/WNL.0b013e3181ea1597. [DOI] [PMC free article] [PubMed] [Google Scholar]
- 32.Chen H, Zhang SM, Schwarzschild MA, et al. Physical activity and the risk of Parkinson disease. Neurology. 2005;64(4):664–669. doi: 10.1212/01.WNL.0000151960.28687.93. [DOI] [PubMed] [Google Scholar]
- 33.Joy T, Hegele RA. Is raising HDL a futile strategy for atheroprotection? Nat Rev Drug Discov. 2008;7(2):143–155. doi: 10.1038/nrd2489. [DOI] [PubMed] [Google Scholar]
- 34.Teramoto T. Pitavastatin: Clinical effects from the LIVES study. Atheroscler Suppl. 2011;12(3):285–288. doi: 10.1016/S1567-5688(11)70888-1. [DOI] [PubMed] [Google Scholar]
- 35.Barter P. HDL-C: Role as a risk modifier. Atheroscler Suppl. 2011;12(3):267–270. doi: 10.1016/S1567-5688(11)70885-6. [DOI] [PubMed] [Google Scholar]
- 36.Abbott CA, Mackness MI, Kumar S, et al. Serum paraoxonase activity, concentration, and phenotype distribution in diabetes mellitus and its relationship to serum lipids and lipoproteins. Arterioscler Thromb Vasc Biol. 1995;15(11):1812–1818. doi: 10.1161/01.atv.15.11.1812. [DOI] [PubMed] [Google Scholar]
- 37.Rantham Prabhakara JP, Feist G, Thomasson S, et al. Differential effects of 24-hydroxycholesterol and 27-hydroxycholesterol on tyrosine hydroxylase and alpha-synuclein in human neuroblastoma SH-SY5Y cells. J Neurochem. 2008;107(6):1722–1729. doi: 10.1111/j.1471-4159.2008.05736.x. [DOI] [PubMed] [Google Scholar]
- 38.Ikeda K, Nakamura Y, Kiyozuka T, et al. Serological profiles of urate, paraoxonase-1, ferritin and lipid in Parkinson's disease: Changes linked to disease progression. Neurodegener Dis. 2011;8(4):252–258. doi: 10.1159/000323265. [DOI] [PubMed] [Google Scholar]
- 39.Kondo I, Yamamoto M. Genetic polymorphism of paraoxonase 1 (PON1) and susceptibility to Parkinson's disease. Brain Res. 1998;806(2):271–273. doi: 10.1016/s0006-8993(98)00586-1. [DOI] [PubMed] [Google Scholar]
- 40.Zintzaras E, Hadjigeorgiou GM. Association of paraoxonase 1 gene polymorphisms with risk of Parkinson's disease: A meta-analysis. J Hum Genet. 2004;49(9):474–481. doi: 10.1007/s10038-004-0176-x. [DOI] [PubMed] [Google Scholar]
- 41.Manthripragada AD, Costello S, Cockburn MG, et al. Paraoxonase 1, agricultural organophosphate exposure, and Parkinson disease. Epidemiology. 2010;21(1):87–94. doi: 10.1097/EDE.0b013e3181c15ec6. [DOI] [PMC free article] [PubMed] [Google Scholar]
Associated Data
This section collects any data citations, data availability statements, or supplementary materials included in this article.