

Abstract
Objective
We have previously shown that 24 young lean men (12 pairs of identical twins) subjected to a standardized 353 MJ (84 000 kcal) overfeeding protocol over 100 days exhibited individual differences in body weight and composition gains. The mean (+SD) gains in fat mass (FM) and fat-free mass (FFM) were 5.4+1.9 kg and 2.7+1.5 kg for a total body energy (BE) gain of 221+75 MJ representing 63% of the energy surplus consumed. We report here on the most important baseline correlates of these overfeeding-induced changes with the aim of identifying biomarkers of the response.
Results
Baseline maximal oxygen uptake per kilogram body mass was negatively correlated with gains in weight, FM, and BE (all p<0.05). Enzyme activities indicative of skeletal muscle oxidative potential correlated with gains in FM and BE (all p<0.05). Baseline TSH levels in response to a TRH stimulation correlated positively with changes in FM-to-FFM ratio (p<0.05). Plasma concentrations of androstenediol-sulfate, dehydroepiandrosterone, and 17-hydroxy pregnenolone were negatively correlated with gains in FM and BE (0.01<p<0.05), while level of estrone was negatively and androsterone-glucoronide was positively correlated with FFM gains (p<0.05). Baseline leptin and abdominal fat cell size correlated positively with gains in weight, FM, and BE (p<0.05). When compared to the six highest BE gainers, the six lowest gainers exhibited higher thermic effect of a meal (TEM) and plasma levels of total testosterone, cortisol, estradiol, androstenedione, and androstenediol-sulfate (all p<0.05). High baseline levels of total TEM, testosterone, and androstenediol-sulfate were associated with lower FM gains whereas high baseline levels of FT4 and estrone were found in low-FFM gainers.
Conclusion
Although none of the variables exerted individually an overwhelmingly strong influence on overfeeding-induced changes, baseline FFM, maximal oxygen uptake, muscle oxidative capacity, androgens, and leptin levels were the most consistent significant biomarkers of the responsiveness to chronic overfeeding.
Keywords: obesity, positive energy balance, biomarkers, long-term overfeeding
INTRODUCTION
We have previously reported that there are individual differences in body mass gain when young adults of normal body weight are subjected to a standardized overfeeding protocol1, a finding which has been subsequently well replicated2–4. In our own experiment, 24 young lean adult males were exposed to a 353 MJ (84 000 kcal) overfeeding protocol over a period of 100 days while being confined to a sedentary lifestyle1. The average weight gain was 8.1 kg with a standard deviation of 2.4 kg. The average gain in fat mass (FM) was 5.4 kg while that in fat-free mass (FFM) reached 2.7 kg. Assuming that the energy content of FM is about 38.9 MJ (9 300 kcal) per kilogram and that of FFM is 4.3 MJ (1 020 kcal) per kilogram, then a total of 222 MJ was recovered on average as body mass changes, representing about 63 percent of the excess energy intake. The FM-to-FFM ratio increased from 0.13 to 0.22 (p<0.001) reflecting the fact that on average approximately 2 kg of adipose tissue were accrued for each kilogram of lean mass.
The gains in FM relative to those in FFM can be seen as an indicator of variation in energy partitioning. Thus, while the average change in the FM-to-FFM ratio was 2:1 in the 100-day overfeeding experiment1, 5, a ratio close to what has been reported before6, there was considerable heterogeneity in the amount of fat accrued relative to lean mass. Importantly, variations in the FM-to-FFM gains were correlated with the gains in body mass, the coefficient reaching 0.61 (p<0.01)1, 5. Those who gained more FM relative to FFM were the high-body-mass gainers while those gaining relatively more FFM were the low gainers.
Human heterogeneity in the response to the much described “obesogenic environment” created by affluent societies represents a critical aspect of the obesity epidemic; this environment is often the focus of observational studies but has not been thoroughly investigated experimentally. While the overfeeding protocol conducted with the collaboration of identical twins was focused primarily on testing the hypothesis that there was a genotype-overfeeding interaction effect in the response to the caloric surplus, we are in the present paper taking advantage of the extensive panel of pre-overfeeding traits to investigate the most parsimonious predictors of the gains in body mass, FM, FFM, and total body energy (BE), with a particular focus on the partitioning of the energy gains between adipose and lean tissues. The identification of biomarkers of body composition changes in response to chronic overfeeding may allow for the early detection of individuals at risk for excess body-weight and FM gains. These new analyses have the potential to generate new hypotheses about the causes of human heterogeneity in the response to chronic overfeeding.
METHODS
Subjects
Twenty-four sedentary young men gave their written consent to participate in this study, which was approved by the Laval University Medical Ethics Committee and the Office for Protection from Research Risks of the National Institutes of Health, Bethesda, MD. These subjects were members of 12 pairs of identical twins, aged 21±2 years (mean and SD). Their origin, medical status, and morphological and lifestyle characteristics were described in an earlier publication1.
Experimental protocol
The subjects were studied eight at a time (four pairs of twins) over a period of 18 months. Subjects were housed in a closed section of a dormitory on the campus of Laval University under 24-hour supervision. Each subject stayed in the unit for 120 days, which included a 14-day baseline observation period, a 3-day pre-overfeeding testing period, a 100-day experimental overfeeding treatment, and a 3-day post-overfeeding testing period.
The energy cost of weight maintenance was estimated during the 14-day baseline period. Subjects were instructed to eat normally from foods prepared for them and monitored for energy and macronutrient content by dietitians. Body weight was measured daily, and body density measurements were obtained on three occasions from a series of underwater weighing tests. Subjects were kept sedentary except for a supervised 30-min daily walk.
During the overfeeding period, subjects were overfed by 4.2 MJ (1 000 kcal) per day over the estimated energy cost of weight maintenance, 6 days a week, for a period of 100 days. On the 7th day, energy intake was rolled back to the pre-overfeeding energy cost of weight maintenance level. The subjects were thus overfed during 84 of the 100 days, for a total excess energy intake of 353 MJ (84 000 kcal). The contribution of each macronutrient to energy intake was standardized on a 24-hour basis as follows: 15 percent from protein, 35 percent from lipid, and 50 percent from carbohydrate. The subjects were instructed to refrain from exercising for the 4 months of the study. They were under constant supervision, and their program of activities included reading, playing video games, playing cards, TV, music, and other activities with low energy costs. They took a supervised 30-min daily walk during the whole overfeeding period.
Measurements and methods used in the study, as well as all assays performed before and after the overfeeding protocol, are described in Supplementary Material.
Statistical analysis
For the purpose of this hypothesis-generating paper, the 24 individuals exposed to the overfeeding protocol are considered as independent subjects even though they were members of 12 pairs of identical twins. The normality of the distributions of the baseline variables and the response scores was verified with little evidence of distribution kurtosis or skewness. The analyses were thus undertaken on untransformed scores. The relationships between the overfeeding-induced changes in body mass, FM, FFM, and total BE with the pre-overfeeding values of each biological variable considered in this paper were quantified by Pearson product moment correlations. The hormonal and metabolic profiles (mean values) of the highest (N=6) and lowest (N=6) gainers with overfeeding were compared by t-test procedures. In all cases, the minimum p level for statistical significance was set at 0.05.
RESULTS
As reported previously1, the 100-day overfeeding protocol caused significant increases (p<0.0001) in body mass, FM, FFM, and total BE (Supplementary Table 1). The average weight gain was 8.1 kg, with a range of 4.3 to 13.3 kg. The FM-to-FFM ratio increased from 0.13 to 0.22 (p<0.0001), indicating that the gains in adipose tissue were substantially greater than the gains in lean mass.
Pre-overfeeding levels of body weight, FM, FFM, BE, and daily caloric intake were not correlated with overfeeding-induced changes with one exception: FFM was negatively correlated with the changes in the FM-to-FFM ratio (r=−0.41; p=0.05). Interestingly, baseline (weight maintenance) energy intake was not correlated with any of the changes caused by overfeeding (Table 1).
TABLE 1.
Correlations Between Baseline Levels with Changes in Body Mass, Body Composition, and Body Energy
| CHANGES WITH OVERFEEDING | |||||
|---|---|---|---|---|---|
| PRE-OVERFEEDING | Body weight | FM | FFM | FM/FFM | BE |
| Body weight (kg) | −0.04 | 0.05 | −0.13 | −0.27 | 0.04 |
| FM (kg) | 0.07 | 0.29 | −0.26 | 0.15 | 0.27 |
| FFM (kg) | −0.09 | −0.10 | −0.02 | −0.41* | −0.10 |
| FM/FFM (kg/kg) | 0.11 | 0.32 | −0.24 | 0.24 | 0.30 |
| Baseline energy intake (MJ) | 0.33 | 0.22 | 0.24 | −0.02 | 0.24 |
p<0.05;
p<0.001
Abbreviations: BE = body energy; FFM = fat-free mass; FM = fat mass
Resting metabolic rate (RMR) and thermic effect of a meal (TEM) were not correlated with the overfeeding-induced changes in body weight, FM, FFM, or BE (Supplementary Table S2). The only exception was a correlation of −0.45 (p=0.05) between baseline TEM over 4 hours and the gains in the FM-to-FFM ratio. There was no correlation between RQ during the RMR measurement and at various time points of the TEM test with the overfeeding-induced gains in body weight, FM, FFM, or BE.
VO2max per kilogram of body weight was negatively correlated with the gains in body weight, FM, and BE, with coefficients ranging from −0.41 to −0.49, all p<0.05 (Table 2). Moreover, the overfeeding-induced changes in FM relative to those in FFM were negatively related to baseline VO2max per kilogram of body weight (r=−0.43; p<0.05). Baseline maximal O2 pulse, a surrogate for maximal stroke volume, was not associated with the changes in body weight or body composition. However, interestingly, VO2max, VO2max per kilogram, and max O2 pulse were all negatively and significantly correlated with the overfeeding-induced changes in the FM-to-FFM ratio (r≥−0.43, all p<0.05). The proportion of type I fibers in the vastus lateralis muscle was not correlated with the gains in body weight, FM, or BE, although there was a strong trend for a negative relationship with coefficients of about −0.40 for the gains in FM and BE. Creatine kinase and PFK muscle enzyme activities were not correlated with the gains in body weight, FM, FFM, or BE. The oxidative potential of the skeletal muscle, as assessed from the maximal activity of OGDH in a muscle homogenate, was negatively correlated with the gains in FM and BE, as well as in the FM–to-FFM ratio, with correlations ranging from −0.42 to −0.48; p<0.05. Interestingly, the pre-overfeeding ratio of PFK to OGDH muscle enzyme activities, a crude indicator of glycolytic relative to oxidative potential, was positively and significantly correlated with the gains in FM relative to those in FFM (r=0.63; p<0.001) and with the gains in FM and BE (r=0.46; p<0.05).
TABLE 2.
Correlations Between Changes In Body Mass, Body Composition, and Body Energy Indicators with Baseline Cardiorespiratory Fitness and Skeletal Muscle Characteristics
| CHANGES WITH OVERFEEDING | |||||
|---|---|---|---|---|---|
| PRE-OVERFEEDING | Body weight | FM | FFM | FM/FFM | BE |
| Max VO2 (L O2) | −0.29 | −0.25 | −0.14 | −0.46* | −0.26 |
| Max VO2/kg | −0.41* | −0.49* | −0.02 | −0.43* | −0.49* |
| Max O2 pulse (ml O2/beat) | −0.22 | −0.23 | −0.05 | −0.46* | −0.24 |
| % type I fiber | −0.21 | −0.40 | 0.18 | −0.39 | −0.39 |
| Creatine kinase activity (U/g wet wt) | −0.20 | −0.22 | −0.02 | −0.31 | −0.23 |
| PFK activity (U/g wet wt) | −0.18 | −0.05 | −0.22 | −0.04 | −0.07 |
| OGDH activity (U/g wet wt) | −0.38 | −0.42* | −0.06 | −0.48* | −0.42* |
| PFK/OGDH | 0.32 | 0.46* | −0.09 | 0.63** | 0.46* |
p<0.05;
p<0.001
BE = body energy; FFM = fat-free mass; FM = fat mass; OGDH = oxoglutarate dehydrogenase; PFK = phosphofructokinase
The pre-overfeeding plasma levels of thyroid hormones and TSH levels in the basal state and after a TRH challenge were not correlated with gains in body weight, FM, FFM, or BE (Supplementary Table S3). However, the TSH levels at 30 min and 45 min post-TRH stimulation were positively correlated with the FM-to-FFM ratio response to overfeeding, the coefficients ranging from 0.41 to 0.43 (p<0.05) (Supplementary Table S3).
Baseline fasting levels of leptin were positively associated with the gains in body weight, FM, and BE (Table 3). In contrast, there were no correlations between the pre-overfeeding levels of plasma IGF-1, hGH, adiponectin, or ghrelin with the gains in body weight or BE or the changes in body composition.
TABLE 3.
Correlations Between Changes in Body Mass, Body Composition, and Body Energy with Baseline Plasma Hormone Levels
| CHANGES WITH OVERFEEDING | |||||
|---|---|---|---|---|---|
| PRE-OVERFEEDING | Body weight | FM | FFM | FM/FFM | BE |
| hGH (ng/mL) | 0.11 | 0.18 | −0.05 | 0.19 | 0.18 |
| IGF-1(ng/mL) | 0.14 | 0.09 | 0.11 | 0.01 | 0.10 |
| Leptin (ng/ml) | 0.45* | 0.43* | 0.15 | 0.20 | 0.45* |
| Adiponectin (μg/mL) | 0.00 | 0.16 | −0.21 | 0.16 | 0.15 |
| Ghrelin (pg/mL) | 0.06 | −0.21 | 0.36 | −0.18 | −0.18 |
p<0.05;
p<0.01
BE = body energy; FFM = fat-free mass; FM = fat mass; hGH = human growth hormone; IGF-1 = insulin-like growth factor 1
There was no significant relationship between the pre-overfeeding plasma levels of fasting glucose (not shown), insulin, and glucose or between the insulin response to a glucose load with the overfeeding-induced changes in body weight, FM, FFM or BE (Supplementary Table S4). Likewise, no association could be found between baseline resting plasma Epi and Norepi or their values at maximal exercise and the gains in body weight, FM, or BE, with the exception of baseline resting Norepi and the gains in FFM (r=−0.41; p<0.05).
As shown in Supplementary Table S5, the pre-overfeeding lipolysis and LPL profile of the abdominal adipose depot was not associated with the overfeeding gains in body weight, FM, FFM, or BE. However, baseline abdominal fat cell weight was positively correlated with the gains in FM and BE (both r=0.42; p<0.05). No relationship was observed between femoral fat cell weight and overfeeding-induced gains in body weight, FM, FFM, or BE.
The relationships between baseline plasma steroid hormones and the changes brought about by the overfeeding protocol are summarized in Table 4. There were no associations with pre-overfeeding levels of free and total testosterone, dihydrotestosterone, progesterone, androsterone, pregnenolone, androstenedione, cortisol, or sex hormone-binding globulin (SHBG). Estradiol was negatively correlated with the gains in body weight (r=−0.42; p<0.05) and estrone with the gains in FFM (r=−0.46; p<0.05), while androsterone-glucoronide was positively correlated with the gains in FFM (r=0.43; p<0.05). Pre-overfeeding levels of plasma androstenediol-sulfate, pregnenolone-sulfate, dehydroepiandrosterone (DHEA), and 17-hydroxy pregnenolone were quite consistently and negatively correlated with the gains in body weight, FM, and BE, with coefficients ranging from r=−0.30 to −0.54. In contrast, baseline androstene-3α, 17β-diol-glucoronide levels were positively and rather strongly correlated with the gains in the same morphological traits (r≥0.52; p<0.01).
TABLE 4.
Correlations Between Changes in Body Mass, Body Composition, and Body Energy Partitioning with Baseline Plasma Steroid Levels
| CHANGES WITH OVERFEEDING | |||||
|---|---|---|---|---|---|
| PRE-OVERFEEDING | Body weight | FM | FFM | FM/FFM | BE |
| Estradiol (pg/ml) | −0.42* | −0.25 | −0.34 | −0.40 | −0.28 |
| Free testosterone (pg/ml) | −0.02 | −0.27 | 0.32 | −0.30 | −0.24 |
| Total testosterone (ng/dl) | −0.28 | −0.34 | −0.01 | −0.32 | −0.34 |
| Progesterone (nmol/L) | −0.03 | 0.17 | −0.26 | 0.17 | 0.15 |
| Androsterone (nmol/L) | −0.22 | −0.29 | 0.03 | −0.21 | −0.29 |
| Androsterone-sulfate (nmol/L) | −0.09 | −0.20 | 0.11 | −0.10 | −0.19 |
| Androsterone-glucoronide (nmol/L) | 0.12 | −0.19 | 0.43* | −0.30 | −0.15 |
| Androstane-3α, 17β-diol (nmol/L) | −0.07 | −0.12 | 0.04 | −0.24 | −0.12 |
| Androstenediol-sulfate (nmol/L) | −0.44* | −0.54** | 0.01 | −0.41* | −0.54** |
| Dihydrotestosterone (nmol/L) | −0.10 | 0.02 | −0.18 | 0.03 | 0.01 |
| Pregnenolone (nmol/L) | −0.03 | −0.18 | 0.17 | −0.16 | −0.16 |
| Pregnenolone-sulfate (nmol/L) | −0.31 | −0.41* | 0.04 | −0.32 | −0.41* |
| Androstenedione (nmol/L) | −0.13 | −0.25 | 0.12 | −0.28 | −0.25 |
| DHEA (nmol/L) | −0.30 | −0.45* | 0.10 | −0.46* | −0.44* |
| DHEA-sulfate (nmol/L) | −0.31 | −0.34 | −0.05 | −0.13 | −0.34 |
| 17-hydroxy progesterone (nmol/L) | −0.38 | −0.30 | −0.20 | −0.35 | −0.33 |
| Androstane-3β, 17β-diol (nmol/L) | −0.18 | −0.18 | −0.06 | −0.18 | −0.18 |
| Androstene-3β, 17β-diol (nmol/L) | −0.31 | −0.32 | −0.07 | −0.34 | −0.33 |
| Androstene-3α, 17β-diol-glucoronide (nmol/L) | 0.52** | 0.52** | 0.16 | 0.35 | 0.54** |
| 17-hydroxy pregnenolone (nmol/L) | −0.32 | −0.41* | 0.02 | −0.38 | −0.41* |
| Estrone (pmol/L) | −0.32 | −0.02 | −0.46* | −0.07 | −0.06 |
| Cortisol (nmol/L) | −0.39 | −0.35 | −0.17 | −0.27 | −0.36 |
| SHBG (nmol/L) | 0.04 | 0.10 | −0.07 | −0.00 | 0.10 |
p<0.05;
p<0.01
BE = body energy; DHEA = dehydroepiandrosterone; FFA = free fatty acids; FFM = fat-free mass; FM = fat mass; SHBG = sex hormone-binding globulin
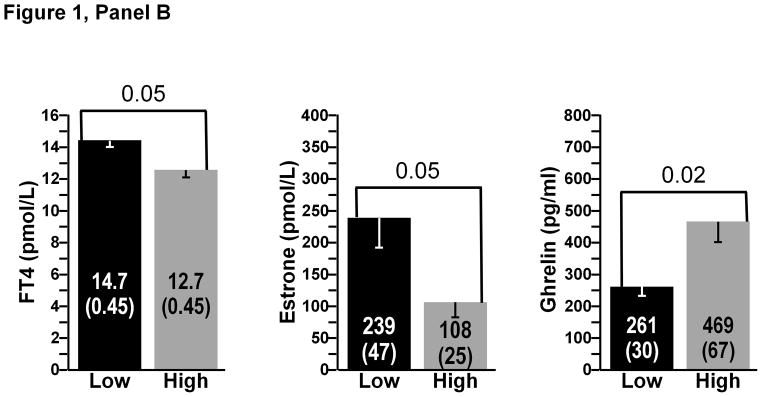
A comparison between the low and high gainers (N=6 subjects in each subgroup) for the most significant biological correlates of the study is presented in Figure 1. There were no significant differences at baseline in FM between the high- and low-FM gainers. The same was true for baseline FFM and BE. Three pre-overfeeding variables were found to differ between the high-and low-FM gainers (Figure 1, Panel A). Baseline total energy expenditure over 4 hours after the consumption of a test meal and plasma levels of total testosterone and androstenediol-sulfate were all significantly higher in the low-FM gainers (all p<0.05). Pre-overfeeding levels of plasma ghrelin (p=0.02) were significantly lower in the low-FFM gainers, whereas baseline plasma FT4 (p=0.05) and estrone (p<0.05) were higher in the low-FFM gainers compared to the six highest FFM gainers (Figure 1, Panel B). Finally, there were six baseline biomarkers that were significantly higher in the low-BE gainers: TEM over 4 hours minus RMR over the same duration and plasma total testosterone, cortisol, estradiol, androstenedione, and androstenediol-sulfate (all p<0.05) (Figure 1, Panel C). Finally, low gainers for the ratio of FM to FFM exhibited a significantly higher muscle OGDH enzyme activity than the high gainers (p<0.05) (results not displayed).
Figure 1.


Panel A Baseline variables discriminating between high and low gainers for FM. Low gainers were the six subjects with the lowest overfeeding-induced changes and high gainers were the six subjects with the highest gains in FM. All differences significant at p<0.05.
Panel B: Baseline variables discriminating between high and low gainers for FFM. Low gainers were the six subjects with the lowest overfeeding-induced changes and high gainers were the six subjects with the highest gains in FFM. All differences significant at p<0.05.
Panel C: Baseline variables discriminating between high and low gainers for total BE. Low gainers were the six subjects with the lowest overfeeding-induced gains in BE and high gainers were the six subjects with the highest gains in BE. All differences significant at p<0.05.
DISCUSSION
The partitioning of nutrients in the form of adipose tissue gain relative to lean tissue increment accounts for about 35 percent of the individual differences in body mass gain and represents the single most important correlate of body mass gain in this study. The imprecision in the assessment of baseline energy requirements when subjects were kept in a weight-stable situation is highly unlikely to be a confounder of the gains in body weight and composition, as there were no significant correlations between baseline energy intake and the overfeeding-induced changes.. The conditions of the study are therefore adequate to investigate the nature of the baseline biological variables associated with individual responses to long-term overfeeding.
Figure 2 provides in a schematic form a summary of the strongest baseline predictors of the gains in body weight, total adiposity, the FM-to-FFM ratio, or BE content. The upper section of the figure lists the five most important biomarkers while the lower part adds the next five best predictors.
Figure 2.

Baseline predictors of the response to long-term overfeeding. The paths to high gains are identified from the correlation studies, as well as the comparisons of high and low gainers in response to overfeeding. The strongest and most consistent baseline predictors are in the upper part of the figure, indicated by thick black arrows, while the weaker and less consistent predictors are grouped in the lower part of the figure, characterized by narrow grey arrows.
The baseline level of FFM correlated negatively with the FM/FFM changes as an indicator of energy partitioning, with a high FFM being associated with a lower gain in adiposity relative to the gain in lean mass. Cardiorespiratory fitness as measured by VO2max was associated with lower adiposity gains and lower increases in FM relative to the gains in FFM. These observations suggest that individuals who are fit gain less adiposity under chronic overfeeding conditions. Moreover, a high skeletal muscle oxidative potential was associated with lower gains in adiposity and BE. Strong negative correlations between the ratio of PFK/OGDH enzyme activities and the changes in FM/FFM, as well as with the gains in adiposity and BE, indicate that the metabolic profile of skeletal muscle is a reasonable biomarker of overfeeding-induced changes in adiposity and energy partitioning. Interestingly, fiber type distribution was not associated with body weight or body composition changes with overfeeding. In a previous report, we have shown that muscle fiber type distribution was not associated with adiposity, while enzyme markers of oxidative metabolism were, in a cross-sectional study encompassing 348 men and women, 16 to 31 years of age7. Others have also shown that markers of oxidative phosphorylation were significant predictors of the response to a weight-loss program8.
Elevated baseline androstenediol-sulfate levels were a strong and consistent predictor of lower body weight, FM, FM-to-FFM ratio, and BE gains. Normal ranges have been examined in various sets of endocrine patients9. Interestingly, levels of this hormone could represent a marker of thyroid function10. For example, urinary androstenediol levels are elevated in thyroid cancer patients11. Accordingly, we found significant correlations between androstenediol-sulfate levels and measures of TSH. Moreover, altered diurnal variations of this steroid have been reported in women with anorexia nervosa12. Additional evidence suggests that androstenediol-sulfate induces peroxisomal beta-oxidation in the liver13. Both liver and 3T3-L1 adipocytes have been shown to generate androstenediol-sulfate from DHEA14, 15. Additional studies are required to validate the findings obtained with this putative biomarker of body weight and preferential fat gain.
Markers of androgenic status were also related to gains in body weight, FM, and BE. For example, low total testosterone levels were found in high-FM gainers and DHEA levels were negatively related to body weight, FM, and BE gains, whereas androstene-3α, 17β-diol-glucoronide levels were positively related to these responses. These findings are consistent with cross-sectional studies showing that obesity is related to lower circulating levels of testosterone and DHEA and increased androstene-3α, 17β-diol-glucoronide concentrations in men16, 17. We have also previously shown that levels of the androgen metabolite androstene-3α, 17β-diol-glucoronide were modulated by weight gain and weight loss18, 19, possibly as a result of adipose tissue-mediated androgen inactivation20. Findings of the present study point toward higher FM gains in individuals with slightly reduced androgen levels and higher inactive androgen metabolite concentrations at baseline.
The gains in FM and FFM were not significantly associated with baseline RMR or TEM. However, total postprandial energy expenditure over 4 hours after a standardized meal, which combines both RMR and TEM, was significantly and inversely related with the gains in the FM-to-FFM ratio. In other words, high postprandial energy expenditure was associated with lower gains in FM relative to those in FFM over time. This observation is reminiscent of the longstanding debate surrounding the hypothesis of a reduced thermogenic capacity in individuals predisposed to body fat gain21. Moreover, our findings that baseline TEM and total postprandial energy expenditure were lower in the high-FM gainers and in the high-FM-relative-to-FFM gainers represent strong suggestive evidence to the effect that low baseline metabolic rates are risk factors for higher gains in adiposity or that they reflect an energy-partitioning profile favoring fat accretion during exposure to overfeeding. These observations are also concordant with reports based on observational data suggesting that RMR is a weak predictor of body weight gain over time22, 23, although this is not a universal finding24. Thus, even under a protocol of imposed but standardized overfeeding providing an increase in energy intake that largely exceeds a normal compensatory thermogenic response, our results suggest that slight changes in metabolic rates can potentially have a small impact on body weight and composition changes.
Ample evidence supports a role of thyroid hormones in mediating variation in the body composition response to chronic overfeeding. Thyroid hormones are closely involved in thermoregulation and growth. They stimulate mitochondrial oxygen consumption and ATP synthesis, intestinal glucose and amino acid absorption, hepatic glycogenolysis, and insulin degradation, and they potentiate the glycogenolytic action of Epi. In the present study, although circulating T3 and T3 receptor, as well as total and FT4, were unrelated to changes in body composition, we found that increased TSH response to TRH injection at baseline predicted lower fat mass gains relative to fat-free mass gains (FM/FFM ratio) in response to overfeeding. Increased 30- and 45-min TSH response to TRH is indirectly indicative of reduced thyroid responsiveness (as opposed to reduced hypothalamic or pituitary responsiveness in low-TRH responders). The TSH response to TRH has been shown to be reduced in obese individuals25. Moreover, alterations of the TRH/TSH/T3/T4 axis have been previously reported in patients with anorexia nervosa undergoing weight recovery and in bulimic patients26, 27. Our findings suggest that relatively mild, subclinical decreases in thyroid responsiveness to stimulation may predispose to increased partitioning of excess substrates toward FM accretion under chronic overfeeding conditions.
Plasma levels of insulin were previously found to be associated with long-term variations in body weight28, 29. Specifically, an increased insulinemia predicted lower body-weight gains, presumably mediated by the sympathetic nervous system activity30, 31. This is concordant with previously reported results obtained in the present cohort, which showed that an increase in the insulin response to overfeeding was associated with more pronounced thermogenic changes32. However, the present study did not provide evidence that baseline levels of fasting or post-glucose insulin were predictive of changes in body weight or body composition induced by overfeeding. Rather, the results emphasized a negative relationship between baseline Norepi levels and changes in FFM. This apparent link between a marker of baseline sympathetic tonus and a more pronounced increase in FFM, which likely has a higher oxidative potential than adipose tissue, may provide a plausible mechanistic link for a causal relationship. In this regard, it is useful to keep in mind, as we have reported before, that an energy-partitioning profile favoring FFM gains relative to FM gains in response to overfeeding is protective against excess weight gain5.
We found no correlation between baseline fat cell number (results not shown) or assessments of adipose tissue and adipocyte metabolism with the response to overfeeding. Among the factors that we examined, the degree of abdominal adipocyte hypertrophy, which is a significant predictor of leptin release33, seems to be the only aspect of adipose tissue that relates to the response to overfeeding in these young men. Our findings indicate that adipocyte hypertrophy predicts higher gains in FM and BE. In adipocyte turnover studies34, adipocyte hypertrophy has been related to higher generation rates of new fat cells through hyperplasia. The study is characterized by a number of strong aspects but also several limitations. The 24 young, normal-weight men were exposed to a fully standardized, long-term overfeeding protocol in which compliance was not an issue. Compared to other overfeeding studies, the present sample size is on the high side, but it is not large when the task is to identify predictors of individual differences in the response to overfeeding. It is also important to remember that since the caloric overload was standardized and clamped for all subjects, the mechanisms regulating appetite and satiety were not allowed to contribute physiologically to the regulation of body weight as they would in a free-living situation in which individual differences in caloric intake would be found. Additionally, as subjects were kept sedentary, except for a supervised daily 30-min walk, the contribution of compensatory physical activity energy expenditure is likely to be less than would be observed in a free-living environment for many of the subjects. An obvious limitation of the report is that it is based on 24 subjects from 12 pairs of identical twins. The fact that the subjects are not totally independent of one another may have influenced some of the quantitative estimates reported herein. Hence, we have not specifically emphasized the magnitude of the predictive relationships uncovered in the study. Rather, we have used the cutoff p level of 0.05 to identify promising biomarkers that in our judgment deserve to be further investigated in future, properly powered overfeeding experiments.
In summary, the present study reveals that pre-overfeeding levels of plasma epinephrine, norepinephrine, thyroid hormones, growth hormone, IGF-1, adiponectin, ghrelin, fasting insulin and insulin area during an OGTT, free and total testosterone, progesterone, androsterone, dihydrotestosterone, pregnenolone, androstenedione, cortisol, and SHBG as well as respiratory exchange ratio at rest and over 4 hours after a meal, skeletal muscle fiber type distributions, and marker enzymes of glycolysis, did not correlate with the gains in body weight and body composition. In contrast, as summarized in Figure 2, pre-overfeeding maximal oxygen uptake relative to body mass was negatively correlated with the gains in body weight, fat mass, and BE. Enzyme activities indicative of muscle oxidative potential correlated negatively with the gains in adiposity and BE. Androstenediol-sulfate, dehydroepiandrosterone, and 17-hydroxy pregnenolone were consistently and negatively correlated with the gains in adiposity and BE while estrone was negatively and androsterone-glucoronide was positively correlated with the gains in FFM. Baseline plasma leptin correlated positively with the gains in body weight, adiposity, and BE. Baseline TSH levels in response to a TRH stimulation correlated positively with body composition changes. Abdominal fat cell size was positively correlated with the gains in adiposity. Six variables were significantly different at baseline between the six lowest and six highest BE gainers: TEM, total testosterone, cortisol, estradiol, androstenedione, and androstenediol-sulfate, with the low gainers exhibiting the highest values for all baseline biomarkers. Furthermore, high baseline levels of total postprandial energy expenditure, testosterone, and androstenediol-sulfate were associated with lower gains in adiposity, whereas high baseline levels of FT4 and estrone were biomarkers of low-FFM gainers.
We conclude that pre-overfeeding fat-free mass, muscle oxidative enzyme activities, maximal oxygen uptake, low androgenicity as defined by the status of several androgens and androgen precursors, and high levels of leptin appear to be biomarkers of more favorable body composition changes and less body energy gains in response to a fixed amount of excess calories. However, these biomarkers of the individual differences in the responsiveness to chronic overfeeding tend to have only moderate effects, with none of them exerting a large, powerful influence on the adaptive response to long-term overfeeding.
Supplementary Material
Acknowledgments
The overfeeding study was supported by the National Institutes of Health (DK34624). The authors would like to express their thanks to Claude Leblanc, MSc, for his contributions to the statistical analysis. We are also indebted to Guy Fournier, BSc; Jacques Bouillon, MSc; Suzie Hamel, MSc; Brigitte Zement, MSc; Marcel R. Boulay, PhD; Maryse Lebrun, BSc; Martine Marcotte, MSc; Monique Chagnon, A.R.T; Josée Lapointe; Henri Bessette; Gilles Bouchard; Serge Carbonneau; and Simon Caron for their contributions to the execution of the study. Gratitude is also expressed to Alain Belanger, PhD; Jean-Pierre Després, PhD; Jean Dussault, MD; Paul J. Lupien, MD, PhD; Sital Moorjani, PhD; André Nadeau, MD; Sylvie Pinault, MD; Jean-Aime Simoneau, PhD; and Germain Thriault, MD, and for their contributions to various aspects of the research.
Footnotes
Supplementary information is available at International Journal of Obesity’s website.
CONFLICTS OF INTEREST
CB is a scientific advisor for Weight Watchers International, Nike-SPARQ, and Pathway Genomics. Andre T holds an industry-sponsored research chair in bariatric and metabolic surgery.
References
- 1.Bouchard C, Tremblay A, Despres JP, Nadeau A, Lupien PJ, Theriault G, et al. The response to long-term overfeeding in identical twins. N Engl J Med. 1990;322:1477–1482. doi: 10.1056/NEJM199005243222101. [DOI] [PubMed] [Google Scholar]
- 2.Alligier M, Meugnier E, Debard C, Lambert-Porcheron S, Chanseaume E, Sothier M, et al. Subcutaneous adipose tissue remodeling during the initial phase of weight gain induced by overfeeding in humans. J Clin Endocrinol Metab. 2012;97:E183–192. doi: 10.1210/jc.2011-2314. [DOI] [PubMed] [Google Scholar]
- 3.Bray GA, Smith SR, de Jonge L, Xie H, Rood J, Martin CK, et al. Effect of dietary protein content on weight gain, energy expenditure, and body composition during overeating: a randomized controlled trial. JAMA. 2012;307:47–55. doi: 10.1001/jama.2011.1918. [DOI] [PMC free article] [PubMed] [Google Scholar]
- 4.Levine JA, Eberhardt NL, Jensen MD. Role of nonexercise activity thermogenesis in resistance to fat gain in humans. Science. 1999;283:212–214. doi: 10.1126/science.283.5399.212. [DOI] [PubMed] [Google Scholar]
- 5.Bouchard C, Despres JP, Tremblay A. Genetics of obesity and human energy metabolism. Proc Nutr Soc. 1991;50:139–147. doi: 10.1079/pns19910025. [DOI] [PubMed] [Google Scholar]
- 6.Forbes GB, Brown MR, Welle SL, Lipinski BA. Deliberate overfeeding in women and men: energy cost and composition of the weight gain. Br J Nutr. 1986;56:1–9. doi: 10.1079/bjn19860080. [DOI] [PubMed] [Google Scholar]
- 7.Simoneau JA, Bouchard C. Skeletal muscle metabolism and body fat content in men and women. Obes Res. 1995;3:23–29. doi: 10.1002/j.1550-8528.1995.tb00117.x. [DOI] [PubMed] [Google Scholar]
- 8.Gerrits MF, Ghosh S, Kavaslar N, Hill B, Tour A, Seifert EL, et al. Distinct skeletal muscle fiber characteristics and gene expression in diet-sensitive versus diet-resistant obesity. J Lipid Res. 2010;51:2394–2404. doi: 10.1194/jlr.P005298. [DOI] [PMC free article] [PubMed] [Google Scholar]
- 9.Dikkeschei LD, Willemse PH, Wolthers BG, de Ruyter-Buitenhuis AW, Nagel GT. Delta-5-androstenediol and its sulphate in serum and urine of normal adults and patients with endocrine diseases. Clin Endocrinol (Oxf) 1993;39:475–482. doi: 10.1111/j.1365-2265.1993.tb02396.x. [DOI] [PubMed] [Google Scholar]
- 10.Tagawa N, Takano T, Fukata S, Kuma K, Tada H, Izumi Y, et al. Serum concentration of androstenediol and androstenediol sulfate in patients with hyperthyroidism and hypothyroidism. Endocr J. 2001;48:345–354. doi: 10.1507/endocrj.48.345. [DOI] [PubMed] [Google Scholar]
- 11.Choi MH, Moon JY, Cho SH, Chung BC, Lee EJ. Metabolic alteration of urinary steroids in pre- and post-menopausal women, and men with papillary thyroid carcinoma. BMC Cancer. 2011;11:342. doi: 10.1186/1471-2407-11-342. [DOI] [PMC free article] [PubMed] [Google Scholar]
- 12.Sirinathsinghji DJ, Mills IH. Concentration patterns of plasma dehydroepiandrosterone, delta 5-androstenediol and their sulphates, testosterone and cortisol in normal healthy women and in women with anorexia nervosa. Acta Endocrinol (Copenh) 1985;108:255–260. doi: 10.1530/acta.0.1080255. [DOI] [PubMed] [Google Scholar]
- 13.Sakuma M, Yamada J, Suga T. Induction of peroxisomal beta-oxidation by structural analogues of dehydroepiandrosterone in cultured rat hepatocytes: structure-activity relationships. Biochim Biophys Acta. 1993;1169:66–72. [PubMed] [Google Scholar]
- 14.Marwah A, Gomez FE, Marwah P, Ntambi JM, Fox BG, Lardy H. Redox reactions of dehydroepiandrosterone and its metabolites in differentiating 3T3-L1 adipocytes: A liquid chromatographic-mass spectrometric study. Arch Biochem Biophys. 2006;456:1–7. doi: 10.1016/j.abb.2006.09.023. [DOI] [PubMed] [Google Scholar]
- 15.Marwah A, Marwah P, Lardy H. Ergosteroids. VI. Metabolism of dehydroepiandrosterone by rat liver in vitro: a liquid chromatographic-mass spectrometric study. J Chromatogr B Analyt Technol Biomed Life Sci. 2002;767:285–299. doi: 10.1016/s1570-0232(01)00570-0. [DOI] [PubMed] [Google Scholar]
- 16.Tchernof A, Despres JP, Belanger A, Dupont A, Prud’homme D, Moorjani S, et al. Reduced testosterone and adrenal C19 steroid levels in obese men. Metabolism. 1995;44:513–519. doi: 10.1016/0026-0495(95)90060-8. [DOI] [PubMed] [Google Scholar]
- 17.Tchernof A, Labrie F, Belanger A, Prud’homme D, Bouchard C, Tremblay A, et al. Androstane-3alpha,17beta-diol glucuronide as a steroid correlate of visceral obesity in men. J Clin Endocrinol Metab. 1997;82:1528–1534. doi: 10.1210/jcem.82.5.3924. [DOI] [PubMed] [Google Scholar]
- 18.Pritchard J, Despres JP, Gagnon J, Tchernof A, Nadeau A, Tremblay A, et al. Plasma adrenal, gonadal, and conjugated steroids before and after long-term overfeeding in identical twins. J Clin Endocrinol Metab. 1998;83:3277–3284. doi: 10.1210/jcem.83.9.5136. [DOI] [PubMed] [Google Scholar]
- 19.Pritchard J, Despres JP, Gagnon J, Tchernof A, Nadeau A, Tremblay A, et al. Plasma adrenal, gonadal, and conjugated steroids following long-term exercise-induced negative energy balance in identical twins. Metabolism. 1999;48:1120–1127. doi: 10.1016/s0026-0495(99)90125-7. [DOI] [PubMed] [Google Scholar]
- 20.Blouin K, Boivin A, Tchernof A. Androgens and body fat distribution. J Steroid Biochem Mol Biol. 2008;108:272–280. doi: 10.1016/j.jsbmb.2007.09.001. [DOI] [PubMed] [Google Scholar]
- 21.Rothwell NJ, Stock MJ. A role for brown adipose tissue in diet-induced thermogenesis. Nature. 1979;281:31–35. doi: 10.1038/281031a0. [DOI] [PubMed] [Google Scholar]
- 22.Buscemi S, Verga S, Caimi G, Cerasola G. Low relative resting metabolic rate and body weight gain in adult Caucasian Italians. Int J Obes. 2005;29:287–291. doi: 10.1038/sj.ijo.0802888. [DOI] [PubMed] [Google Scholar]
- 23.Ravussin E, Lillioja S, Knowler WC, Christin L, Freymond D, Abbott WG, et al. Reduced rate of energy expenditure as a risk factor for body-weight gain. N Engl J Med. 1988;318:467–472. doi: 10.1056/NEJM198802253180802. [DOI] [PubMed] [Google Scholar]
- 24.Seidell JC, Muller DC, Sorkin JD, Andres R. Fasting respiratory exchange ratio and resting metabolic rate as predictors of weight gain: the Baltimore Longitudinal Study on Aging. Int J Obes Relat Metab Disord. 1992;16:667–674. [PubMed] [Google Scholar]
- 25.Douyon L, Schteingart DE. Effect of obesity and starvation on thyroid hormone, growth hormone, and cortisol secretion. Endocrinol Metab Clin North Am. 2002;31:173–189. doi: 10.1016/s0889-8529(01)00023-8. [DOI] [PubMed] [Google Scholar]
- 26.Kiyohara K, Tamai H, Takaichi Y, Nakagawa T, Kumagai LF. Decreased thyroidal triiodothyronine secretion in patients with anorexia nervosa: influence of weight recovery. Am J Clin Nutr. 1989;50:767–772. doi: 10.1093/ajcn/50.4.767. [DOI] [PubMed] [Google Scholar]
- 27.Kiyohara K, Tamai H, Karibe C, Kobayashi N, Fujii S, Fukino O, et al. Serum thyrotropin (TSH) responses to thyrotropin-releasing hormone (TRH) in patients with anorexia nervosa and bulimia: influence of changes in body weight and eating disorders. Psychoneuroendocrinology. 1987;12:21–28. doi: 10.1016/0306-4530(87)90018-7. [DOI] [PubMed] [Google Scholar]
- 28.Swinburn BA, Nyomba BL, Saad MF, Zurlo F, Raz I, Knowler WC, et al. Insulin resistance associated with lower rates of weight gain in Pima Indians. J Clin Invest. 1991;88:168–173. doi: 10.1172/JCI115274. [DOI] [PMC free article] [PubMed] [Google Scholar]
- 29.Schwartz MW, Boyko EJ, Kahn SE, Ravussin E, Bogardus C. Reduced insulin secretion: an independent predictor of body weight gain. J Clin Endocrinol Metab. 1995;80:1571–1576. doi: 10.1210/jcem.80.5.7745002. [DOI] [PubMed] [Google Scholar]
- 30.Berne C, Fagius J, Pollare T, Hjemdahl P. The sympathetic response to euglycaemic hyperinsulinaemia. Evidence from microelectrode nerve recordings in healthy subjects. Diabetologia. 1992;35:873–879. doi: 10.1007/BF00399935. [DOI] [PubMed] [Google Scholar]
- 31.Rowe JW, Young JB, Minaker KL, Stevens AL, Pallotta J, Landsberg L. Effect of insulin and glucose infusions on sympathetic nervous system activity in normal man. Diabetes. 1981;30:219–225. doi: 10.2337/diab.30.3.219. [DOI] [PubMed] [Google Scholar]
- 32.Tremblay A, Nadeau A, Despres JP, Bouchard C. Hyperinsulinemia and regulation of energy balance. Am J Clin Nutr. 1995;61:827–830. doi: 10.1093/ajcn/61.4.827. [DOI] [PubMed] [Google Scholar]
- 33.Couillard C, Mauriege P, Imbeault P, Prud’homme D, Nadeau A, Tremblay A, et al. Hyperleptinemia is more closely associated with adipose cell hypertrophy than with adipose tissue hyperplasia. Int J Obes Relat Metab Disord. 2000;24:782–788. doi: 10.1038/sj.ijo.0801227. [DOI] [PubMed] [Google Scholar]
- 34.Arner E, Westermark PO, Spalding KL, Britton T, Ryden M, Frisen J, et al. Adipocyte turnover: relevance to human adipose tissue morphology. Diabetes. 2010;59:105–109. doi: 10.2337/db09-0942. [DOI] [PMC free article] [PubMed] [Google Scholar]
Associated Data
This section collects any data citations, data availability statements, or supplementary materials included in this article.