

Abstract
Oral delivery is an attractive route to deliver therapeutics via nanoparticles due to its ease of administration and patient compliance. This review discusses laboratory techniques for studying oral delivery of nanoparticles, which offer protection of cargo through the gastrointestinal tract. Some of the difficulties in modeling oral delivery include the harsh acidic environment, variable pH, and the tight monolayer of endothelial cells present throughout the gastrointestinal tract. The use of in vitro techniques including the Transwell ® system, simulated gastric/intestinal fluid, and diffusion chambers addresses these challenges. When studying effects after oral delivery in vivo, bioimaging of nanoparticle biodistribution using radioactive markers has been popular. Functional assays such as immune response and systemic protein concentration analysis can further define the merits of the oral delivery systems. As biologics become increasingly more important in chronic therapies, nanoparticle-mediated oral delivery will assume greater prominence, and more sophisticated in vitro and in vivo models will be required.
Keywords: Nanoparticles, Oral delivery, Simulated intestinal fluid, Transwell ®, Closed loop, Gut-on-a-chip, CaCo-2, Epithelium, Oral delivery barriers
1. Introduction
Most biologics such as polypeptides and nucleic acids require an effective intracellular delivery system to bring them to the molecular target for therapeutic effect. Formulation into nanoparticles or nanocomplexes to facilitate their cellular uptake represents the most popular configuration for intracellular delivery. Common methods of nanoparticulate delivery include intravenous and intramuscular injection, inhalation, and ingestion [1]; supplemented by more exotic methods such as gene gun bombardment [2], intranasal instillation [3], or microneedle-based transdermal delivery [4]. Among all of these methods, oral delivery is the most desirable due to convenience and patient compliance, especially when long term or daily use is required [5–7]. Oral delivery is particularly attractive or even essential when access to clinics, which may be the case in some developing countries, is inconvenient and limited.
Although there are many benefits to oral delivery, the design of an oral controlled release system is difficult due to the external barriers in the gastro-intestinal (GI) tract that are designed to breakdown and destroy intruders. Encapsulation in a nanoparticle may partially protect the cargo from the harsh degradation environment in the stomach and the GI tract, but peristalsis significantly limits their retention. Bioavailability of nanoparticle-mediated oral delivery therefore remains poor and optimization is required, allowing ample room for improvement. This review provides an overview of the different techniques currently used to model and analyze oral delivery of nanoparticles in the laboratory.
2. Barriers to oral delivery
The barriers to oral delivery include the acidity of the gastrointestinal (GI) environment, enzymes, the mucus layer that lines a majority of the GI tract, and the tight junctions of the epithelium. One of the major barriers is the varying and harsh acidic environment of the GI tract, which includes the stomach and the intestines. The pH of the stomach ranges from 1.0 to 2.5 [8,9], it rises to 6.6– 7.5 from the proximal end to the ileum of the small intestine, drops to 6.4 at the ceacum, and then rises progressively to 7.0 from the right to the left colon [8]. This pH variation in the GI tract makes it difficult to maintain nanoparticle integrity throughout the entirety of the GI tract. In addition, the contents of gastric fluids present an additional obstacle to nanoparticle oral delivery due to a plethora of enzymes [10]. Specifically, the stomach contains hydrochloric acid and pepsin, which degrade proteins [11]. The duodenum of the small intestine contains bile salts and degradative enzymes including amylase, trypsin, and lipase [9], which degrade starch, proteins, and fats respectively. The small intestine contains pancreatic juices comprising pancreatin, trypsin, lipase, peptidases (breaks peptide bonds), and maltase (degrades maltose) [12]. All of these degradative enzymes present formidable barriers for the oral delivery of proteins, nucleic acids, or drugs.
The mucus layer that lines the surface of the GI tract can present another barrier to delivery and can result in rapid nanoparticle clearance due to quick cell turnover. The average thickness of the mucus layer varies from 170 μm in the gut to 10 μm in the ileum to 100 μm in the colon, making the mucus layer difficult to model in vitro [13,14]. Particles attached to the loosely adherent outer mucus layer are easily lost due to rapid mucus cell turnover, approximately 2–5 days in the small intestine of humans [15]. This rapid clearance is a major factor for the difficulty of achieving oral sustained delivery [16]. The mucosal intestinal lining is one of the largest immunological compartments in the body [10] and therefore can also lead to the loss of nanoparticles through immune attack and subsequent removal by the immune system.
The passage of highly charged and large molecules through the cell membrane in the epithelial layer is prevented [17], which emphasizes the importance of using nano-sized particles. However, the transport of nanoparticles is dependent not only on size but chemical makeup as well, with the properties of the intestinal epithelium having a large influence [18]. Passive diffusion through the intestinal epithelium can occur but is limited by the presence of tight junctions [17,18]. However, some nanoparticles are known to be able to open the tight junctions and enhance delivery [19–21], which is beneficial in maintaining cargo integrity due to the lack of proteolytic encounters when transport occurs through the tight junctions [17]. However, tight junctions present a major barrier to delivery in that they do not allow particles greater than 2 nm to pass through [22]. One study shows that in lightly fixed epithelial strands, open tight junctions appear to have approximately 18 nm spacing from center to center, confirming the size limitation of passage through the tight junction [23]. Even if the particles are able to make it past the tight junction barrier, the underlying layer limits passage of nanoparticles to 13–15 nm [22]. Overall, there are significant barriers to oral delivery that must be overcome with the use of nanoparticles.
3. Factors favorable for oral delivery
Although there are many barriers to oral delivery, there are also some advantages, which include a large surface area, a sticky mucus lining, and the presence of microfold cells in the Peyer's Patch. The large surface area for nanoparticle uptake is a highly beneficial trait of the GI tract [24], with the small intestine having a surface area of 250 m2. With its large surface area, there is increased chance for uptake and transport can occur through passive, active, or facilitated mechanisms [18]. Typically, hyprophilic, polar solutes are able to diffuse through the paracellular route instead of the transcellular route. However, nanoparticles tend to be transported by the transcellular route due to their size and surface functional groups [25].
The benefit of the mucus lining is that it consists of a viscous hydrated gel that reduces the shear effect from the movement of gastric juices [10]. Thus if a nanoparticle can stick to the mucus layer located beneath the loosely adherent mucus layer on the surface, it has an increased chance of transcellular migration into the lower layers of the epidermal wall, the epithelial layer, and the lamina propia [16]. Also located among the epithelium in the small intestine is the large immunological organ, the Peyer's Patch, which contains a specialized cell type termed microfold cells (M cells) that increase the transcytotic ability of the nanoparticles. M cells are characterized as atypical epithelial cells that actively phagocytose macromolecules and microbes and deliver them to underlying organized lymphoid particles [26]. M cells are highly efficient antigen deliverers and have been credited with aiding the transport of nanoparticles from the small intestine through the Peyer's Patch and into systemic circulation after they have been ingested.
4. Overcoming oral delivery barriers with use of nanoparticles
Nanoparticles are particles of varying shape ranging in size from 10 to 1000 nm. Their small size allows for a higher surface area to volume ratio and therefore provides a higher adsorption capacity for surface loading [27]. The advantages of using nanoparticles include protection of drug, peptide, or nucleic acid contents from degradative enzymes, increased mucoadhesion, and increased retention in the GI tract. Increased mucoadhesion through the use of nanoparticles has the benefit of improving the oral delivery of poorly adsorbed drugs, proteins, and nucleotides by increasing the time and amount of interaction with the mucus layer of the intestine [16,28,29]. It is hypothesized that this increased mucosal interaction is through electrostatic interactions between the positively charged nanoparticle and the negatively charged mucus and endothelial layer [28,29] or through a physical capture of the nanoparticle by the mucus layer [28]. However, mucoadhesion can also be achieved through hydrophobic interaction, van der Waals interactions, and polymer chain penetration [16]. Nanoparticles can have greater mucoadhesive properties with the use of mucoadhesive polymers, which include Eudragit, poly(acrylic acid), sodium alginate, and chitosan [28]. Although the mucoadhesive properties can be beneficial, they can also provide a means of quick exit if the nanoparticles become associated with the loosely attached mucus layer which is rapidly shed by the stomach [16]. Therefore it is preferred to achieve attachment in the deeper mucus layer, which is shed less often and provides a longer interaction between the nanoparticle and the GI tract.
Most nanoparticles enter the cell through a form of active transport called endocytosis that can be divided into three categories including clathrin-mediated endocytosis, caveolae-mediated endocytosis, and macropinocytosis. Clathrin-mediated endocytosis results in internalization due to ligand-bound receptors, followed by entry into early endosomes, which results in either lysosomal fusion or recycling of the endosome back to the cell surface. Caveolae-mediated endocytosis forms cavicles that are transported to the nucleus after dynamin- and actin-mediated uptake, typically avoiding fusion with the degradative lysosome. Macropinocytosis is fluid-phase endocytosis that is highly dependent on solute concentration surrounding the cell [30]. The lysosome has a highly acidic environment, pH 4.5–5.5 [31] and numerous enzymes that can be detrimental to the integrity of the cargo and therefore it is desirable to achieve endosomal escape into the cytoplasm of the cell. This can result in transcytosis, which allows the nanoparticle to pass through the epithelial layer or, in the case of gene delivery, the nanoparticle contents have the chance to transfect the epithelial cells themselves.
The protection of the cargo from proteolytic enzymes [16] and acidic environments is another benefit of nanoparticles. Not only can the nanoparticle protect its contents from degradation by enzymes, it can also provide controlled release through enzyme degradation of the carrier, which varies according to the enzymes present at different parts in the GI tract [32]. Along the same line, pH-sensitive polymers such as acrylates or anionic polymers can result in controlled release of drug, protein, or nucleic acid [27]. By selecting the appropriate pH-sensitive materials, the drug can be delivered to targeted gut segments in a controlled manner. Commonly used pH-sensitive materials include Eudragit (L100-55, L100, and S100), hydroxypropyl methylcellulose phthalate, and hydroxypropylmethyl cellulose acetate succinate, which dissolve at pH 5.5, 6.0, 7.0, 5.5, and 5.5 respectively. When applied in vivo these pH-sensitive materials show release profiles responsive to the pH at which they dissolve [33].
The benefit of nanoparticles goes beyond the ability to overcome the barriers in the GI tract. They also offer targeting ability via ligand decoration [34,35] such as the use of a prohibitin-homing peptide ligand via a PEG-linker to target adipose endothelial cells [36] and the Fc portion of an IgG to target the Fc receptor to facilitate uptake and transport across airway endothelial cells [37]. In addition, particles are also engineered to provide sustained release of the drug or protein [34,38], which can be particularly beneficial for chronic therapy. Engineering the nanoparticle for increased availability after oral delivery can be done by altering size, charge, lipophilicity or hydrogen bonding capabilities, which mask the cargo characteristics and therefore can improve transport of the nanoparticles and their cargo through both the cell membrane and possibly through the epithelial layer of the gut to provide systemic circulation.
5. In vitro techniques
In vitro techniques are useful in modeling the potential interactions between nanoparticles and the in vivo environment of the GI tract. In models such as simulated gastric fluids and membrane analysis, the modeling of in vivo environment can be done without the use of human cell lines. While other models, such as the Transwell ® system, require the use of various human cell lines. Simulated gastric fluid models how the nanoparticle will react to the fluid of the GI tract and therefore can be used as a preliminary test for the potential behavior of the nanoparticle in the gut after oral delivery. The use of a membrane system can provide an initial test for the transport of the nanoparticles or their contents across the barriers of the gut epithelium. Although the membrane model provides useful information about drug and protein transport, it does not take into account the epithelial cell behavior and cannot provide information about the transfection potential for gene delivery systems. A more mimetic model for the GI epithelium is the Transwell® system. The system includes a 10 μm thick membrane insert that is specially prepared for cell culture and is made out of either polyester or polycarbonate. The membrane is available in varying pore sizes, however, for the purpose of oral delivery studies, the ideal range of pore size is 0.4-3.0 μm [39]. Three Transwell® systems are used to model various cell types and barriers in the gastroepithelium; the CaCo-2 monolayer, CaCo-2 and RajiB or lymphocyte coculture, and CaCo-2 and HT29 coculture. The Transwell® systems provide models for the endothelial cells, M cells, and the mucus secreting goblet cells that are present in the intestinal epithelium. In the Transwell® system, it is possible to monitor nanoparticle transport or gene deliveryby using confocal microscopy [40] or flow cytometry; protein or drug levels can be determined by measuring amounts in the media of the membrane or basal compartments of the Transwell®. The modeling of the intestinal system has recently been modified to include fluid flow with the development of the gut-on-a-chip microdevice. This device is able to better model the human intestine through the use of fluid flow and mechanical stress with the culture of CaCo-2 cells. The various in vitro techniques are described in Sections 5.1–5.6.
5.1. Simulated gastric fluids
The GI tract presents a unique microenvironment of enzymes and ionic strength, which impact both the chemical and colloidal stability of nanoparticles. The typical PBS used to conduct in vitro studies for oral delivery may therefore be inadequate. Simulated gastric and intestinal fluids provide a medium that is representative of the fluid found in the stomach and intestine and thus are better suited to study and analyze the release profiles of controlled release nanoparticles. In the in vitro fluid model, simulated gastric fluid medium at a pH of 1.2 and simulated intestine fluid medium at a pH of 6.8 without enzymes are prepared according to some standard, often times the USP XXVI recommendations or the British Pharmacopoeia [41] with controlled release experiments being performed in a test tube [42,43]. These experiments are typically performed at 37 °C and some are done with agitation (100 rpm) [44] to model the in vivo movement of the gastric fluids. Samples of the medium are withdrawn from the test tube at desired intervals, the nanoparticles are removed by centrifugation, and the amount of drug or protein remaining in the supernatant is analyzed [42].
Simulated intestinal fluids can also be altered to create intestinal fluid models to be used in cell culture, specifically with CaCo-2 cells (cell line details in 5.3). Several studies show the viability of the CaCo-2 monolayer when incubated with modified simulated intestinal fluid [45,46]. These solutions are divided into two categories including the fasted state (FaSSIF) and the fed state (FeSSIF). FeSSIF has approximately 2–5 times greater amounts of bile salts than in the FaSSIF [45]. Notably, the SIF for cell culture does not contain acetic acid, potassium phosphate dibasic, or any of the enzymes given in the British Pharmacopoeia including pancreatin. In one study, taurocholate is identified as the least toxic bile salt for the FaSSIF and the FeSSIF [45], which allows for higher CaCo-2 cell viability. The specially modified SIF has an osmolality similar to that of human cells (275–299 mOsm) at 336–343 mOsm, thus preventing cell swelling or shrinking and making this fluid a reasonable model for transport across CaCo-2 monolayers in intestinal fluid.
5.2. Drug release studies using a membrane
The dialysis membrane model is used for in vitro analysis in experiments that aim to determine peptide and drug transport properties. In this technique, nanoparticle dispersions are added to dialysis bags or a dialysis tube [6] and suspended in the desired buffer. For example, in the case of estradiol release from PLGA nanoparticles, ionic strength phosphate buffer at pH 7.4 is used as the buffer. To simulate GI conditions, the membrane system is maintained at 37 °C and movement is facilitated by shaking at 100 rpm [47,48]. The model can be made even more accurate in representing gastric and intestinal fluids with the use of low pH buffers that model the acidic conditions of the gut. To analyze the drug release, aliquots of the exterior membrane buffer are removed at pre-determined time intervals for measure of the drug content by methods such as high-performance liquid chromatography (HPLC) [47,49].
5.3. CaCo-2 monolayer
The human epithelial colorectal adenocarcinoma cell line, CaCo-2 is typically used to represent the predominant cell type in the gut, the gut epithelial cells [50]. CaCo-2 monolayers can either be grown in a monolayer on a single cell culture well plate or in a Transwell ® setup to model the transport of drug or passage of nanoparticles across the epithelial layer. With the CaCo-2 monolayer grown on a single well cell culture plate, nanoparticle uptake by the cells or transfection of the CaCo-2 cell line can be determined through various methods [34,51]. In the Transwell ® model, the CaCo-2 monolayer is grown on an inserted porous membrane and a different cell line can be seeded on the bottom chamber of the plate. For gene delivery studies, the model works by placing the nanoparticle dispersion on the monolayer on the membrane while nourishing the cells beneath the membrane with nanoparticle-free medium. Transfection of the cells seeded in the bottom well indicates that the nanoparticles have effectively transported through the CaCo-2 monolayer. The CaCo-2 monolayer is typically used between day 15 and day 25 after initial seeding [44,52]. The expected TEER, transepithelial electrical resistance, is a measurement of the confluence and viability of the monolayer. An appropriate TEER value for the experimental period is between 260 and 450 Ω cm2[53]; a TEER of 300 Ω cm2 is representative of that found in the colon while the stripped large intestine has a TEER ranging from 100 to 275 Ω cm2[55]. Typically, a higher TEER value is representative of a more compact cell layer while a decrease in TEER causes greater cell-layer permeability [56]. TEER is an important parameter characterizing the integrity of the cell layer [54] or the tissue [55].
Although this system is often used to model intestinal transport, one disadvantage of the CaCo-2 monolayer is its impermeability to hydrophilic or paracellular transport; therefore making it a better model for colonic tissue and restricting the reliability of the technique as a model for the small intestinal tissue [50]. However, it is not a good model for transport and absorption across the jejunum. Another disadvantage of the CaCo-2 monolayer is that it only models epithelial cells in the intestinal epithelium, however, there are many other cell types including mucosal cells and M cells. Cocultures are therefore an addition to the CaCo-2 monolayer culture and they are used to represent the multicellular intestinal epithelium.
5.4. CaCo-2 and HT29 coculture
Mucus is significant in limiting transport from the gut fluids to the epithelial cells. The potential trapping of the nanoparticles by mucus lining of the epithelial layer also has an effect on the retention time of the nanoparticles in the system. The coculture of CaCo-2 and HT29, a human adenocarcinoma cell line, provides a model for the second major cell type in the gut epithelium, the mucus-secreting goblet cells (Fig. 1). HT29 cells differentiate into mature goblet cells under the influence of methotrexate (MTX) making this cell line important in the mucus layer formation. The coculture of CaCo-2 and HT29-MTX is typically optimized by mixing the two cell lines in appropriate ratio and plating them on the porous membrane of the Transwell ®. The viability of the CaCo-2 monolayer with the mucus secretion is determined the same way as CaCo-2 monolayer alone, using TEER [50]. The expected TEER values of the coculture decrease as the percentage of HT29-MTX increases; for example TEER ranges from 0 to ∼790 Ω cm2 from time 0 to 23 days for 25% HT29-MTX, while it ranges from 0 to ∼310 Ω cm2 for 75% HT29-MTX [57]. An alternative way to determine the viability of the CaCo-2 and HT29-MTX coculture is demonstrated by Mahler et al. and involves mucus layer characterization. The cocultures are seeded on the Transwell ® membrane inserts and after 16 days a slice of the insert is cut out and stained with 0.25% toluidine blue for microscopic examination [58].
Fig. 1.

(A) Mounted rat colonic tissue [55]. (B) Transmission electron micrograph of the apical part of two Caco-2 cells with microvilli and tight junction labeled [54]. (C) TEM image of M cells identified by lack of microvilli at their apical surface in an in vitro CaCo-2 and Raji coculture. (D) M cells identified in fixed cell monolayers by SEM analysis [59]. (E) Coculture of 90% Caco-2 and 10% HT29-MTX grown for 16 days on a Transwell insert and stained with PAS (stains acidic mucosubstances pink). This figure shows the mucus layer with thickness of 2–10 μm [58].
In one experiment, HT29 sub-clones are tested for preparation of the most uniform mucus monolayer. With some HT29 sub-clones, the problem of multiple layer cell growth results in only the top layer of HT29 maturing into goblet-secreting cells, leaving the CaCo-2 and HT29 as multicellular layers below and limiting the accuracy of the model. However, the HT29-D1 and HT29-E12 clones, both stimulated by MTX, were found to completely mature into goblet cells and form a uniform mucus layer with a CaCo-2 monolayer beneath it [50]. Different sub-clones exhibit varying depths of the mucus layer and therefore they can be used to model different segments of the GI tract. HT29-D1 develops into mucus layers of 53±52 μm and the HT29-MTX-E12 results in mucus layers of 142±51 μm [50]. One limitation to the CaCo-2 HT29-MTX model is that the active transport of drugs is underestimated by this model compared to the actual results in vivo[57].
5.5. Coculture for M cell formation
In the intestine, the lymphoid structures, such as the Peyer's Patch, are separated from the lumen by the follicle-associated epithelium (FAE), which contains enterocytes and M cells with few goblet cells. M cells have the capability of transporting particulate matter, including nanoparticles, through transcytosis from the gut contents to the underlying mucosal immune system [59,60].
The initial method for the formation of M cells in the Transwell ® system involved the use of lymphocytes taken from the Peyer's Patch of mice mixed with the CaCo-2 cell line [60,61]. In this system, the CaCo-2 monolayer was allowed to form and then the isolated lymphocytes were cultured on the basolateral side of the monolayer in the Transwell® plate. The Peyer's Patch lymphocytes converted the endothelial cells into M cells (Fig. 1); in the presence of the lymphocytes, the CaCo-2 acquired transcytotic activity and were able to transfer fluorescin isothiocyanate (FITC)-conjugated latex beads through the filter to the bottom well. Kernéis et. al. also proved the presence of M cells in the coculture by showing that the Transwell ® system could transport the Vibrio cholerae bacteria, which are uniquely taken-up and transported by M cells [61].
Since the aforementioned model lacked uniformity and did not use solely human cell lines, another method is described using human Burkitt's lymphoma Raji B cells. In this method, CaCo-2 cells are cultured for 14 days, then Raji B are added to the bottom chamber, and the cocultures are maintained for 4–6 days. It is desirable that the epithelial layer lose its microvilli thus demonstrating the CaCo-2 cell line conversion into M cells; however, the loss of microvilli is shown to be nonuniform in this coculture method, suggesting that some of the epithelial cells remained unconverted [60]. While this nonuniform conversion may actually be beneficial in representing the distribution of M cells and enterocytes in the GI tract, the M cell formation occurs on both the apical and basolateral sides of the membrane insert, which is not representative of their presence in the in vivo model [60].
A more physiological, functional, and reproducible model to study the mechanisms of M cell transport is the inverted co-culture model. The inverted model encourages closer contact between the CaCo-2 cell monolayer and the Raji B cells or B lymphocytes. This method involves seeding the CaCo-2 cells on the membrane inserts, inverting the inserts 3–5 days later, placing a piece of silicon tube on the basolateral side of the insert, and adding Raji B cells to the basolateral side of the insert 9–11 days later. The cocultures are maintained for 5 days, the silicon tubing is removed, and the inserts are placed back into the original orientation [59]. The inverted FAE model appears to be the state-of-the-art, with further improvement to be expected with the incorporation of flow using a microfluidic approach.
5.6. Gut-on-a-chip
A new technique termed gut-on-a-chip provides an in vitro model that mimics the intestine's structure and transport properties while sustaining microbial flora. The microdevice is fabricated with upper and lower microchannels using polydimethylsiloxane (PDMS) with a 30 μm thick porous membrane separating them. Fig. 2 illustrates the microdevice design; vacuum sources are used to control the fluid flow through the microchannels and vacuum chambers on either side of the microdevice provide cyclic strain under computer control to mimic intestinal peristalsis. The microchannel is treated with an extracellular matrix solution containing rat type I collagen, and CaCo-2 cells are cultured on the ECM-coated porous microchannel. The CaCo-2 cells experiencing fluid flow in the microdevice form a monolayer in only 3 days, as compared to the 21 days that it takes in the static medium Transwell ® system. The fluid flow during CaCo-2 culture in monolayers allows for the cells to grow in columnar forms with microvilli folds, tight junctions, and crypt formation that mimic in vivo human intestinal epithelium. Introducing peristalsis to the system provides increased paracellular permeability while maintaining TEER, which is more comparable to the transport in in vivo human intestine. Because microbial flora is an important part of intestinal physiology, Lactobacillus rhamnosus GG, a bacterium originally isolated from the human gut, is cultured on top of the CaCo-2 monolayer and a better mimic of the human intestine. The gut-on-a-chip device is an interesting model that matches the physiology, morphology, transport, and pathophysiology characteristics of the human intestine by combining CaCo-2 cells and microbial flora, mechanical stimulants, and fluid flow onto a controllable microfluidic device [62].
Fig. 2.

A schematic of the gut-on-a-chip system showing the porous ECM-coated membrane lined with epithelial cells (CaCo-2 cells) facing the upper channel and vacuum chambers to apply peristaltic forces on both sides of the microchannel [62].
6. Ex vivo techniques
6.1. Everted intestinal sac
Everted rat intestine sacs have been used to measure the mucoadhesive properties, transport and cellular uptake of some nanoparticle assemblies [6,28,63], including drugs and peptides conjugated with nanoparticles [64]. In one protocol, the frog intestine is removed from the dead animal and portions of the intestine are cut to test permeability in various segments of the intestine. The segments of intestine are silk sutured at one end, filled with nanoparticle solution, sutured at the open end, and immersed in Frog Ringer (FR) solution. Solution is then withdrawn from the exterior of the intestine segment and analyzed for the nanoparticle contents [42]. In an alternative method, a rat's intestine is removed, washed, segmented, and fixed onto glass cannulas with rubber rings [64]. A study of drug delivery using a lipid-based particle showed that ex vivo permeation studies failed to predict what occurred in vivo[65], presumably due to the differences in the ex vivo and in vivo extracellular environment as well as the difference in intestinal segment cells ex vivo, thus showing the potential inaccuracy of this model.
7. In situ techniques
7.1. Intestinal loop model
In the intestinal loop model, the animal, typically a rat, rabbit [53], or mouse, is fasted for approximately 3 days and then put under anesthesia for the entirety of the surgical procedure. An incision is made in the midline of the abdomen to expose the small intestine. The desired segments are sliced, held with a clamp, and then washed to remove excess food particles; all of this is done while keeping the intestine attached and in close proximity to the body cavity. The segment is then ligated using suture to form a loop. Careful consideration is made to maintain the normal blood flow and muscle movement to the looped segment [66]. An alternative way to perform the initial preparation is to make an incision at the desired location and then ligating that end. To determine particle transport across the intestine, the particle suspension is injected directly into the loop, and the intestinal loop is returned to the body cavity of the animal for up to 2 h while the animals are maintained under anesthesia [47,53]. After a chosen time period, the animal is sacrificed and the intestinal loop is removed from the body cavity of the animal [67].
A majority of the time, the closed loop intestine is returned to the body cavity for 2 h and then the entire intestinal segment is removed. Another way to use the closed loop method is to inject the nanoparticle solution into the closed loop, remove the suturing after 2 h, and return the intact intestine to the body [66]. This allows for the animal to resume normal digestive processes and movement. After no more than 24 h, the animal is killed and the intestines removed for analysis.
Typically, after performing a closed loop experiment, the tissue is flash frozen and fluorescence or morphology of the intestine is determined by microscopy [53]. For a more quantitative result, the frozen tissue can be homogenized for protein analysis [66]. The tissue can also be removed and dissolved in acetonitrile after homogenization and then evaluated for drug content [48], or blood can be drawn from the animal and analyzed for the presence of the administered drug [68]. To measure the uptake of non-fluorescent peptides or drugs, FITC is often used to label the peptide or drug and a fluorescent microscope measures the fluorescence of the cryo-frozen tissue samples taken from the intestine [69]. A disadvantage of this model is the variation between nanoparticle uptake in the small intestine of different animals: for instance, one study shows an order of magnitude difference of uptake between the rat intestinal loop model and that of the in vivo murine model [70].
8. In vivo techniques
No matter how sophisticated an in vitro model, eventually in vivo evaluation will be required to validate the true performance of an oral delivery system. Noninvasive monitoring is naturally preferred but options as well as details of extracted information would be limited. The most relevant information includes drug release kinetics and biodistribution of the nanoparticles. Often times, functional evaluation or phenotypic correction is also determined simply because release and biodistribution data are not good indicators of therapeutic success. Because oral delivery of nanoparticles is primarily observed in the GI tract, many of the imaging techniques focus on the stomach, small intestine, and the colon. However, the blood and the lymphatic system are also relevant for analysis through therapeutic and immune responses. The techniques below describe many of the commonly used methods to analyze the effectiveness of oral delivery of proteins, drugs, and nucleic acids using nanoparticles.
8.1. Organ analysis
In organ analysis, the animals are sacrificed after oral feeding and the organs are removed and fixed using 4% (or less) paraformaldehyde solution [41]. This technique of histology analysis is useful for semiquantification but is not useful for counting particles that are smaller than 0.5 μm due to confusion between particles and small aggregates. The semi-quantification is done with gel permeation chromatography (GPC), which measures the distribution of the nanoparticle size after in vivo oral delivery; the harvested tissue is dissolved and the solubilized polymer is extracted for GPC analysis [71].
In studies of gene delivery, a reporter gene is commonly used. For instance, in one study, the LacZ gene is delivered using chitosan nanoparticles and after three days the mice are sacrificed, and the stomach and small intestine are surgically removed and stained with X-gal overnight. This process stains for the presence of β-galactosidase to indicate the effective transcription of the orally delivered chitosan/DNA nanoparticle [72]. Although this is a commonly used technique, one negative aspect is the wide variation in results depending on fixatives, fixation temperature, and fixation time [73]. Particles can also be viewed post-organ removal through microscopy techniques including light, fluorescent, or confocal microscopy. Fluorescent microscopy has the benefit of high sensitivity whereas confocal microscopy provides a three dimensional view of fluorescently labeled tissues [71].
8.2. Symptom reversal
Symptom reversal or phenotypic correction can be used to determine the effectiveness of an oral delivery system by looking for changes in enzyme or protein levels or observable changes in behavior or reaction to a stimulus. In in vivo models involving the oral delivery of insulin using nanoparticles, the change in glucose level in the plasma is used to determine the effectiveness of the delivery system. With this method, blood is drawn from the animal that has been orally administered the insulin loaded nanoparticles and the plasma glucose level is determined. At the same time, insulin concentration in the blood can be monitored by radioimmunoassay [43].
In the case of hemophilia, the symptom reversal is tested with the use of the tail clip assay, which determinates the time required for bleeding to stop after clipping the tail. This is done to prove phenotypic correction by transecting part of the tail and monitoring the survival and movement for 48 h, as well as the cessation of tail bleeding [74,75]. Another way to determine phenotypic correction for hemophilia involves the plasma clotting time, where samples and reference standards are mixed with equal parts of human FVIII-deficient plasma, veronal buffer, and aPTT reagent followed by addition of CaCl2. The clotting time is determined and compared to the clotting time of non-hemophilic plasma [75]. Along the same lines, the behavior of an animal pre and post treatment can be representative of the therapeutic effect of the treatment. Parameters such as locomotion activity, exploratory patterns, and anxiety can be characterized to identify changes in neural symptoms [41].
8.3. Immune response
Anaphylactic reaction is a common response to allergens. This response can occur as an antibody response to the protein or an immune response, such as inflammation, and can be graded using a point system with: 0, no sign of reaction to 5, death [76]. Anaphylaxis is a poor indicator of the effectiveness of protein therapy; however, it is commonly used to determine the effectiveness of tolerance induction. Tolerance is important with protein replacement because it allows the patient to receive the protein or the gene that encodes the protein without the danger of an adverse immune response. Signs of an immune response in an animal model include hunched position, piloerection, slowing of movement, bronchospams, respiratory arrest, and anaphylaxis. The plasma can be obtained from the treated patient and measured for antibody titers of interest, which is another indicator of immune response [77].
Antibody analysis is used to determine if a foreign protein is present or if tolerance is developed [77]. For example, to determine the antibodies for cFVIII, plasma samples are mixed with equal volumes of buffered normal plasma and Bethesda units are determined using aPTT assay to compare test samples to human FVIII-deficient control plasma samples [75]. This provides a method for determining inhibitors to the cFVIII protein. An enzyme linked immunosorbent assay (ELISA) is amore commonly used method to determine antibody levels. There are multiple ways that an ELISA can be done; in one example, the plates are coated with the protein of interest, the Arah2 protein, serum samples were added, then biotinylated anti-mouse IgA, IgE, and IgG2a are added to determine the presence of those antibodies in the serum [76]. This yields results that determine which antibodies are specific for the protein of interest; if post-treatment levels are high, it could signify the presence of the foreign protein which is inducing an immune response, however if post-treatment levels are low, it could indicate that tolerance is being induced or that the protein is absent.
Another immune analysis technique involves measuring the amount of a specific antigen in the plasma. Although this antigen may not stimulate an immune response, the presence of the antigen signifies that the protein is being replaced, which is valid in protein and gene delivery applications. For example, in the case of oral delivery for hemophilia A, an aPTT assay determines the FVIII activity after administration of nanoparticles as compared to non-treated mice [75].
8.4. DNA/RNA extraction
In oral gene delivery studies, analysis of the genomic DNA in the tissue of the animal is one of the most sensitive methods of biodistribution analysis. This is done by lysing tissue samples, obtaining DNA from the tissue, purifying the DNA, and performing PCR [74]. In one study, the presence of the gene of interest is determined by PCR using primers that flank the gene segment; for example, to determine the presence of the cFVIII gene after oral gene delivery of FVIII with chitosan nanoparticles, forward and reverse primers that flank the cFVIII B-domain amplified the 152-bp fragment of interest and verified the presence of the gene [75]. The biodistribution of the nanoparticles is determined by observing the amount of amplified DNA in the extracted tissue samples.
8.5. Protein extraction
Protein analysis can be done by sacrificing the animal, removing the organ of interest, and homogenizing the organ to make the proteins determinable by Western blotting [41]. This analysis can determine relative amount of protein and type of protein based on molecular weight and standards.
8.6. Blood analysis
Blood is often used to determine the presence of a peptide or drug following oral delivery of a nanoparticle carrying drug, peptide, or nucleic acid. The whole blood or plasma can be used to perform assays. In one example, the Fluorogenic Thrombin Generation Test (FTGT), which is highly sensitive to low levels of FVIII uses plasma and fluorogenic thrombin substrate followed by use of a plate reader to quantify free thrombin as a measure of the transgene expression achieved by oral delivery of the cFVIII-chitosan nanoparticles [74]. In experiments performed by Sakuma et. al., electrical gradients in the blood determine the presence of the therapeautic effect. Blood is drawn from the rat after oral delivery of salmon calcitonin and the anionic nanoparticles of poly(methacrylic acid) and blood ionized calcium concentration is measured using calcium electrodes [78].
8.7. Radioactive labeling
Gamma scintigraphy is another in vivo analysis technique that is beneficial due to its ability to monitor real time transit of particles based on Technetium labeling. This method enables visualization and quantification of particles moving through the GI tract after oral delivery (Fig. 3). Although gamma scintigraphy is typically noninvasive, the GI organ of interest can be removed and analyzed for greater accuracy. This method requires the nanoparticles to be labeled with a gamma-emitting radioisotope [79–81]. The isotope is chosen based on several factors including radiation energy and half-life. Metal ion nuclides present the most suitable radioisotopes for gamma scintigraphy; the most commonly used radioisotope is technetium (99mTc), which has a low radiation dose and a short half-life of 6 h. Labeling the particles with the radioisotopes can be done in multiple ways. One method, used to label particles with technetium, requires a non-absorbable chelate such as 99mTc-DTPA [80]. Another way of labeling nanoparticles is the use of Na99mTcO4 solution, which involves ion exchange between the particle and the anionic 99mTcO4 to achieve a radiolabeled particle [82]. A gamma camera, with a 40 cm sodium iodide crystal activated with thallium [80], images the GI tract for the presence of technetium and the images are analyzed using software such as Siemens MicroDELTA Clinic software by manually delineating regions and counting the radioactivity in each region [79]. One of the primary drawbacks to the use of gamma scintigraphy is the radiation exposure [83], which is an important consideration in the use of this technique for in vivo human studies. Other disadvantages of this method are that it can be an invasive procedure and there is some instability of the labeling causing radioactive elements to leak into other parts of the body [71]. Despite these risks, gamma scintigraphy has been used in the medical field for imaging with chromium-51 labeling [84], showing its trustworthiness in clinical applications.
Fig. 3.
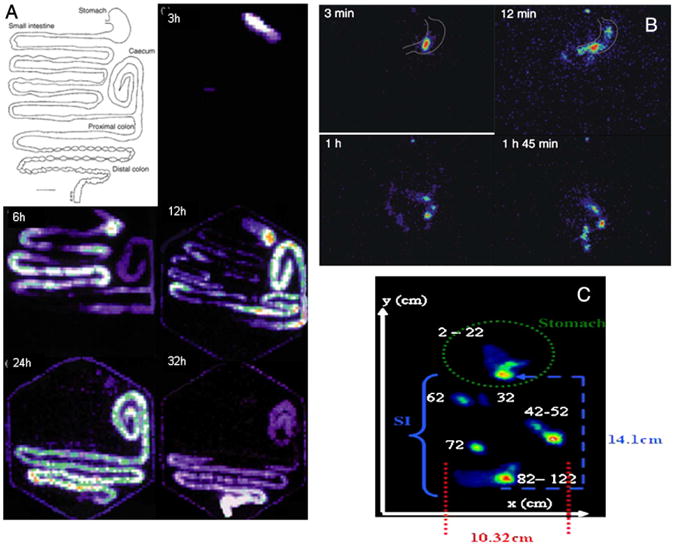
(A) Drawing of the GI tract of the common brushtail possum and gamma scintigraphy scans of GI tract after oral dosing with small (75–125 μm) radio-labeled with 99mTc exchange resin from 3 to 32 h [79]. (B) Gamma scintigraphy scans of chitosan nanoparticles in the human GI tract; at 3 min the particles remain intact, after 12 min the particle has disintegrated and the particles are moving into the small intestine, after 1 h the granules have attached to the intestinal mucosa in the lower jejunum, and after 1 h 45 min most of the granules have become detached [90]. (C) Localization of an enteric-coated magnetic tablet as determined by gamma scintigraphy from [99mTc]-DTPA labeling. Pictured is the x- and y-plane of the small intestine (SI) and stomach at the 111 min of acquisition [83].
Alternatives to gamma scintigraphy that use radiolabeling are single-photon emission computed tomography/computed tomography (SPECT-CT) and positron emission tomography (PET). These two imaging techniques differ from scintigraphy because they result in 3D images with high resolution and correction of attenuation. The imaging techniques differ from each other because SPECT-CT instrumentation measures single photon release from radioisotopes while PET measures positron release [85]. In two studies using SPECT-CT to evaluated biodistribution, various gamma-emitting isotopes (such as 99mTc, 123I, 125I, and 133I) were used to track movement of multiple components at once. In one study, a nanoparticle containing chitosan and poly(γ-glutamic acid) was loaded with aspart-insulin and radiolabeled with 99mTc while the drug alone was labeled with 123I. The biodistribution after oral administration was observed using dual isotope dynamic SPECT-CT and can be seen in Fig. 4. The images showed the progression of the nanoparticles from the stomach to the small intestine to the large intestine, while the drug was shown in the kidneys and the urinary bladder, indicating a more rapid clearance of the drug [86]. In a later study, the same group showed that increased permeation in the intestines by chitosan did not increase the absorption of toxic lipopolysaccharides after oral administration of chitosan nanoparticles. SPECT-CT was used to show that 99mTc-labeled lipopolysaccharides remained within the GI tract after administration of chitosan nanoparticles [87]. The imaging provided by SPECT-CT and PET provide clear, 3D images for cases in which scintigraphy may not be informative.
Fig. 4.
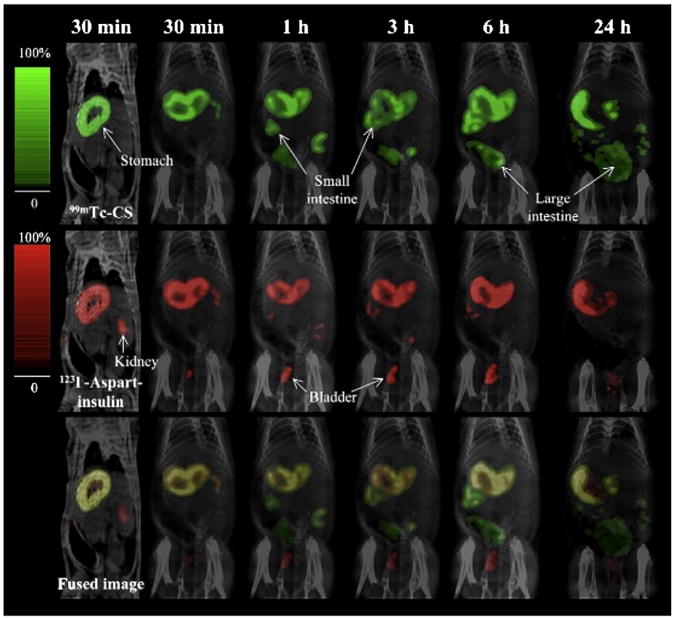
Biodistribution of 99mTc-pertechnetate-labeled chitosan (99mTc-CS) and 123iodine-labeled aspart-insulin (123I-aspart-insulin) nanoparticles after oral administration to a rat [86].
8.8. IVIS
Another technique for in vivo analysis after oral delivery is a form of optical imaging termed IVIS. This technique allows for in vivo imaging without radiation. IVIS is an optical imaging technique that uses fluorescence and results in a high signal-to-noise ratio due to the low bioluminescence of mammalian tissue. For application in oral delivery with nanoparticles, the nanoparticles can be labeled with fluorescent markers such as Sulforhodamine B or Cy5.5 [88,89]. In one study by Chen et. al., the biodistribution of modified nanostructured lipid carriers (NLCs) labeled with Sulforhodamine B was determined using IVIS. Results from IVIS showed that the NLCs with Myverol achieved higher retention due to the observance of fluorescently labeled nanoparticles in the abdominal area of the rat [88]. [88]. Lee et. al. used IVIS to study biodistribution of nano- and submicron-scaled zinc-oxide (ZnO) nanoparticles labeled with a monoreactive hydroxysuccinimide ester of Cy5.5 (Cy5.5-NHS). IVIS imaging showed a strong signal of Cy5.5-conjugated ZnO nanoparticles in the kidney and liver. By imaging the animal at different time points, the particle movement was tracked, and the results from this study showed that the nano-scaled ZnO nanoparticles moved through the GI tract faster than the submicron-scaled ZnO nanoparticles [89]. If further biodistribution studies are desired, the organs can be removed from the animal after IVIS and further imaging can be done on the individual organs (Fig. 5).
Fig. 5.

IVIS images of Spraque–Dawley rats after oral administration of (A) Cy5.5-NHS (fluorescent label alone); (B) nano-scaled Cy5.5-conjugated ZnO nanoparticles; (C) submicron-scaled Cy5.5-conjugated ZnO nanoparticles after 1, 2, 3, 5, and 7 h [89].
9. Conclusion
The oral route presents many obstacles for the delivery of biologics, from the mucus lining of the GI tract to the variable acidic pH throughout the gastric system. Nanoparticle-mediated delivery may minimize degradation of the cargo, extend retention time in the GI tract, and enhance transport to the systemic circulation. The process of experimentation of nanoparticles for oral delivery begins with the modeling of in vivo characteristics through the use of various in vitro methods. This is typically followed by a range of in situ, ex vivo, and in vivo techniques for validation. This review covers the most commonly used models in the field to date. An intrinsic shortcoming of all the models so far is their non-human nature, which renders extrapolation to human studies unreliable. Recent advances in tissue engineering enable creation of biomimetic models constructed from multicellular tissues of human cell sources integrated with physiologically relevant flows. Such models can be expected to accelerate the progress of the exciting field of nanoparticle-mediated oral delivery of biologics.
Footnotes
This review is part of the Advanced Drug Delivery Reviews theme issue on “Nanoparticle- and biomaterials-mediated oral delivery for drug, gene, and immunotherapy”.
References
- 1.Cleland JL, Daugherty A, Mrsny R. Emerging protein delivery methods. Curr Opin Biotechnol. 2001;12:212–219. doi: 10.1016/s0958-1669(00)00202-0. [DOI] [PubMed] [Google Scholar]
- 2.Jinturkar KA, Rathi MN, Misra A. 3 – gene delivery using physical methods. In: Ambikanandan M, editor. Challenges in Delivery of Therapeutic Genomics and Proteomics. Elsevier; London: 2011. pp. 83–126. [Google Scholar]
- 3.Wang B, Feng W, Zhu M, Wang Y, Wang M, Gu Y, Ouyang H, Wang H, Li M, Zhao Y, Chai Z, Wang H. Neurotoxicity of low-dose repeatedly intranasal instillation of nano-and submicron-sized ferric oxide particles in mice. J Nanopart Res. 2009;11:41–53. [Google Scholar]
- 4.Donnelly RF, Raj Singh TR, Woolfson AD. Microneedle-based drug delivery systems: microfabrication, drug delivery, and safety. Drug Deliv. 2010;17:187–207. doi: 10.3109/10717541003667798. [DOI] [PMC free article] [PubMed] [Google Scholar]
- 5.Cui-shuan W, Xue-qing W, Meng M, Ming-guang L, Hua Z, Xuan Z, Jian-cheng W, Tao W, Wen-hui N, Qiang Z. Effects of pH-sensitive nanoparticles prepared with different polymers on the distribution, adhesion and transition of Rhodamine 6 G in the gut of rats. J Microencapsul. 2010;27:205–217. doi: 10.1080/02652040903059163. [DOI] [PubMed] [Google Scholar]
- 6.Sezgin Z, Yuksel N, Baykara T. Investigation of pluronic and PEG-PE micelles as carriers of meso-tetraphenyl porphine for oral administration. Int J Pharm. 2007;332:161–167. doi: 10.1016/j.ijpharm.2006.09.030. [DOI] [PubMed] [Google Scholar]
- 7.Lin YH, Chung CK, Chen CT, Liang HF, Chen SC, Sung HW. Preparation of nanoparticles composed of chitosan/poly-γ-glutamic acid and evaluation of their permeability through caco-2 cells. Biomacromolecules. 2005;6:1104–1112. doi: 10.1021/bm049312a. [DOI] [PubMed] [Google Scholar]
- 8.Evans DF, Pye G, Bramley R, Clark AG, Dyson TJ, Hardcastle JD. Measurement of gastrointestinal pH profilesin normal ambulant human subjects. Gut. 1988;29:1035–1041. doi: 10.1136/gut.29.8.1035. [DOI] [PMC free article] [PubMed] [Google Scholar]
- 9.O'Neill MJ, Bourre L, Melgar S, O'Driscoll CM. Intestinal delivery of non-viral gene therapeutics: physiological barriers and preclinical models. Drug Discov Today. 2011;16:203–218. doi: 10.1016/j.drudis.2011.01.003. [DOI] [PubMed] [Google Scholar]
- 10.Yamada T, et al. Textbook of Gastroenterology. Blackwell Publishing Ltd; Hoboken, NJ: 2009. [Google Scholar]
- 11.Iain C. The mouth, stomach and intestines, Anaesth. Intensive Care Med. 2009;10:336–338. [Google Scholar]
- 12.Gregory M. Digestive System. Clinton Community College; [Access date was March 14, 2012]. [Google Scholar]
- 13.Allen A, Shary D. The structure and function of gastric mucus. Gut. 1972;13:666–672. doi: 10.1136/gut.13.8.666. [DOI] [PMC free article] [PubMed] [Google Scholar]
- 14.Lai SK, Wang YY, Hanes J. Mucus-penetrating nanoparticles for drug and gene delivery to mucosal tissues. Adv Drug Deliv Rev. 2009;61:158–171. doi: 10.1016/j.addr.2008.11.002. [DOI] [PMC free article] [PubMed] [Google Scholar]
- 15.Creamer B. The turnover of the epithelium of the small intestine. Br Med Bull. 1967;23:226–230. doi: 10.1093/oxfordjournals.bmb.a070561. [DOI] [PubMed] [Google Scholar]
- 16.Ensign LM, Cone R, Hanes J. Oral drug delivery with polymeric nanoparticles: The gastrointestinal mucus barriers. Advanced Drug Delivery Reviews. 2012 doi: 10.1016/j.addr.2011.12.009. [DOI] [PMC free article] [PubMed] [Google Scholar]
- 17.Enslin GM, Hamman JH, Kotze AF. Oral delivery of peptide drugs: barriers and developments. BioDrugs. 2005;19:165+. doi: 10.2165/00063030-200519030-00003. [DOI] [PubMed] [Google Scholar]
- 18.Pade V, Stavchansky S. Estimation of the relative contribution of the transcellular and paracellular pathway to the transport of passively absorbed drugs in the Caco-2 cell culture model. Pharm Res. 1997;14:1210–1215. doi: 10.1023/a:1012111008617. [DOI] [PubMed] [Google Scholar]
- 19.Borchard G, Lueβen HL, de Boer AG, Verhoef JC, Lehr CM, Junginger HE. The potential of mucoadhesive polymers in enhancing intestinal peptide drug absorption. III: Effects of chitosan-glutamate and carbomer on epithelial tight junctions in vitro. J Control Release. 1996;39:131–138. [Google Scholar]
- 20.Smith J, Wood E, Dornish M. Effect of chitosan on epithelial cell tight junctions. Pharm Res. 2004;21:43–49. doi: 10.1023/b:pham.0000012150.60180.e3. [DOI] [PubMed] [Google Scholar]
- 21.Ranaldi G, Marigliano I, Vespignani I, Perozzi G, Sambuy Y. The effect of chitosan and other polycations on tight junction permeability in the human intestinal Caco-2 cell line. J Nutr Biochem. 2002;13:157–167. doi: 10.1016/s0955-2863(01)00208-x. [DOI] [PubMed] [Google Scholar]
- 22.Garnett MC, Kallinteri P. Nanomedicines and nanotoxicology: some physiological principles. Occup Med. 2006;56:307–311. doi: 10.1093/occmed/kql052. [DOI] [PubMed] [Google Scholar]
- 23.Schneeberger EE, Lynch RD. The tight junction: a multifunctional complex. Am J Physiol Cell Physiol. 2004;286:C1213–C1228. doi: 10.1152/ajpcell.00558.2003. [DOI] [PubMed] [Google Scholar]
- 24.Lozier JN, Yankaskas JR, Ramsey WJ, Chen L, Berschneider H, Morgan RA. Gut epithelial cells as targets for gene therapy of hemophilia. Hum Gene Ther. 1997;8:1481–1490. doi: 10.1089/hum.1997.8.12-1481. [DOI] [PubMed] [Google Scholar]
- 25.Rieux Ad, Ragnarsson EGE, Gullberg E, Préat V, Schneider YJ, Artursson P. Transport of nanoparticles across an in vitro model of the human intestinal follicle associated epithelium. European Journal of Pharmaceutical Sciences. 2005:455–465. doi: 10.1016/j.ejps.2005.04.015. [DOI] [PubMed] [Google Scholar]
- 26.Hase K, Kawano K, Nochi T, Pontes GS, Fukuda S, Ebisawa M, Kadokura K, Tobe T, Fujimura Y, Kawano S, Yabashi A, Waguri S, Nakato G, Kimura S, Murakami T, Iimura M, Hamura K, Fukuoka SI, Lowe AW, Itoh K, Kiyono H, Ohno H. Uptake through glycoprotein 2 of FimH+bacteria by M cells initiates mucosal immune response. Nature. 2009;462:226–230. doi: 10.1038/nature08529. [DOI] [PubMed] [Google Scholar]
- 27.Ramesan RM, Sharma CP. Challenges and advances in nanoparticle-based oral insulin delivery. Expert Rev Med Devices. 2009;6:665+. doi: 10.1586/erd.09.43. [DOI] [PubMed] [Google Scholar]
- 28.Kawashima Y, Yamamoto H, Takeuchi H, Kuno Y. Mucoadhesive DL-lactide/glycolide copolymer nanospheres coated with chitosan to improve oral delivery of elcatonin. Pharm Dev Technol. 2000;5:77. doi: 10.1081/pdt-100100522. [DOI] [PubMed] [Google Scholar]
- 29.Lamprecht Aea. Low molecular weight heparin nanoparticles: mucoadhesion and behaviour in Caco-2 cells. Nanotechnology. 2006;17:3673–3680. [Google Scholar]
- 30.Adler AF, Leong KW. Emerging links between surface nanotechnology and endocytosis: Impact on nonviral gene delivery. Nano Today. 2010;5:553–569. doi: 10.1016/j.nantod.2010.10.007. [DOI] [PMC free article] [PubMed] [Google Scholar]
- 31.Trapp S, Rosania GR, Horobin RW, Kornhuber J. Quantitative modeling of selective lysosomal targeting for drug design. Eur Biophys J. 2008;37:1317–1328. doi: 10.1007/s00249-008-0338-4. [DOI] [PMC free article] [PubMed] [Google Scholar]
- 32.Glangchai LC, Caldorera-Moore M, Shi L, Roy K. Nanoimprint lithography based fabrication of shape-specific, enzymatically-triggered smart nanoparticles. J Control Release. 2008;125:263–272. doi: 10.1016/j.jconrel.2007.10.021. [DOI] [PubMed] [Google Scholar]
- 33.Wu CS, Wang XQ, Meng M, Li MG, Zhang H, Zhang X, Wang JC, Wu T, Nie WH, Zhang Q. Effects of pH-sensitive nanoparticles prepared with different polymers on the distribution, adhesion and transition of Rhodamine 6 G in the gut of rats. J Microencapsul. 2010;27:205–217. doi: 10.1080/02652040903059163. [DOI] [PubMed] [Google Scholar]
- 34.Tahara K, Samura S, Tsuji K, Yamamoto H, Tsukada Y, Bando Y, Tsujimoto H, Morishita R, Kawashima Y. Oral nuclear factor-κB decoy oligonucleotides delivery system with chitosan modified poly(d, l-lactide-co-glycolide) nanospheres for inflammatory bowel disease. Biomaterials. 2011;32:870–878. doi: 10.1016/j.biomaterials.2010.09.034. [DOI] [PubMed] [Google Scholar]
- 35.Fievez V, Plapied L, des Rieux A, Pourcelle V, Freichels H, Wascotte V, Vanderhaeghen ML, Jerôme C, Vanderplasschen A, Marchand-Brynaert J, Schneider YJ, Préat V. Targeting nanoparticles to M cells with non-peptidic ligands for oral vaccination. Eur J Pharm Biopharm. 2009;73:16–24. doi: 10.1016/j.ejpb.2009.04.009. [DOI] [PubMed] [Google Scholar]
- 36.Hossen MN, Kajimoto K, Akita H, Hyodo M, Harashima H. Vascular-targeted nanotherapy for obesity: Unexpected passive targeting mechanism to obese fat for the enhancement of active drug delivery. J Control Release. 2012;163:101–110. doi: 10.1016/j.jconrel.2012.09.002. [DOI] [PubMed] [Google Scholar]
- 37.Vllasaliu D, Alexander C, Garnett M, Eaton M, Stolnik S. Fc-mediated transport of nanoparticles across airway epithelial cell layers. J Control Release. 2012;158:479–486. doi: 10.1016/j.jconrel.2011.12.009. [DOI] [PubMed] [Google Scholar]
- 38.Kim JH, Kim YS, Park K, Kang E, Lee S, Nam HY, Kim K, Park JH, Chi DY, Park RW, Kim IS, Choi K, Chan Kwon I. Self-assembled glycol chitosan nanoparticles for the sustained and prolonged delivery of antiangiogenic small peptide drugs in cancer therapy. Biomaterials. 2008;29:1920–1930. doi: 10.1016/j.biomaterials.2007.12.038. [DOI] [PubMed] [Google Scholar]
- 39.C Incorporated, Transwell® Permeable Supports Selection and Use Guide, in, USA. 2010 [Google Scholar]
- 40.Plapied L, Vandermeulen G, Vroman B, Préat V, des Rieux A. Bioadhesive nanoparticles of fungal chitosan for oral DNA delivery. Int J Pharm. 2010;398:210–218. doi: 10.1016/j.ijpharm.2010.07.041. [DOI] [PubMed] [Google Scholar]
- 41.Mittal G, Carswell H, Brett R, Currie S, Kumar MNVR. Development and evaluation of polymer nanoparticles for oral delivery of estradiol to rat brain in a model of Alzheimer's pathology. J Control Release. 2011;150:220–228. doi: 10.1016/j.jconrel.2010.11.013. [DOI] [PubMed] [Google Scholar]
- 42.Trapani A, Lopedota A, Franco M, Cioffi N, Ieva E, Garcia-Fuentes M, Alonso MJ. A comparative study of chitosan and chitosan/cyclodextrin nanoparticles as potential carriers for the oral delivery of small peptides. Eur J Pharm Biopharm. 2010;75:26–32. doi: 10.1016/j.ejpb.2010.01.010. [DOI] [PubMed] [Google Scholar]
- 43.Cui F, Shi K, Zhang L, Tao A, Kawashima Y. Biodegradable nanoparticles loaded with insulin–phospholipid complex for oral delivery: preparation, in vitro characterization and in vivo evaluation. J Control Release. 2006;114:242–250. doi: 10.1016/j.jconrel.2006.05.013. [DOI] [PubMed] [Google Scholar]
- 44.Lin YH, Sonaje K, Lin KM, Juang JH, Mi FL, Yang HW, Sung HW. Multi-ion-crosslinked nanoparticles with pH-responsive characteristics for oral delivery of protein drugs. J Control Release. 2008;132:141–149. doi: 10.1016/j.jconrel.2008.08.020. [DOI] [PubMed] [Google Scholar]
- 45.Patel N, Forbes B, Eskola S, Murray J. Use of simulated intestinal fluids with Caco-2 cells and rat ileum. Drug Dev Ind Pharm. 2006;32:151–161. doi: 10.1080/03639040500465991. [DOI] [PubMed] [Google Scholar]
- 46.Ingels F, Deferme S, Destexhe E, Oth M, Van den Mooter G, Augustijns P. Simulated intestinal fluid as transport medium in the Caco-2 cell culture model. Int J Pharm. 2002;232:183–192. doi: 10.1016/s0378-5173(01)00897-3. [DOI] [PubMed] [Google Scholar]
- 47.Sahana DK, Mittal G, Bhardwaj V, Kumar MNVR. PLGA nanoparticles for oral delivery of hydrophobic drugs: Influence of organic solvent on nanoparticle formation and release behavior In Vitro and In Vivo using estradiol as a model drug. J Pharm Sci. 2008;97:1530–1542. doi: 10.1002/jps.21158. [DOI] [PubMed] [Google Scholar]
- 48.Italia JL, Bhatt DK, Bhardwaj V, Tikoo K, Kumar MNVR. PLGA nanoparticles for oral delivery of cyclosporine: nephrotoxicity and pharmacokinetic studies in comparison to Sandimmune Neoral®. J Control Release. 2007;119:197–206. doi: 10.1016/j.jconrel.2007.02.004. [DOI] [PubMed] [Google Scholar]
- 49.Avgoustakis K, Beletsi A, Panagi Z, Klepetsanis P, Karydas AG, Ithakissios DS. PLGA–mPEG nanoparticles of cisplatin: in vitro nanoparticle degradation, in vitro drug release and in vivo drug residence in blood properties. J Control Release. 2002;79:123–135. doi: 10.1016/s0168-3659(01)00530-2. [DOI] [PubMed] [Google Scholar]
- 50.Behrens I, Stenberg P, Artursson P, Kissel T. Transport of lipophilic drug molecules in a new mucus-secreting cell culture model based on HT29-MTX cells. Pharm Res. 2001;18:1138–1145. doi: 10.1023/a:1010974909998. [DOI] [PubMed] [Google Scholar]
- 51.Dong Y, Feng SS. Poly(d, l-lactide-co-glycolide)/montmorillonite nanoparticles for oral delivery of anticancer drugs. Biomaterials. 2005;26:6068–6076. doi: 10.1016/j.biomaterials.2005.03.021. [DOI] [PubMed] [Google Scholar]
- 52.Mi FL, Wu YY, Lin YH, Sonaje K, Ho YC, Chen CT, Juang JH, Sung HW. Oral delivery of peptide drugs using nanoparticles self-assembled by poly(γ-glutamic acid) and a chitosan derivative functionalized by trimethylation. Bioconjug Chem. 2008;19:1248–1255. doi: 10.1021/bc800076n. [DOI] [PubMed] [Google Scholar]
- 53.McClean S, Prosser E, Meehan E, O'Malley D, Clarke N, Ramtoola Z, Brayden D. Binding and uptake of biodegradable poly-dl-lactide micro- and nanoparticles in intestinal epithelia. Eur J Pharm Sci. 1998;6:153–163. doi: 10.1016/s0928-0987(97)10007-0. [DOI] [PubMed] [Google Scholar]
- 54.Artursson P, Palm K, Luthman K. Caco-2 monolayers in experimental and theoretical predictions of drug transport. Adv Drug Deliv Rev. 2001;46:27–43. doi: 10.1016/s0169-409x(00)00128-9. [DOI] [PubMed] [Google Scholar]
- 55.Sutton SC, Forbes AE, Cargill R, Hochman JH, LeCluyse EL. Simultaneous <i> in vitro measurement of intestinal tissue permeability and transepithelial electrical resistance TEER using sweetana–grass diffusion cells. Pharm Res. 1992;9:316–319. doi: 10.1023/a:1015878516157. [DOI] [PubMed] [Google Scholar]
- 56.Narai A, Arai S, Shimizu M. Rapid decrease in transepithelial electrical resistance of human intestinal Caco-2 cell monolayers by cytotoxic membrane perturbents. Toxicol Vitr. 1997;11:347–354. doi: 10.1016/s0887-2333(97)00026-x. [DOI] [PubMed] [Google Scholar]
- 57.Walter E, Janich S, Roessler BJ, Hilfinger JM, Amidon GL. HT29-MTX/Caco-2 cocultures as an in vitro model for the intestinal epithelium: in vitro–in vivo correlation with permeability data from rats and humans. J Pharm Sci. 1996;85:1070–1076. doi: 10.1021/js960110x. [DOI] [PubMed] [Google Scholar]
- 58.Mahler GJ, Shuler ML, Glahn RP. Characterization of Caco-2 and HT29-MTX cocultures in an in vitro digestion/cell culture model used to predict iron bioavailability. J Nutr Biochem. 2009;20:494–502. doi: 10.1016/j.jnutbio.2008.05.006. [DOI] [PubMed] [Google Scholar]
- 59.des Rieux A, Fievez V, Théate I, Mast J, Préat V, Schneider YJ. An improved in vitro model of human intestinal follicle-associated epithelium to study nanoparticle transport by M cells. Eur J Pharm Sci. 2007;30:380–391. doi: 10.1016/j.ejps.2006.12.006. [DOI] [PubMed] [Google Scholar]
- 60.Gullberg E, Leonard M, Karlsson J, Hopkins AM, Brayden D, Baird AW, Artursson P. Expression of Specific Markers and Particle Transport in a New Human Intestinal M-Cell Model: Volume 279, Number 3 (2000), pages 808–813. Biochemical and Biophysical Research Communications. 2001;281:1063. doi: 10.1006/bbrc.2000.4038. [DOI] [PubMed] [Google Scholar]
- 61.Kernéis S, Bogdanova A, Kraehenbuhl JP, Pringault E. Conversion by Peyer's patch lymphocytes of human enterocytes into M Cells that transport bacteria. Science. 1997;277:949–952. doi: 10.1126/science.277.5328.949. [DOI] [PubMed] [Google Scholar]
- 62.Kim HJ, Huh D, Hamilton G, Ingber DE. Human gut-on-a-chip inhabited by microbial flora that experiences intestinal peristalsis-like motions and flow. Lab Chip. 2012;12:2165–2174. doi: 10.1039/c2lc40074j. [DOI] [PubMed] [Google Scholar]
- 63.Lehr CM, Bouwstra JA, Kok W, De Boer AG, Tukker JJ, Verhoef JC, Breimer DD, Junginger HE. Effects of the mucoadhesive polymer polycarbophil on the intestinal absorption of a peptide drug in the rat. J Pharm Pharmacol. 1992;44:402–407. doi: 10.1111/j.2042-7158.1992.tb03633.x. [DOI] [PubMed] [Google Scholar]
- 64.Lueβen HL, Rentel CO, Kotzé AF, Lehr CM, de Boer AG, Verhoef JC, Junginger HE. Mucoadhesive polymers in peroral peptide drug delivery. IV. Polycarbophil and chitosan are potent enhancers of peptide transport across intestinal mucosae in vitro. J Control Release. 1997;45:15–23. [Google Scholar]
- 65.Chakraborty S, Shukla D, Mishra B, Singh S. Lipid – an emerging platform for oral delivery of drugs with poor bioavailability. Eur J Pharm Biopharm. 2009;73:1–15. doi: 10.1016/j.ejpb.2009.06.001. [DOI] [PubMed] [Google Scholar]
- 66.Cryan SA, O'Driscoll CM. Mechanistic studies on nonviral gene delivery to the intestine using <i> in vitro differentiated cell culture models and an <i> in vivo rat intestinal loop. Pharm Res. 2003;20:569–575. doi: 10.1023/a:1023286413666. [DOI] [PubMed] [Google Scholar]
- 67.Desai MP, Labhasetwar V, Amidon GL, Levy RJ. Gastrointestinal uptake of biodegradable microparticles: effect of particle size. Pharm Res. 1996;13:1838–1845. doi: 10.1023/a:1016085108889. [DOI] [PubMed] [Google Scholar]
- 68.Lv H, Wang G, Wu X, Xie L, Huang C, Li H, Liang Y, Hao H, Sun J. Transport characteristics of ginkgolide B by Caco-2 cells and examination of ginkgolide B oral absorption potential using rat in situ intestinal loop method. Int J Pharm. 2008;351:31–35. doi: 10.1016/j.ijpharm.2007.09.026. [DOI] [PubMed] [Google Scholar]
- 69.Damgé C, Maincent P, Ubrich N. Oral delivery of insulin associated to polymeric nanoparticles in diabetic rats. J Control Release. 2007;117:163–170. doi: 10.1016/j.jconrel.2006.10.023. [DOI] [PubMed] [Google Scholar]
- 70.Pappo J, Ermak TH. Uptake and translocation of fluorescent latex particles by rabbit Peyer's patch follicle epithelium: a quantitative model for M cell uptake. Clin Exp Immunol. 1989;76:144–148. [PMC free article] [PubMed] [Google Scholar]
- 71.Florence D. Evaluation of nano- and microparticle uptake by the gastrointestinal tract. Adv Drug Deliv Rev. 1998;34:221–233. doi: 10.1016/s0169-409x(98)00041-6. [DOI] [PubMed] [Google Scholar]
- 72.Chen J, Yang WL, Li G, Qian J, Xue JL, Fu SK, Lu DR. Transfection of mEpo gene to intestinal epithelium in vivo mediated by oral delivery of chitosan-DNA nanoparticles. World J Gastroenterol. 2004;10:112–116. doi: 10.3748/wjg.v10.i1.112. [DOI] [PMC free article] [PubMed] [Google Scholar]
- 73.Ma W, Rogers K, Zbar B, Schmidt L. Effects of different fixatives on β-galactosidase activity. J Histochem Cytochem. 2002;50:1421–1424. doi: 10.1177/002215540205001015. [DOI] [PubMed] [Google Scholar]
- 74.Bowman K, Sarkar R, Raut S, Leong KW. Gene transfer to hemophilia A mice via oral delivery of FVIII–chitosan nanoparticles. J Control Release. 2008;132:252–259. doi: 10.1016/j.jconrel.2008.06.019. [DOI] [PMC free article] [PubMed] [Google Scholar]
- 75.Dhadwar SS, Kiernan J, Wen J, Hortelano G. Repeated oral administration of chitosan/DNA nanoparticles delivers functional FVIII with the absence of antibodies in hemophilia A mice. J Thromb Haemost. 2010;8:2743–2750. doi: 10.1111/j.1538-7836.2010.04116.x. [DOI] [PubMed] [Google Scholar]
- 76.Roy K, Mao HQ, Huang SK, Leong KW. Oral gene delivery with chitosan–DNA nanoparticles generates immunologic protection in a murine model of peanut allergy. Nat Med. 1999;5:387–391. doi: 10.1038/7385. [DOI] [PubMed] [Google Scholar]
- 77.Verma D, Moghimi B, LoDuca PA, Singh HD, Hoffman BE, Herzog RW, Daniell H. Oral deliveryof bioencapsulated coagulation factor IX prevents inhibitor formation and fatal anaphylaxis in hemophilia B mice. Proc Natl Acad Sci. 2010;107:7101–7106. doi: 10.1073/pnas.0912181107. [DOI] [PMC free article] [PubMed] [Google Scholar]
- 78.Sakuma S, Suzuki N, Kikuchi H, Hiwatari Ki, Arikawa K, Kishida A, Akashi M. Oral peptide delivery using nanoparticles composed of novel graft copolymers having hydrophobic backbone and hydrophilic branches. Int J Pharm. 1997;149:93–106. [Google Scholar]
- 79.McDowell A, Nicoll JJ, McLeod BJ, Tucker IG, Davies NM. Gastrointestinal transit in the common brushtail possum measured by gamma scintigraphy. Int J Pharm. 2005;302:125–132. doi: 10.1016/j.ijpharm.2005.06.026. [DOI] [PubMed] [Google Scholar]
- 80.Wilding IR, Coupe AJ, Davis SS. The role of γ-scintigraphy in oral drug delivery. Adv Drug Deliv Rev. 2001;46:103–124. doi: 10.1016/s0169-409x(00)00135-6. [DOI] [PubMed] [Google Scholar]
- 81.Parmentier J, Thewes B, Gropp F, Fricker G. Oral peptide delivery by tetraether lipid liposomes. Int J Pharm. 2011;415:150–157. doi: 10.1016/j.ijpharm.2011.05.066. [DOI] [PubMed] [Google Scholar]
- 82.Theodorakis MC. External scintigraphy in measuring rate of gastric-emptying in beagles. Am J Physiol. 1980;239:G39–G43. doi: 10.1152/ajpgi.1980.239.1.G39. [DOI] [PubMed] [Google Scholar]
- 83.Goodman K, Hodges LA, Band J, Stevens HNE, Weitschies W, Wilson CG. Assessing gastrointestinal motility and disintegration profiles of magnetic tablets by a novel magnetic imaging device and gamma scintigraphy. Eur J Pharm Biopharm. 2010;74:84–92. doi: 10.1016/j.ejpb.2009.01.004. [DOI] [PubMed] [Google Scholar]
- 84.Reba RC, Goodenough David J, Davidson Harold F. In: Diagnostic imaging in medicine. Reba RC, editor. Martinus Nijhoff Publishers; The Netherlands: 1983. [Google Scholar]
- 85.Ollinger JM, Fessler JA. Positron-emission tomography. Signal Proc Mag IEEE. 1997;14:43–55. [Google Scholar]
- 86.Sonaje K, Lin KJ, Wey SP, Lin CK, Yeh TH, Nguyen HN, Hsu CW, Yen TC, Juang JH, Sung HW. Biodistribution, pharmacodynamics and pharmacokinetics of insulin analogues in a rat model: oral delivery using pH-Responsive nanoparticles vs. subcutaneous injection. Biomaterials. 2010;31:6849–6858. doi: 10.1016/j.biomaterials.2010.05.042. [DOI] [PubMed] [Google Scholar]
- 87.Sonaje K, Lin KJ, Tseng MT, Wey SP, Su FY, Chuang EY, Hsu CW, Chen CT, Sung HW. Effects of chitosan-nanoparticle-mediated tight junction opening on the oral absorption of endotoxins. Biomaterials. 2011;32:8712–8721. doi: 10.1016/j.biomaterials.2011.07.086. [DOI] [PubMed] [Google Scholar]
- 88.Chen CC, Tsai TH, Huang ZR, Fang JY. Effects of lipophilic emulsifiers on the oral administration of lovastatin from nanostructured lipid carriers: physicochemical characterization and pharmacokinetics. Eur J Pharm Biopharm. 2010;74:474–482. doi: 10.1016/j.ejpb.2009.12.008. [DOI] [PubMed] [Google Scholar]
- 89.Lee CM, Jeong HJ, Yun KN, Kim DW, Sohn MH, Lee JK, Jeong J, Lim ST. Optical imaging to trace near infrared fluorescent zinc oxide nanoparticles following oral exposure. Int J Nanomedicine. 2012;7:3203–3209. doi: 10.2147/IJN.S32828. [DOI] [PMC free article] [PubMed] [Google Scholar]
- 90.Säkkinen M, Marvola J, Kanerva H, Lindevall K, Ahonen A, Marvola M. Are chitosan formulations mucoadhesive in the human small intestine? An evaluation based on gamma scintigraphy. Int J Pharm. 2006;307:285–291. doi: 10.1016/j.ijpharm.2005.10.021. [DOI] [PubMed] [Google Scholar]