

Abstract
We apply desorption electrospray ionization mass spectrometry imaging (DESI-MSI) to provide an in situ lipidomic profile of genetically modified tissues from a conditional transgenic mouse model of MYC-induced hepatocellular carcinoma (HCC). This unique, label-free approach of combining DESI-MSI with the ability to turn specific genes on and off has led to the discovery of highly specific lipid molecules associated with MYC-induced tumor onset. We are able to distinguish normal from MYC-induced malignant cells. Our approach provides a strategy to define a precise molecular picture at a resolution of about 200 microns that may be useful in identifying lipid molecules that define how the MYC oncogene initiates and maintains tumorigenesis.
The MYC oncogene is one of the most common causes of human tumorigenesis.1 MYC is a transcription factor that regulates gene expression which coordinates proliferation and growth through the modulation of cellular programs and metabolism. MYC has been shown to specifically regulate DNA, RNA, and protein and energy metabolism.2 MYC’s influence on lipid metabolism is less clear.3 Recently, the Felsher laboratory has exploited conditional transgene models employing the Tet system as a powerful biomedical tool to examine the role of MYC oncogene expression in vivo4–6 in the initiation and maintenance of tumorigenesis.1,5 We have exploited these conditional models to dramatically illustrate how oncogene activation initiates tumorigenesis and how suppression of oncogene expression can result in tumor regression.
Various modalities have been employed to interrogate tissue-specific changes in chemical composition. One of the most widely used methods for identifying gene-regulated chemical changes in tissues is high performance liquid chromatography (HPLC) coupled to mass spectrometry (MS).7 However, HPLC-MS techniques cannot obtain information with micrometer-scale resolution, making it difficult to identify molecular changes in the tumor and its microenvironment. Clinical imaging methods such as magnetic resonance imaging, positron emission tomography, and immunostaining have even lower resolution (approximately 1 mm3) and require fluorescent or radioisotope labels, which prevent identification of unknown molecular species.8 Hence, none of these methods provide a strategy for the microscopic in situ examination of molecular species in a cancer specimen.
Desorption electrospray ionization mass spectrometry imaging (DESI-MSI)9–11 has been demonstrated to be a valuable tool in classifying various tissues and disease stages based on lipid profiles,12,13 providing insight into the biochemical mechanisms operating in vivo. We extend the capabilities of DESI-MSI by connecting the on and off states of gene expression in vivo with lipid composition. These results provide the first in situ molecular analysis of MYC-induced tumor onset and MYC-inactivation associated tumor regression, employing a conditional transgene of MYC-induced HCC (Fig. 1). We have achieved micrometer-scale spatial resolution14 that allowed us to identify specific lipid molecules that are associated with increased MYC expression, distinguishing normal from cancer tissue, as well as identifying lipid molecules associated with tumor regression induced by MYC inactivation. Hence, DESI-MSI may be useful for identifying changes in lipid composition that will enable the definition of the mechanisms by which oncogenes initiate tumorigenesis and the suppression of the oncogene initiates tumor regression.
Figure 1.
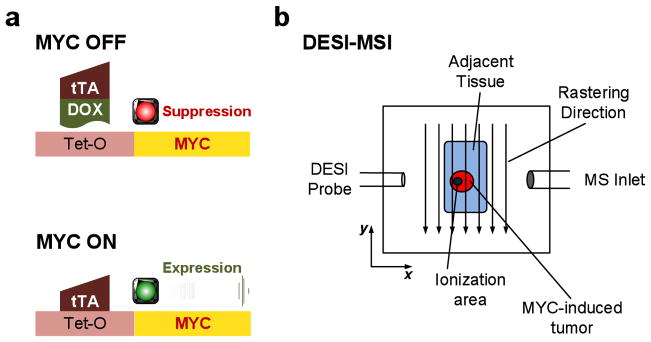
Experimental setup: (a) scheme showing the use of doxycycline (DOX) to regulate transcription of MYC; and (b) DESI-MSI experimental setup for detecting lipid species in MYC-activated hepatocellular carcinomas (red) and in the adjacent tissue (green). The impacting DESI spray solvent droplets (blue dots) desorb lipid species from the tissue into the mass spectrometer for analysis as a function of position.
Our goal was to use DESI-MSI to identify lipid molecules associated with oncogene-induced tumor onset and oncogene-inactivation-induced tumor regression. We employed the Tet system to conditionally induce MYC oncogene expression in murine hepatocytes using well established methods.1 In this system, the transactivating protein (tTA) binds to a Tet-mediated gene promoter sequence (Tet-O) that results in human MYC expression in the absence but not the presence of doxycycline (DOX); see Fig. 1a). In this model MYC activation initiates tumor formation within 2 months, causes tumors within 4 months, and upon MYC inactivation induces sustained tumor regression within 2 months, associated with the reversal of tumorigenesis and the presence of histologically normal appearing liver but the presence of dormant tumor cells.
Hence, we generated liver tissue sections from mice under several conditions (See Figure 2): (a) MYC was not activated (WT; 6 weeks of age); (b) MYC was activated for 2 months and was associated with early HCC onset (MYC ON/2); (c) MYC was activated for 4 months and associated with well-established HCC tumors (MYC ON/4); and (d) MYC was activated for 4 months inducing HCC and then inactivated for 3 months, inducing tumor regression (MYC ON/4-OFF/3). Hematoxylin and eosin (H&E) staining was used to define tumor foci for MYC ON/2 (blue regions; purple regions represent ‘normal’ tissue), that occupy almost the entire liver by 4 months (Fig. 2a). As expected, tumor regression was observed for MYC ON/4-OFF/3 samples, (Fig. 2a). Notably, H&E stains allow visual identification of tumor regions, but it cannot provide information about the molecular species that are up- or down-regulated in cancer progression, which could be critical to understanding the mechanisms of oncogene induced tumor formation and oncogene inactivation tumor regression.
Figure 2.

DESI-MSI images of liver tissue sections from MYC-induced HCC in conditional transgenic mice. (a) From left to right: wild type (WT); MYC activated for 2 months (MYC ON/2); MYC activated for 4 months (MYC ON/4); and, MYC activated for 4 months and then deactivated for 3 months (MYC ON/4-OFF/3). The color bar to the right of the images shows the intensity scale; all images were normalized to the same absolute intensity. (b) Hematoxylin and eosin (H&E) stains of serial sections for the same MYC activation/deactivation periods shown in (a). (c) Single-stage DESI-MSI spectrum; the inset shows a zoomed-in view of the peak at m/z 771.5208, which corresponds to PG 18:1/18:2. (d) Chemical structure of PG 18:1/18:2 (inset) and multi-stage mass spectrum showing product ions produced from dissociation of the species at m/z 771.5208. The inset shows one of the isomeric lipids (phosphatidylglycerol 18:1/18:2) at m/z 771.5208.
Next, we used DESI-MSI to identity and define the spatial orientation of specific lipid species on frozen sections of tissue placed on an XY translation stage, connected to an Orbitrap15 high-resolution mass spectrometer. As the XY translation stage moves, solvent microdroplets from the nebulizing DESI source impact the tissue, extracting chemical species into secondary microdroplets that travel to the mass spectrometer (the solvent was a 1:1 mixture by volume of acetonitrile and N,N-dimethylformamide; this solvent composition was chosen because it allows multiple analyses of the same tissue).16 Negative ion mass spectra were acquired as a function of position, yielding a chemical image; Fig. 2b. A representative DESI-MSI single-stage mass spectrum (Fig. 2c) was associated with three distinct lipid regions that contain ion signals associated with fatty acids (FA; m/z 150 – m/z 400), [lipid – head group – H]− fragment ions, fatty acid dimer ions (m/z 400 – m/z 700), and intact lipids (m/z 700 – m/z 1000). The unambiguous definition of the high-resolution mass spectra was possible based on low-resolution multi-stage mass spectrometry (MSn; acquired using an LTQ linear ion trap mass spectrometer, on the same tissue section used for high-resolution experiments). Details of the method and what materials were used has been placed in supplementary information.
Our approach identified tumor-specific lipids, illustrated for the species at m/z 771.5208 in Figure 2. This species was up-regulated approximately 100-fold in tumor foci (MYC ON/2), ~20 in the adjacent tissue, ~300 at later stages of the disease (MYC ON/4) compared to the WT (Fig. 2a and Table S1). This was determined by comparing the normalized sum of the intensities at each point within the tissue regions of interest, suggesting that this molecular species may be up-regulated by MYC (see SI and Figure S1 for description of normalization procedure). For MYC ON/4-OFF/3, the intensity of m/z 771.5208 decreases to a level that is similar to WT, suggesting that oncogene inactivation leads to phenotypes typical of WT. Importantly, the DESI-MSI images were concordant with the optical images of H&E stains (Fig. 2b) providing additional confirmation of the results from the DESI-MSI studies. A critical advantage of the DESI-MSI analysis is that it does not require the use of labels. In addition, comparison of images in Figure S1 shows that absolute intensities were reproducible, varying by only ~30% for images acquired on different days and for different sections.
To identify specific lipid species, we utilized a lipid database search17 using high mass accuracy measurements identifies the species at m/z 771.5208 (the exact mass of the neutral molecule, [771.5208 + H] = 772.5286 Da, was entered into the text-based search engine using a mass tolerance of 0.01 Da). The lipid database search mass tolerance = 0.01 Da. The search is performed using the mass of the neutral molecule, that is 772.53 Da) as a phosphotidylglycerol (PG) having 36 carbons and 3 double bonds (Fig. 2d). The observation of fragment ions corresponded to [FA – H]− where FA represents fatty acid [M – H – R2CO2H]−, and [M – H – R′2CH=C=O]− where R1 and R2 correspond to the FA chains in the intact molecule18 in product ion spectra (Fig. 2d) illustrating that the ionic species at m/z 771.5208 corresponds to the isomeric PGs 18:1/18:2. This notation represents the number of carbon atoms of double bonds for one fatty acid chain/number of carbon atoms:number of double bonds for the second fatty acid chain followed by the lipid class), 18:0/18:3, 18:1/18:2, and 16:1/20:2. The most abundant FA fragments are m/z 279 and m/z 281, which corresponded to [18:2 FA - H]− and [18:1 FA - H], respectively. For the species at m/z 771.5208, m/z values 491, 509, and 419 in product ion spectra correspond to [M - H - R2CO2H]−, [M - H - R′2CH=C=O]−, [M - H - R2CO2H - 74]− (where R1 = 18:1 FA, R2 = 18:2 FA, and m/z 74 = glycerol head group) confirming this identification. The relative abundances of the FA fragment ions in product ion spectra suggest an isomeric composition of 1%, 3%, 95%, and 1%, respectively. From this point forward, the species at a specific m/z will be referred to by the most abundant isomer.
We examined whether specific lipid species are correlated with MYC expression and in the case of the PG 18:1/18:2 component, the results are quite suggestive and have been provided in the supplementary material. This work illustrates that DESI-MSI can identify specific lipids that correspond to the on/off state of specific genes. Hence, DESI-MSI measurements may be useful to interrogate the biochemical mechanisms by which oncogenes such as MYC initiate and maintain tumorigenesis as well as identify specific molecular species that may serve as important biomarkers of tumor onset.
Supplementary Material
Acknowledgments
The work of the Zare research group was supported by the Air Force Office of Scientific Research (FA 9550-10-1-0235) and the work of the Felsher research group was supported by NIH RO1 grant number CA 089305, 105102, National Cancer Institute’s In-vivo Cellular and Molecular Imaging Center grant number CA 114747, Integrative Cancer Biology Program grant number CA 112973, NIH/NCI PO1 grant number CA034233, the Leukemia and Lymphoma Society Translational Research grant number R6223-07 We also thank Pavel Aronov and Allis Chien (Stanford University Mass Spectrometry) for providing access to mass spectrometers. R.H.P. thanks the Center for Molecular Analysis and Design (Stanford University) for financial support. We also value the helpful comments provided by members of the Zare and Felsher laboratories.
References
- 1.Arvanitis C, Felsher DW. Semin Cancer Biol. 2006;16:313–317. doi: 10.1016/j.semcancer.2006.07.012. [DOI] [PubMed] [Google Scholar]
- 2.Cole MD, Cowling VH. Nature Reviews. 2008;9:810–815. doi: 10.1038/nrm2467. [DOI] [PMC free article] [PubMed] [Google Scholar]
- 3.Menendez JA, Lupu R. Nat Rev Cancer. 2007;7:763–777. doi: 10.1038/nrc2222. [DOI] [PubMed] [Google Scholar]
- 4.Braselmann S, Graninger P, Busslinger M. Proc Natl Acad Sci USA. 1993;90:1657–1661. doi: 10.1073/pnas.90.5.1657. [DOI] [PMC free article] [PubMed] [Google Scholar]
- 5.Gossen M, Bujard H. Ann Rev Genet. 2002;36:153–173. doi: 10.1146/annurev.genet.36.041002.120114. [DOI] [PubMed] [Google Scholar]
- 6.Gossen M, Freundlieb S, Bender G, Muller G, Hillen W, Bujard H. Science. 1995;268:1766–1769. doi: 10.1126/science.7792603. [DOI] [PubMed] [Google Scholar]
- 7.Aebersold R, Goodlett DR. Chem Rev. 2001;101:269–295. doi: 10.1021/cr990076h. [DOI] [PubMed] [Google Scholar]
- 8.Amstalden van Hove ER, Smith DF, Heeren RMA. J Chromatogr A. 2010;1217:3946–3954. doi: 10.1016/j.chroma.2010.01.033. [DOI] [PubMed] [Google Scholar]
- 9.Wiseman JM, Ifa DR, Song Q, Cooks RG. Angew Chemie Int Ed. 2006;45:7188–7192. doi: 10.1002/anie.200602449. [DOI] [PubMed] [Google Scholar]
- 10.Wu C, Dill AL, Eberlin LS, Cooks RG, Ifa DR. Mass Spectrom Rev. 2012 doi: 10.1002/mas. [DOI] [PMC free article] [PubMed] [Google Scholar]
- 11.Harris GA, Galhena AS, Fernandez FM. Anal Chem. 2011;83:4508–4538. doi: 10.1021/ac200918u. [DOI] [PubMed] [Google Scholar]
- 12.Eberlin LS, Ferreira CR, Dill AL, Ifa DR, Cooks RG. Biochimica et Biophysica Acta. 2011;1811:946–960. doi: 10.1016/j.bbalip.2011.05.006. [DOI] [PMC free article] [PubMed] [Google Scholar]
- 13.Eberlin LS, Norton I, Orringer D, Dunn IF, Liu X, Ide JL, Jarmusch AK, Ligon KL, Jolesz FA, Golby AJ, Santagata S, Agar NY, Cooks RG. Proc Nat Acad Sci USA. 2013;110:1611–1616. doi: 10.1073/pnas.1215687110. [DOI] [PMC free article] [PubMed] [Google Scholar]
- 14.Kertesz V, Van Berkel GJ. Rapid Commun Mass Spectrom. 2008;22:2639–2644. doi: 10.1002/rcm.3662. [DOI] [PubMed] [Google Scholar]
- 15.Perry RH, Cooks RG, Noll R. J Mass Spectrom Rev. 2008;27:661–699. doi: 10.1002/mas.20186. [DOI] [PubMed] [Google Scholar]
- 16.Eberlin LS, Ferreira CR, Dill AL, Ifa DR, Cheng L, Cooks RG. ChemBioChem. 2011;12:2129–2132. doi: 10.1002/cbic.201100411. [DOI] [PMC free article] [PubMed] [Google Scholar]
- 17.www.lipidmaps.org
- 18.Hsu FF, Turk J. J Chromatogr B. 2009;877:2673–2695. doi: 10.1016/j.jchromb.2009.02.033. [DOI] [PMC free article] [PubMed] [Google Scholar]
Associated Data
This section collects any data citations, data availability statements, or supplementary materials included in this article.