
Figure 6.
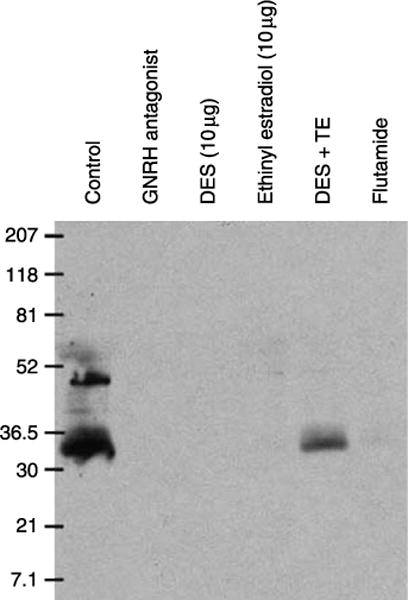
Western blot showing downregulation of AQP9 in epididymis of 25-day-old rats by different hormonal treatments. A strong band at ~30–35 kDa is present in total epididymal homogenate membrane of control animals. Additional, higher molecular weight bands probably represent different glycosylation states of AQP9. AQP9 was not detectable in the GNRHa-, DES- and EE-treated groups. In the DES+TE-treated animals, a brighter AQP9 band was detected compared to DES treatment alone. A very faint AQP9 band was detected in the flutamide-treated group. Each well was loaded with the same amount of protein (Fisher et al. 2002).