

Abstract
Adaptive thermogenesis allows mammals to resist to cold. For instance, in brown adipose tissue (BAT) the facultative uncoupling of the proton gradient from ATP synthesis in mitochondria is used to generate systemic heat. However, this system necessitates an increase of the Uncoupling protein 1 (Ucp1) and its activation by free fatty acids. Here we show that mice without functional Period2 (Per2) were cold sensitive because their adaptive thermogenesis system was less efficient. Upon cold-exposure, Heat shock factor 1 (HSF1) induced Per2 in the BAT. Subsequently, PER2 as a co-activator of PPARα increased expression of Ucp1. PER2 also increased Fatty acid binding protein 3 (Fabp3), a protein important to transport free fatty acids from the plasma to mitochondria to activate UCP1. Hence, in BAT PER2 is important for the coordination of the molecular response of mice exposed to cold by synchronizing UCP1 expression and its activation.
Abbreviations: Adrβ3, beta-adrenergic receptor 3; BAT, brown adipose tissue; BMAL1, brain and muscle ARNT-like factor; ChIP, chromatin immunoprecipitation; CLOCK, circadian locomotor output cycles kaput; FABP3, fatty acid binding protein 3; FFA, free fatty acids; HSE, heat shock element; HSF1, heat shock factor 1; luc, luciferase; NPAS2, neuronal PAS-domain containing protein 2; Per2, Period2; PGC-1, PPAR-coactivator -1; PPAR, peroxisome proliferator-activated receptor; PPRE, PPAR element; RXR, retinoid X receptor; SCN, suprachiasmatic nuclei; TAG, triglycerides; UCP1, uncoupling protein 1; WAT, white adipose tissue; WT, wild-type; ZT, zeitgeber time
Keywords: Brown adipose tissue, Humidity, Season
1. Introduction
In homeothermic animals such as mammals, body temperature is kept within a narrow range in spite of large environmental temperature fluctuations. An average body temperature is maintained by continuous correction of the body temperature by thermoregulatory centers located in the preoptic anterior hypothalamus arranging behavioral and autonomous body temperature responses [1]. This homeostatic regulation is achieved through feedback mechanisms that control heat loss and production, resulting in small variations of temperature around the average. In addition, the circadian clock regulates daily temperature fluctuations by acting on thermoregulatory centers in the brain. Body temperature rises during the activity phase and falls during the rest phase [2]. Thus, daily fluctuations in body temperature are the result of a continuous interplay between circadian and homeostatic mechanisms.
Over a day and over a year the interplay between circadian and homeostatic mechanisms experiences changes with the factors light, temperature and humidity as major variables. Day-length appears to affect phase distribution of oscillating neurons in the SCN [3] and thyroid hormone (TH) availability in the hypothalamus by regulating TH deiodinases (Dio) [4]. Temperature increase can lead to the denaturation of proteins. The denatured polypeptides compete for binding to the heat-shock protein (HSP90) with heat-shock factor 1 (HSF1), thereby liberating HSF1 from the HSP90/HSF1 complex [5]. Subsequently, free HSF1 forms a homotrimer, which binds to heat shock elements (HSEs) in promoters of HSF1 target genes. Furthermore, HSF1 has circadian activity [6] and compounds that specifically inhibit its function block the ability of heat pulses to shift the phases of peripheral clocks [7]. To evoke such a shift requires changes in the oscillations of central clock genes in peripheral tissues. Interestingly, HSF1 is not only activated by a heat shock but also by a cold pulse [8]. A recent study identified the clock component Per2 as a potential target gene of HSF1 [9]. The Per2 promoter contains HSEs necessary to synchronize Per2 rhythms to a heat shock pulse in vitro, linking the heat shock response to the circadian clock mechanism.
Adaptive thermogenesis, also referred to as facultative thermogenesis, is defined as heat production in response to environmental temperature (or diet) and serves the purpose of protecting the organism from cold (or regulating energy balance after changes in diet). Cold sensed by the brain leads to activation of sympathetic nerves resulting in the release of noradrenaline and binding of it to beta-adrenergic receptors on the cells of BAT. This leads to acute and chronic effects changing metabolism in BAT [10]. A portion of the acute response to cold is due to shivering, however, with adaptation shivering disappears quite rapidly in rodents [11] and other mechanisms in BAT become dominant. These mechanisms involve stimulation of lipolysis and increase in activity and production of UCP1, a mitochondrial inner-membrane protein that uncouples proton entry from ATP synthesis to generate heat [12].
Since we observed that mice mutant in the clock gene Per2 may be less cold resistant in a natural wild environment [13] we set out to investigate adaptive thermogenesis in Per2 mutant mice in the laboratory. We present evidence that Per2 is a target of HSF1 in vivo and is involved in the regulation of adaptive thermogenesis via modulation of Ucp1 activity and transcription. Surprisingly, the mode of this regulation in animals appears to be strongly dependent on external conditions such as humidity and temperature that probably reflect seasonal changes.
2. Materials and methods
2.1. Animals
Animal care and handling was performed according to the Swiss Federal law for animal protection authorized by the Office Veterinaire Cantonal de Fribourg (FR13_010). Wild-type and Per2Brdm1 littermate mice were housed under a 12 h light/12 h dark cycle. Per2Brdm1 mice harbor an in frame deletion of exon 10 of the Per2 gene (part of PAS domain) yielding an unstable protein. The mice were bred on a 129S5/C57BL/6-Tyrc-Brd mixed background [17]. Water and standard rodent chow was provided ad libitum. Cold exposure experiments were performed with animals held under specific conditions in the animal facility: room temperature average was 21 °C and the humidity average was 30%. For temperature and humidity profiles see Figure S4.
2.2. Cold exposure of mice
Mice were 10–12 weeks old at the time of experimentation. Mice were exposed to 4 °C for 2, 4, 6, and 8 h. Before the cold exposure, mice experienced a specific food regimen. The food was removed at ZT14 two days before cold exposure. Then the food was given at ZT12 and removed again at ZT15 one day before cold exposure. On the day of cold exposure mice were transferred at ZT2 to a cold room at 4 °C without food. Skin temperature was measured with an infrared thermometer (ScanTemp 440) directed on a depilated area on the back of the mouse.
2.3. RNA extraction, reverse transcription, and real-time PCR detection
Total RNA was extracted from a piece of interscapular BAT (20–25 mg) using RNA-Bee (AMS Biotechnology). RNA was treated with RNase-free DNase I (Roche), precipitated in 4 M LiCl and purified further by phenol:chloroform extraction and ethanol precipitation. ssDNA complementary to the RNA starting from hybridized random hexamer primers was synthesized with SuperScript II (Invitrogen). SYBR green fluorescence-based real-time PCR was performed using the primers described in Table S2. All RNA samples were normalized to βActin mRNA accumulation.
2.4. Western blot analysis
Tissue (about 20 mg) was homogenized in 400 µl of BAT lysis buffer (25 mM Tris–HCl pH7.5, 1 mM EDTA pH8.0, 1% Triton-X-100, 0.5% Na-deoxycholate, 1×protease inhibitor (Roche)) twice for 30 s, 5000 rpm using a Precellys®24 machine at 4 °C. The fat layer was removed by sequential centrifugations for 10 min at 3300 rpm and three times for 10 min at 13,000 rpm. Protein concentration was determined using the BCA assay according to the manufacturer (Pierce). Samples were denatured for 15 min at 60 °C to prevent lipid aggregation. For the detection of UCP1, 30 µg of protein was separated on 12.5% SDS-PAGE and transferred to BA83 membrane. For FABP3, 60 µg of protein was separated on 15% SDS-PAGE. Primary antibodies were rabbit Anti-UCP1 1:5'000 (Abcam ab23841), rabbit Anti-Cardiac FABP/FABP3 1:250 (Abcam ab102075) and rabbit Anti-actin 1:250 (Sigma 5060). Quantification was performed using the Quantity One analysis software (BioRad). β-actin was used for normalization and relative protein levels were calculated by defining maximal protein levels as 1.
2.5. Chromatin immunoprecipitation (ChIP)
Interscapular BAT from 5 individual animals were combined per time point, homogenized in 1% formaldehyde/0.3 M sucrose, and kept for 5 min at 21 °C. Nuclei and soluble chromatin fragments were obtained by ultracentrifugation through 1.8 M sucrose cushions and sonication according to [14]. Chromatin was precipitated with antibodies raised against PER2 [15], PPARα (Abcam), HSF1 (Fisher Scientific) and BMAL1 [14]. Co-immunoprecipitated DNA was quantified with TaqMan real-time PCR using the primers and probes described in Table S2.
2.6. Luciferase reporter assays and transfections
A 2'982 bp fragment of the mouse Ucp1 promoter region or a 1'038 bp fragment of the mouse Fabp3 promoter region was cloned into the pGL3 basic vector (Promega) containing the firefly luciferase reporter gene. Full-length mouse cDNAs encoding mPparα (NM_011144.6), mRxrα (NM_011305.3), mPer2 (NM_011066.3), mBmal1 (NM_007489), mClock (NM_007715), mNpas2 (BC109166), and bacterial β-galactosidase were cloned into pSCT1. Transfection experiments were performed according to [16].
2.7. Oil-red-O staining
Interscapular BAT tissue was dissected and fixed in 10% formaldehyde in 1× PBS, incubated in 20% sucrose in 1× PBS, and frozen in isopentane. Specimens were sectioned to 7 µm thickness and treated with Oil-red-O (Sigma-Aldrich) to stain neutral lipids, and were counterstained with Mayer's hematoxylin solution (Sigma-Aldrich).
2.8. Measurement of free fatty acids in BAT
Interscapular BAT pieces (5 mg) were homogenized in 1% Triton X-100 in pure chloroform. After centrifugation, the organic phase was evaporated and dried lipids were dissolved in Fatty Acid Assay Buffer (Abcam). Free fatty acids were determined using the Free Fatty Acid Quantification Kit (Abcam).
2.9. Measurement of triglycerides in BAT
Interscapular BAT pieces (5 mg) were homogenized in 5% Triton X-100 in water. Triglycerides were solubilized by heating the samples at 100 °C for 5 min, and centrifuged to remove insoluble material. Triglycerides were determined using the Triglyceride Quantification Kit (Abcam).
2.10. Measurement of plasma metabolites
Blood was taken by retro-orbital bleeding from anesthetized mice, and plasma was separated by centrifugation and frozen. Plasma free fatty acids were determined using the Free Fatty Acid Quantification Kit (Abcam). Plasma triglycerides were determined using the Triglycerides GPO-PAP (Roche).
2.11. Statistical analysis
Statistical analysis of all experiments was performed using Prism4 software (GraphPad Software, Inc.). Significant differences between groups were determined using t-test, one- or two-way ANOVA, followed by Bonferroni's post-test. Values were considered significantly different with p<0.05 (⁎), p<0.01 (⁎⁎), or p<0.001 (⁎⁎⁎).
3. Results
3.1. PER2 is involved in the resistance to cold temperature in mice
In a previous study we observed that Per2 mutant mice (Per2Brdm1) [17] might display reduced resistance to cold temperatures in the field compared to wild-type littermates [13]. Therefore we investigated the influence of cold temperature on wild-type and Per2Brdm1 mutant mice under laboratory conditions. We kept animals under a constant photoperiod (12 h light/12 h dark) and low humidity of 30%. The low humidity conditions are likely similar to the ones that the animals would encounter in the field during the winter period (see Section 2). In order to avoid variability in feeding habits of individual animals that would affect their response to cold temperatures, animals were food restricted (see Section 2 for details) before their transfer to 4 °C at zeitgeber time (ZT) 2. All along the experiment, skin temperature was monitored every 2 h over an 8-h period. We found that wild-type animals could maintain their skin temperature at about 28 °C during this time period, whereas Per2Brdm1 mice failed to do so (Figure 1A). The control mice kept at 21 °C displayed identical skin temperature (Figure 1A). No difference in food intake was found under standard as well as food restricted conditions (Table S1). Initial body weight and cold-induced weight loss were also comparable between the two genotypes (Figures 1B and C). Interestingly, the ratio between body weight and weight of BAT after 8 h at 4 °C was increased in Per2Brdm1 mutant mice (Figure 1D), pointing to a defect in BAT physiology. Therefore we focused in the following on Per2 expression and function in BAT tissue.
Figure 1.
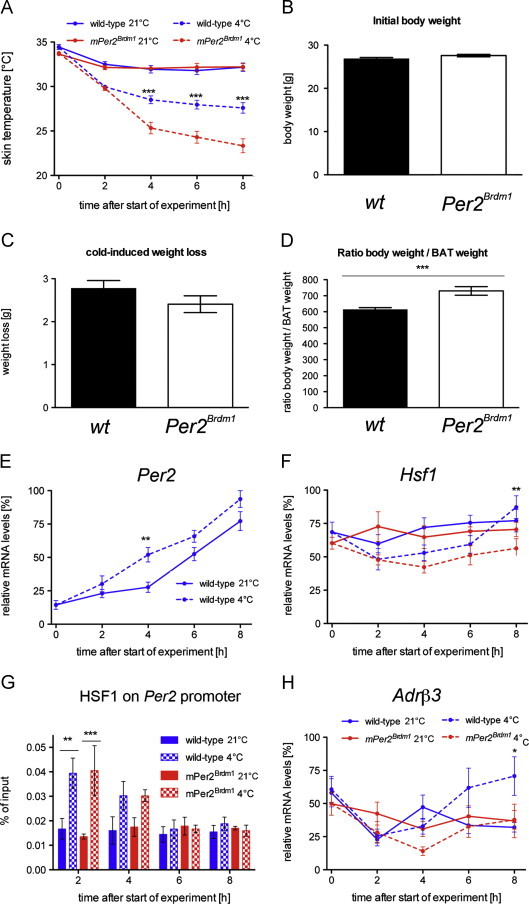
Per2Brdm1 mutant mice display a reduced resistance to cold temperature: (A) wild-type and Per2Brdm1 mice were exposed to 4 °C (n=52) or left at 21 °C (n=36) and skin temperature was measured every 2 h over 8 h. Values are means±SEM and two-way ANOVA shows a significant effect on genotype at time points 4, 6 and 8 at 4 °C (p<0.001). (B) Initial body weight of wild-type (n=104) and Per2Brdm1 mice (n=94). Values are means±SEM and Student’s t-test reveals no significant difference (p>0.05). (C) Cold-induced weight loss of wild-type (n=31) and Per2Brdm1 mice (n=16), 8 h after start of experiment. Values are means±SEM and Student’s t-test reveals no significant difference (p>0.05). (D) Ratio between body weight and weight of interscapular BAT after 8 h at 4 °C in wild-type (n=25) and Per2Brdm1 mice (n=10). Values are means±SEM and Student’s t-test shows a significant difference (p<0.001). (E) Quantitative real-time PCR analysis of Per2 in BAT in wild-type mice at 21 °C and 4 °C (n=6). Values are means±SEM and temperature significantly affects the results (p<0.001; two-way ANOVA). (F) Quantitative real-time PCR analysis of Hsf1 in BAT of wild-type and Per2Brdm1 mice at 21 °C and 4 °C (n=6). Values are means±SEM. (G) Binding of HSF1 to the Per2 promoter in BAT as revealed by ChIP. Plotted are mean values±SEM from three experiments. In wild-type and Per2Brdm1 mice, the binding of HSF1 to the Per2 promoter is significant at time point 2 h (p<0.01) as shown by two-way ANOVA. (H) Quantitative real-time PCR analysis of Adrβ3 in BAT of wild-type and Per2Brdm1 mice at 21 °C and 4 °C (n=6). Values are means±SEM and the genotypic difference at 4 °C is considered significant at time point 8 at 4 °C (p<0.05; two-way ANOVA).
Since Per2 may play a role in cold-induced thermogenesis, we assessed its expression profile in BAT under room temperature and 4 °C conditions. The overall time-dependent increase in Per2 transcription for both temperatures reflected its normal circadian expression. Per2 showed cyclic expression in BAT with a peak between ZT12 and ZT18 (Figure S1A) [18]. However, we found that Per2 expression rose faster at 4 °C than at 21 °C in wild-type mice (Figure 1E). This result would indicate that cold inducible factors might activate Per2 gene expression in BAT. A candidate for such a factor is Heat-shock factor 1 (HSF1). Interestingly, HSF1 is not only responsible for heat-induction of the cellular stress response, but it also mediates the expression of heat-shock proteins in response to cold (Figure S2A) [8,19]. Because Per2 gene induction resembles the one of immediate early genes [20] we investigated whether HSF1 is involved in the induction of Per2 under cold conditions. First, we tested whether Hsf1 transcription is induced by cold exposure in BAT. We found no significant difference between 21 °C and 4 °C as well as no significant change between the genotypes in response to cold (Figure 1F). Hence, the mechanism of induction of Per2 gene expression in response to cold is probably due to post-transcriptional activation of HSF1 [5]. Therefore we studied the binding of HSF1 to the HSEs (−1'125 and −1'279 bp upstream of the transcription start site [9]) on the Per2 promoter in BAT using chromatin immunoprecipitation (ChIP). We found that HSF1 binding was increased already 2 h after cold exposure in both wild-type and Per2Brdm1 mice, in which the Per2 promoter is still intact (Figure 1G). This indicates that a rapid change in HSF1 activity in response to cold is likely to be involved in the induction of Per2 in vivo, as it is for Hspa1a (Figure S2A). This response appeared not to be influenced by altered expression of the beta-adrenergic receptor 3 (Adrβ3) (Figures 1H and S1B), a receptor on BAT cells activated by noradrenaline released by cold sensation in the brain. After 6–8 h of cold exposure Adrβ3 expression was induced in wild-type animals, but not in Per2Brdm1 mice (Figure 1H), suggesting that PER2 may be directly or indirectly involved in the induction of Adrβ3 expression in BAT as well. This may contribute to the reduction in cold resistance [21] as observed in Per2Brdm1 mutant mice (Figure 1A).
3.2. Ucp1 expression in BAT is modulated by PER2 involving PPARα
In the mouse, UCP1 is essential for adaptive thermogenesis in response to acute cold exposure [22]. In wild-type mice exposed to cold, we observed an induction of Ucp1 after 4 h. However, Ucp1 cold-induction was significantly reduced in Per2Brdm1 mutant mice at the mRNA (Figure 2A) as well as at the protein levels (Figure 2B). This indicated that PER2 might be involved in the transcriptional regulation of Ucp1. PER2 does not directly bind to DNA, but interacts with a number of nuclear receptors [15], including PPARα, for which there are binding sites on the Ucp1 promoter [23,24]. Therefore we tested whether PER2, through its interaction potential with PPARα could modulate the transcription of Ucp1 by binding to PPREs on the enhancer of Ucp1 (around −2'500 bp). Using ChIP analysis, we detected diurnal binding of PER2 to the Ucp1 promoter at 21 °C and low humidity conditions (Figure S3A). This binding was increased after 6 h at 4 °C in the BAT of wild-type mice, which was not observed in Per2Brdm1 mutant mice (Figure 2C). Analyzing the same chromatin, binding of PPARα to the Ucp1 promoter was observed in both genotypes (Figure S3B), but was not modulated by cold exposure (Figure 2D). These data support the notion that PER2 may modulate Ucp1 expression as co-activator of PPARα, which was expressed similarly in both genotypes (Figure S1C). To test this, we analyzed PER2 binding on the Ucp1 promoter in PPARα−/− mice [25]. The binding of PER2 observed after 6 h at 4 °C in wild-type BAT was abolished in PPARα−/− mice (Figure 2E) strongly indicating that PER2 binding on the Ucp1 promoter was mediated by PPARα. Consistent with this view was our finding that Ucp1 mRNA levels did not increase in PPARα−/− mice after cold exposure compared to wild-type animals (Figure 2F). Additional evidence for the interplay between PER2 and PPARα in the regulation of Ucp1 expression was provided by in vitro transactivation experiments in HEK293 cells. We observed an induction of a Ucp1-luc reporter plasmid by the PPARα/RXRα heterodimer and a significant increase of this activation by addition of PER2 to the heterodimer (Figure 2G). Finally, we observed an even more dramatic cold intolerance of PPARα−/− mice to cold exposure (Figure 2H) compared to Per2Brdm1 mutant mice (Figure 1A). Thus, PER2 may act as a co-activator in cold-induced Ucp1 expression involving PPARα thus modulating cold-induced adaptive thermogenesis. Since PGC-1α may also be involved in PPARα mediated activation [26] we tested whether PGC-1α expression varies between wild-type and Per2Brdm1 mutant mice. Similar to RXRα (Figure S1E) we found a slight difference between the two genotypes (Figure S1F). However, over the course of one day Ucp1 expression was comparable in the two genotypes over one day under 21 °C and low humidity conditions (Figure S1G). Under acute cold exposure, there was no difference between the two genotypes regarding the levels of Rxrα and Pgc-1α (Figures S2B and C). Taken together, these observations indicated that PGC-1α and RXRα were unlikely to contribute to the differential regulation of Ucp1 observed between the two genotypes after cold exposure (Figure 2A).
Figure 2.
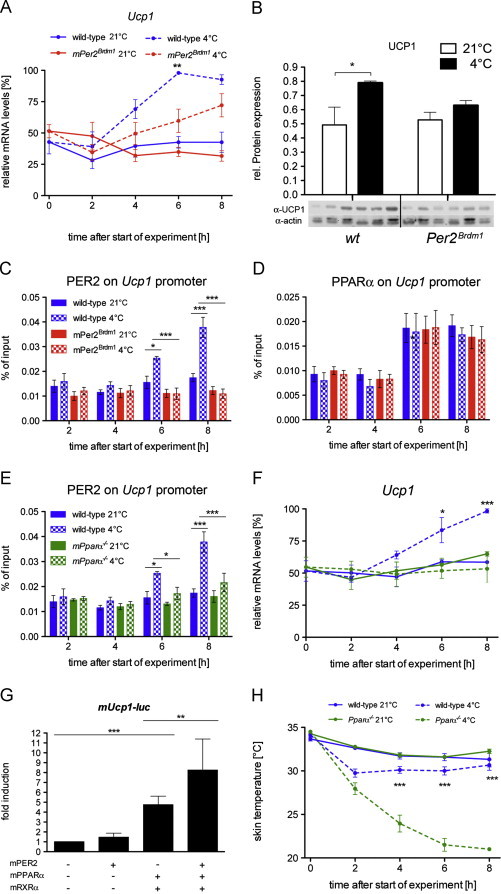
Cold-induction of Ucp1 gene and protein is reduced in the BAT of Per2Brdm1 mice: (A) quantitative real-time PCR analysis of Ucp1 in BAT of wild-type and Per2Brdm1 mice at 21 °C and 4 °C (n=6). Values are means±SEM and two-way ANOVA shows that genotypic difference at 4 °C is considered very significant (p<0.01). (B) Western blot analysis of BAT 8 h after start of the experiment. Values were normalized to actin. At 4 °C UCP1 is significantly induced (n=3, p<0.05). (C) Binding of PER2 to the Ucp1 promoter in BAT as revealed by ChIP. Plotted are mean values±SEM from three experiments. In wild-type mice, the binding of PER2 to the Ucp1 promoter is significantly increased at time points 6 h (p<0.05) and 8 h (p<0.001) as shown by two-way ANOVA. (D) Binding of PPARα to the Ucp1 promoter in BAT as revealed by ChIP. Plotted are mean values±SEM from three experiments. (E) Binding of PER2 to the Ucp1 promoter in BAT as revealed by ChIP. Plotted are mean values±SEM from three experiments. In wild-type mice, the binding of PER2 to the Ucp1 promoter is significantly increased at time points 6 h (p<0.05) and 8 h (p<0.001) as shown by two-way ANOVA. (F) Expression of Ucp1 in BAT of wild-type and PPARα−/− mice at 21 °C and 4 °C (n=3). Values are means±SEM and two-way ANOVA shows that genotypic difference at 4 °C is considered very significant (p<0.01). (G) Transcriptional regulation of the Ucp1 gene by PER2, PPARα and RXRα in HEK293 cells. Each value represents the mean±SD of six independent experiments. One-way ANOVA shows significant Ucp1 inductions by PPARα/RXRα (p<0.001) and by PPARα/RXRα/PER2 (p<0.01). (H) Wild-type and PPARα−-/-− mice were exposed to 4 °C (n=12 each genotype) or left at 21 °C (n=12 each genotype) and skin temperature was measured every 2 h over 8 h. Values are means±SEM and two-way ANOVA shows a significant effect on genotype at time points 4, 6 and 8 at 4 °C (p<0.001).
3.3. Cold treatment lowers triglyceride (TAG) levels more in Per2 mutant BAT compared to wild-type
Fatty acids play a key role in adaptive thermogenesis as the source of oxidative fuel in the mitochondria [27] for activation of UCP1. PER2 is involved in the regulation of metabolism [15], particularly in lipid metabolism [28]. In order to activate UCP1 and to produce enough heat, cold-exposed animals need free fatty acids (FFA) in brown adipocytes. Both endogenous FFA resulting from the lipolysis of stored triglyceride droplets and exogenous FFA coming from circulation are mobilized. We found that TAG levels in BAT were comparable between wild-type and Per2Brdm1 mutant animals at 21 °C (Figure 3A), which is in line with previous observations [28]. At 4 °C, however, TAG levels were severely reduced in Per2Brdm1 mutant mice after 8 h (Figure 3A). This was also visualized using oil-red-O staining on BAT sections (Figure 3C). In plasma, TAG levels were comparable between the two genotypes under both temperature conditions (Figure 3B), pointing at a defect in lipid usage specifically in BAT of Per2Brdm1 mutant mice. Interestingly, FFAs displayed similar levels at 21 °C and 4 °C in both genotypes in BAT (Figure 3D) as well as in plasma (Figure 3E). The elevated circulating FFA levels observed at 4 °C indicate that FFA release from white adipose tissue (WAT) was normal in Per2Brdm1 mice and that the defect in thermogenesis may involve inadequate utilization of these FFAs as fuel in BAT. This was supported by re-plotting the data in Figure 3D as the ratio of FFA at 21 °C/4 °C (Figure 3F). This indicated a significantly less efficient FFA utilization in BAT of Per2Brdm1 mutants compared to wild-type animals, whereas for plasma there was no difference (Figure 3G). Hence, Per2Brdm1 mutants appeared not to run out of FFAs as would be expected from the faster disappearance of TAGs in BAT (Figure 3A). Instead, the results suggested that FFA availability in mitochondria to activate UCP1 may be altered in Per2Brdm1 mutant mice which also would result in reduced β-oxidation.
Figure 3.
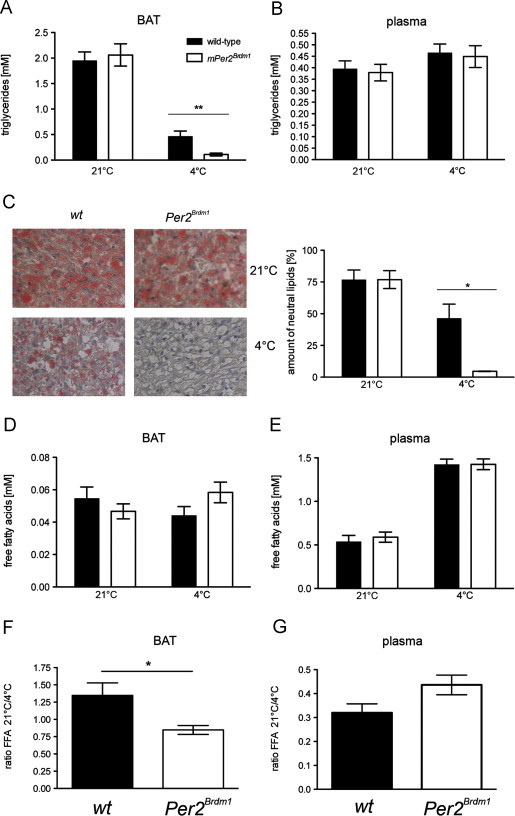
Triglycerides and free fatty acids in BAT and plasma of wild-type and Per2Brdm1 mice: (A) triglycerides in BAT at time points 6 and 8 h (n=11–12). Values are means±SEM and Student’s t-test reveals a genotypic difference at 4 °C (p<0.01). (B) Triglycerides in plasma at time points 6 and 8 h (n=8–12). Values are means±SEM. (C) Oil-red-O staining of BAT at time point 8 h. Plotted are the mean values±SEM from three independent experiments. One-way ANOVA reveals a genotypic significant difference at 4 °C (p<0.05). (D) Free fatty acids in BAT at time points 6 and 8 h (n=10–12). Values are means±SEM. (E) Free fatty acids in plasma at time points 6 and 8 h (n=10–12). Values are means±SEM. (F) Ratio of free fatty acids (FFA) at 21 °C/4 °C in BAT with data from (D), t-test p<0.05. (G) Ratio of free fatty acids (FFA) at 21 °C/4 °C in plasma with data from (E), t-test p>0.05.
3.4. Fabp3 expression in BAT is modulated by PER2 involving PPARα and BMAL1
FFA availability may be modulated by fatty acid binding proteins (FABPs). Because FFAs are insoluble in the cytoplasm they have to be transported by FABPs to their target organelles [29]. The various types of FABPs are widely expressed in the organism with Fabp3 expression found in heart, skeletal muscles and BAT and Fabp4 mainly expressed in WAT and BAT (Figures S1H and I) [30]. Fabp3 but not Fabp4 is induced in BAT of mice exposed to 4 °C [30]. We found similar results with Fabp3 transcripts (Figure 4A) and FABP3 proteins (Figure 4B) that were induced in BAT of wild-type mice after 6 and 8 h of cold exposure. This was observed to a reduced extent in Per2Brdm1 mutant animals (Figures 4A and B). In contrast, Fabp4 was not altered in its expression in BAT upon cold exposure in both genotypes (Figure 4C). Hence, PER2 may be specifically involved in the induction of Fabp3 upon cold exposure. The presence of one conserved E-box (-792 bp) and one PPRE (−897 bp) on the Fabp3 promoter represent two possibilities for PER2 to bind to it, either via PPARα and/or BMAL1. Accordingly, we tested the binding of PER2 to the Fabp3 promoter in BAT. Similar to what we observed for the Ucp1 promoter, the binding of PER2 to the Fabp3 promoter was time of day dependent (Figure S3C). Interestingly, this binding was increased after 6 h of cold exposure in wild-type mice but not in Per2Brdm1 mutants (Figure 4D). PPARα also bound to the Fabp3 promoter (Figure S3D) and its binding was not modulated in response to cold (Figure 4E). Furthermore, PER2 binding to the Fabp3 promoter was abolished in PPARα−/− mice (Figure 4F), suggesting that PER2 acts at least partially on this promoter via PPARα. Consistent with the results above, Fabp3 expression was not induced by cold in PPARα−/− mice (Figure 4G) indicating, that PPARα contributes to Fapb3 regulation in a similar fashion as observed for Ucp1.
Figure 4.
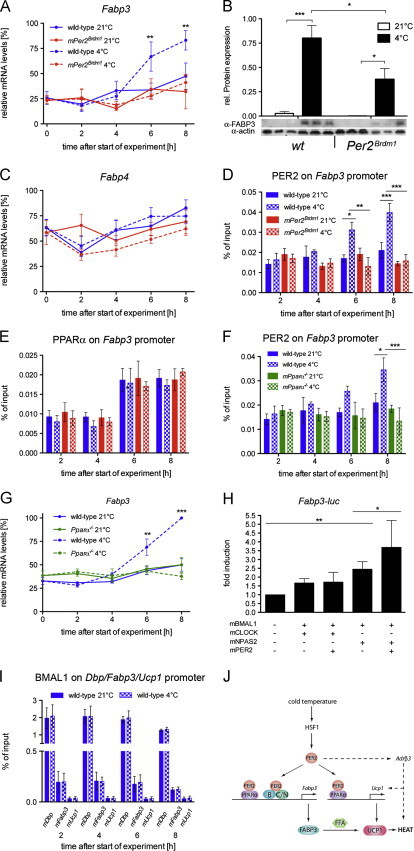
The cold-induction of Fabp3 is reduced in the BAT of Per2Brdm1 mice: (A) quantitative real-time PCR analysis of Fabp3 in BAT of wild-type and Per2Brdm1 mice at 21 °C and 4 °C (n=6). Values are means±SEM and two-way ANOVA shows that genotypic difference at 4 °C is considered extremely significant (p=0.001). (B) Western blot analysis of BAT 8 h after start of the experiment. Values were normalized to actin. At 4 °C FABP3 is significantly induced (n=3, p<0.05). This induction is significantly lower in Per2Brdm1 mice (p<0.05). (C) Quantitative real-time PCR analysis of Fabp4 in BAT of wild-type and Per2Brdm1 mice at 21 °C and 4 °C (n=6). Values are means±SEM. (D) Binding of PER2 to the Fabp3 promoter as revealed by ChIP. Plotted are mean values±SEM from three experiments. In wild-type mice, the binding of PER2 to the Fabp3 promoter is significantly increased at time points 6 h (p<0.05) and 8 h (p<0.001) as shown by two-way ANOVA. (E) Binding of PPARα to the Fabp3 promoter as revealed by ChIP. Plotted are mean values±SEM from three experiments. (F) Binding of PER2 to the Fabp3 promoter. Plotted are mean values±SEM from three experiments. In wild-type mice, the binding of PER2 to the Fabp3 promoter is significantly increased at time points 6 h (p<0.01) and 8 h (p<0.001) as shown by two-way ANOVA. (G) Expression of Fabp3 in BAT of wild-type and PPARα−-/-− mice at 21 °C and 4 °C (n=3). Values are means±SEM and two-way ANOVA shows that genotypic difference at 4 °C is significant (p<0.01). (H) Transcriptional regulation of the Fabp3 gene by BMAL1, CLOCK, NPAS2 and PER2 in NIH 3T3 cells. A luciferase reporter plasmid fused to the Fabp3 promoter was used. Each value represents the mean±SD of three independent experiments with three replicates for each experiment. One-way ANOVA shows significant Fabp3 induction by BMAL1/NPAS2 (p<0.01) and by BMAL1/NPAS2/PER2 (p<0.05). (I) Binding of BMAL1 to Dbp (positive control), Fabp3, and Ucp1 (negative control) promoters in wild-type BAT as revealed by ChIP. Values are means±SEM from two independent experiments. (J) Model suggesting the involvement of the clock protein PER2 in the transcriptional regulation of Fabp3 and Ucp1. The expression of the adrenergic receptor Adrβ3 gene is also affected by PER2 via an unknown mechanism (hatched lines). B=BMAL1, C=CLOCK, FAPB3=fatty acid binding protein 3, FFA=free fatty acids, HSF1=heat-shock factor 1, N=NPAS2, PER2=Period 2, PPARα=peroxisome proliferator activated receptor α, UCP1=uncoupling protein 1. (For interpretation of the references to color in this figure, the reader is referred to the web version of this article.)
Next we tested whether PER2 would interact with the E-box motif on the Fabp3 promoter. To this end we performed in vitro transactivation experiments. A Fabp3-luc reporter plasmid was transfected in NIH-3T3 cells together with the basic helix-loop-helix transcription factors BMAL1, CLOCK and NPAS2. We found that the BMAL1/NPAS2 complex significantly induced the transcription of Fabp3 (Figure 4H). When PER2 was added to the complex, Fabp3 transcription was even more elevated (Figure 4H). We then verified the binding of BMAL1 to the E-box on the Fabp3 promoter in vivo in BAT using ChIP. Our controls showed that BMAL1 bound to the Dbp promoter (positive control) but not to the Ucp1 promoter (negative control) (Figure 4I). We observed that BMAL1 bound to some extent to the Fabp3 promoter (Figure 4I). As expected, cold exposure did not trigger an increased binding of BMAL1 to the Fabp3 promoter (Figure 4I). Thus, it appears that PER2 may act as a positive co-factor in cold-induced Fabp3 expression not only via its interaction with PPARα [15], but also via interaction with BMAL1 [16].
4. Discussion
This study provides evidence that the circadian clock gene Per2 is involved in cold-induced adaptive thermogenesis in BAT. It appears to do so by modulating transcription of two genes, Fabp3 and Ucp1, which are both important for heat production in mitochondria. We show that under low temperature (21 °C) and low humidity (30%) conditions Per2 expression is modulated after acute cold exposure (4 °C) via HSF1 binding to its promoter. This in turn increases Ucp1 and Fabp3 expression in wild-type mice (Figure 4J), allowing these animals to withstand acute cold exposure probably by adapting heat production in BAT. In contrast, mice with a non-functional Per2 gene are not able to adapt. Our observations are in line with previous studies that show impaired cold-tolerance in mice lacking Ucp1 [22] or Fabp3 [30], whereas lack of Fabp4 seems to be less important [30]. Furthermore, transgenic mice with genetically ablated BAT are cold-intolerant [10]. This study also indicates, that PER2 exerts its action via interaction with PPARα [15] and the clock component BMAL1. Interestingly, PPARα−/− mice display a similar phenotype as Per2Brdm1 mutant mice (Figures 1A and 2H), supporting the notion that PER2 and PPARα converge on the same target genes Ucp1 (Figure 2) and Fabp3 (Figure 4) to respond to cold temperature.
PER2 may be a coordinating entity to optimize UCP1 production and activation. The amount of UCP1 in mitochondria alone would not be sufficient for increasing heat production in response to environmental cues. A factor at least as important as the quantity of UCP1 is the amount of FFAs reaching the mitochondria for the activation of UCP1. In this process FABPs are important proteins that guide the non-water soluble FFAs through the cytoplasm to mitochondria. Therefore, the coordination of UCP1 production and FFA transport via FABPs would lead to an efficient response to cold. We find that HSF1 induces Per2 in response to cold temperature and then PER2 branches on the synchronous regulation of both the Ucp1 and Fabp3 genes thus orchestrating the cold response. We performed our experiments at ZT2, because this corresponds to the beginning of the resting phase in mice. During this time feeding and muscle activity do normally contribute less to heat production and alternative mechanisms are prevailing. Since Per2 expression is low at ZT2, cold exposure at this time point has a greater effect on Per2 levels than it would have at a time point during the activity phase where Per2 levels are already high (Figure S4C). Therefore we point out that this study does not show whether the response to cold is time of day dependent.
The response to cold temperature is not only determined by the mechanisms described here. A recent study showed that cold-inducible RNA-binding protein (CIRP) modulates circadian gene expression in fibroblasts post-transcriptionally [31]. In our study, where the temperature differences between summer and winter conditions were about 2 °C, the levels of CIRP may have been different in the two conditions. This may influence the levels of PER2 protein as observed in Figure S4C. However, we do not know whether and how CIRP may affect PER2 protein expression and/or stability.
The fasting schedule before cold exposure affected the animals. This is illustrated by the lack of time dependent increase of binding of PER2 to the Ucp1 and Fabp3 promoters in the control animals at 21 °C (Figures 2C, E and 4D, F, filled blue bars). Mice kept under ad libitum conditions and 21 °C show time of day dependent binding of PER2 to these promoters (Figures S3A and C). This difference may indicate that under ambient temperature conditions and food restriction mice shift their balance of energy utilization towards β-oxidation, because ATP production is limiting under these conditions and heat production seems to be less important. However, after cold exposure, this shift towards β-oxidation appeared to be reversed in wild type mice (Figures 2C, E and 4D, F, chequerd blue bars). In contrast this cannot be observed neither in Per2 nor in Pparα mutant mice.
Adaptive thermogenesis is a complex process to which many tissues contribute. In addition to BAT activation in response to cold, vascular endothelial cell function is important for body and skin temperature regulation. For example, a defect in vasoconstriction in response to cold would lead to an increased heat loss similar to what we observed in this study. Such a defect appears to be unlikely to play a major role in Per2 mutant mice. We have shown in a previous study, that these animals have no problem in vasoconstriction but show a reduced capacity for vasodilation [32]. This indicates that increased heat loss through increased vasodilation in Per2Brdm1 mutant mice is very unlikely to cause the reduced cold resistance we observed in these animals. Furthermore, muscle metabolism can contribute to adaptive thermogenesis, although its contribution disappears quite rapidly in rodents [11]. However, Per2 mutant mice show reduced endurance of muscles [20] accompanied by increased levels of glycolytic enzymes in the anterior tibialis muscle [33]. This indicates a greater dependence of muscles in these mice on anaerobic metabolism under stress conditions. Since the mice studied here have a mutation in the Per2 gene in all tissues, including muscle, we cannot rule out contributions of defects in muscle metabolism to the phenotype described here. Since the muscle phenotype has been observed independent of humidity conditions it is unlikely that this muscle defect played a dominant role in the experiments described here. Additionally, total activity does not differ between the two genotypes [17]. Interestingly, mouse models with disrupted expression of circadian clock genes have altered sympathetic signaling (for review see [34,35]). This is also reflected in the Per2 mutant mice where we observed altered expression of Adrβ3 (Figure 1H). Therefore, it is likely that alterations in sympathetic signaling contribute to the phenotype we describe here (Figure 4J).
Of note is that the observations made in this study are valid under low humidity conditions (as encountered in winter in nature) (Figure S4A, box) [13]. If wild-type and Per2 mutant mice are kept under high humidity conditions (as usually encountered in summer, and in most mouse facilities) wild-type animals do not adapt to acute cold exposure (Figure S4B). In line with this finding is the observation that Per2 expression in wild-type mice is lower in high compared to low humidity conditions (Figure S4C), suggesting an involvement of Per2 in seasonal adaptation. The identification of the humidity-mediated signal transduction pathway regulating expression of Per2 will be a challenge for the future.
Taken together, we provide evidence that Per2 is involved in the signal transduction cascade for cold-induced thermogenesis in BAT providing a rationale why these mice were found less fit for survival under natural conditions [13].
Conflict of interest
None declared.
Acknowledgments
We thank Antoinette Hayoz and Stéphanie Baeriswyl for technical assistance. This work was supported by the Swiss National Science Foundation and the State of Fribourg.
Appendix A. Supporting information
Supplementary data associated with this article can be found in the online version at: doi:10.1016/j.molmet.2013.05.002.
Appendix A. Supporting information
Supplementary data
Supplementary data
Figure S1.
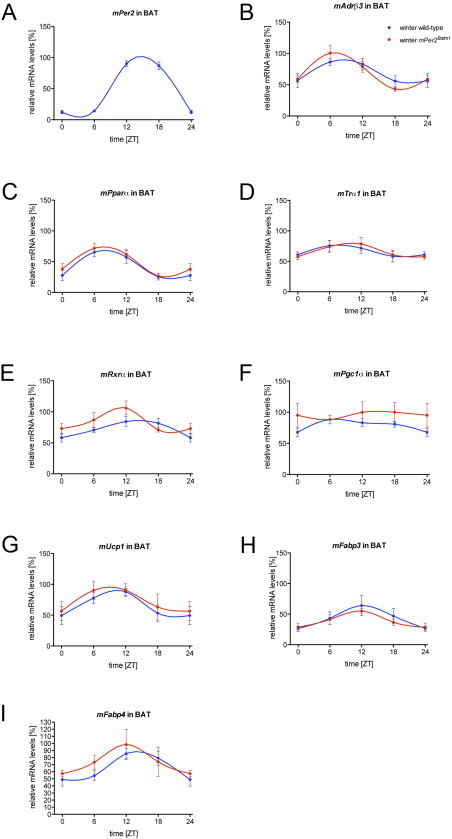
24-hour profiles of gene expression: (A)–(I) The expression of Per2, Adrβ3, Pparα, Trα, Rxrα, Pgc1α, Ucp1, Fabp3, and Fabp4 in BAT of wild-type and Per2Brdm1 mice was analyzed under standard conditions using quantitative real-time PCR (n=6). Values are means±SEM.
Figure S2.
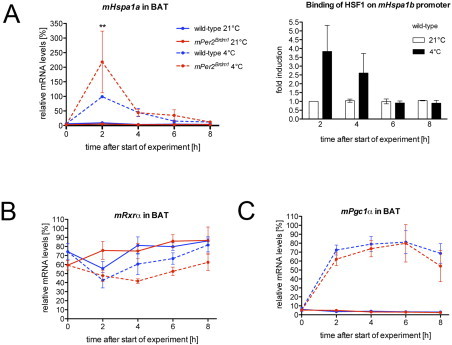
Gene expression analysis in response to cold exposure: (A) Left figure: quantitative real-time PCR analysis of Hspa1a in BAT of wild-type and Per2Brdm1 mice at 21 °C and 4 °C (n=6). Values are means±SEM. Right figure: binding of HSF1 to the Hspa1b promoter in wild-type BAT as revealed by ChIP. Plotted are mean values±SEM from two independent experiments. (B, C) Quantitative real-time PCR analysis of Rxrα and Pgc1α in BAT of wild-type and Per2Brdm1 mice at 21 °C and 4 °C (n=6). Values are means±SEM.
Figure S3.
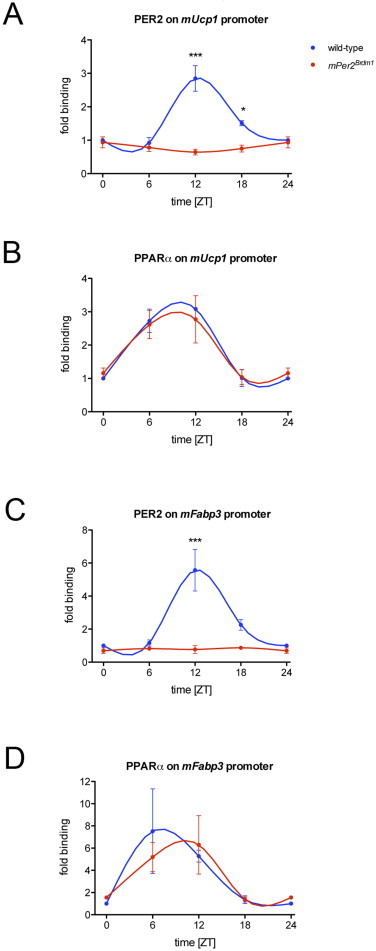
24-hour profiles showing the binding of PER2 and PPARα to the Ucp1 and Fabp3 promoters in BAT of wild-type and Per2Brdm1 mice as revealed by ChIP: (A) binding of PER2 to the Ucp1 promoter. Plotted are mean values±SEM from three independent experiments. In wild-type mice, the binding of PER2 is significantly increased at ZT12 (p<0.001) and ZT18 (p<0.05) as shown by two-way ANOVA. (B) Binding of PPARα to the Ucp1 promoter. Plotted are mean values±SEM from three independent experiments. (C) Binding of PER2 to the Fabp3 promoter. Plotted are mean values±SEM from two independent experiments. In wild-type mice, the binding of PER2 is significantly increased at ZT12 (p<0.001) as shown by two-way ANOVA. (D) Binding of PPARα to the Fabp3 promoter. Plotted are mean values±SEM from two independent experiments.
Figure S4.
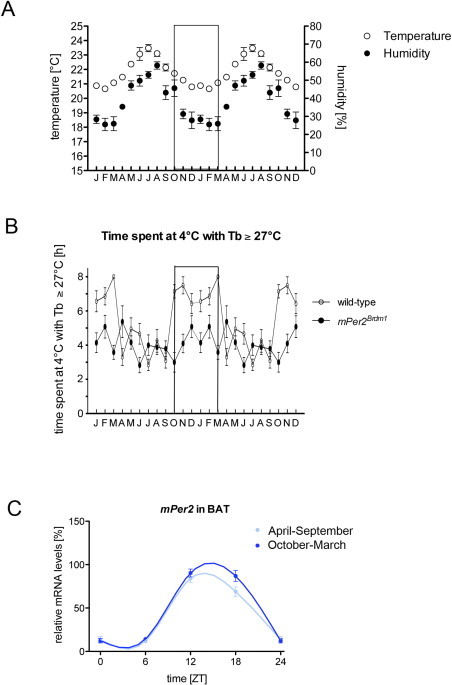
Conditions under which mice were kept in a 12 h light/12 h dark cycle throughout the year: (A) temperature and humidity over the year in the experiment. Data are double plotted to visualize the period of cold resistance of wild-type mice (box) between October and March. (B) Outside this time window wild-type animals are not cold resistant. Experiments have been performed over four consecutive years. (C) Per2 expression in BAT in wild-type mice from April to September (light blue) and from October to March (dark blue). Two-way ANOVA reveals a significant difference between the two seasons (P=0.0003, F=19.75, DFn=1, DFd=19).
References
- 1.Romanovsky A.A. Thermoregulation: some concepts have changed. Functional architecture of the thermoregulatory system. American Journal of Physiology—Regulatory, Integrative, and Comparative Physiology. 2007;292:R37–46. doi: 10.1152/ajpregu.00668.2006. [DOI] [PubMed] [Google Scholar]
- 2.Refinetti R. The circadian rhythm of body temperature. Frontiers in Bioscience. 2010;15:564–594. doi: 10.2741/3634. [DOI] [PubMed] [Google Scholar]
- 3.VanderLeest H.T., Houben T., Michel S., Deboer T., Albus H., Vansteensel M.J. Seasonal encoding by the circadian pacemaker of the SCN. Current Biology. 2007;17:468–473. doi: 10.1016/j.cub.2007.01.048. [DOI] [PubMed] [Google Scholar]
- 4.Hanon E.A., Lincoln G.A., Fustin J.M., Dardente H., Masson-Pevet M., Morgan P.J. Ancestral TSH mechanism signals summer in a photoperiodic mammal. Current Biology. 2008;18:1147–1152. doi: 10.1016/j.cub.2008.06.076. [DOI] [PubMed] [Google Scholar]
- 5.Whitesell L., Lindquist S. Inhibiting the transcription factor HSF1 as an anticancer strategy. Expert Opinion on Therapeutic Targets. 2009;13:469–478. doi: 10.1517/14728220902832697. [DOI] [PubMed] [Google Scholar]
- 6.Reinke H., Saini C., Fleury-Olela F., Dibner C., Benjamin I.J., Schibler U. Differential display of DNA-binding proteins reveals heat-shock factor 1 as a circadian transcription factor. Genes & Development. 2008;22:331–345. doi: 10.1101/gad.453808. [DOI] [PMC free article] [PubMed] [Google Scholar]
- 7.Buhr E.D., Yoo S.H., Takahashi J.S. Temperature as a universal resetting cue for mammalian circadian oscillators. Science. 2010;330:379–385. doi: 10.1126/science.1195262. [DOI] [PMC free article] [PubMed] [Google Scholar]
- 8.Matz J.M., Blake M.J., Tatelman H.M., Lavoi K.P., Holbrook N.J. Characterization and regulation of cold-induced heat shock protein expression in mouse brown adipose tissue. American Journal of Physiology. 1995;269:R38–47. doi: 10.1152/ajpregu.1995.269.1.R38. [DOI] [PubMed] [Google Scholar]
- 9.Tamaru T., Hattori M., Honda K., Benjamin I., Ozawa T., Takamatsu K. Synchronization of circadian Per2 rhythms and HSF1-BMAL1:CLOCK interaction in mouse fibroblasts after short-term heat shock pulse. PLoS One. 2011;6:e24521. doi: 10.1371/journal.pone.0024521. [DOI] [PMC free article] [PubMed] [Google Scholar]
- 10.Lowell B.B., Spiegelman B.M. Towards a molecular understanding of adaptive thermogenesis. Nature. 2000;404:652–660. doi: 10.1038/35007527. [DOI] [PubMed] [Google Scholar]
- 11.Davis T.R., Johnston D.R., Bell F.C., Cremer B.J. Regulation of shivering and non-shivering heat production during acclimation of rats. American Journal of Physiology. 1960;198:471–475. doi: 10.1152/ajplegacy.1960.198.3.471. [DOI] [PubMed] [Google Scholar]
- 12.Klingenberg M., Huang S.G. Structure and function of the uncoupling protein from brown adipose tissue. Biochimica et Biophysica Acta. 1999;1415:271–296. doi: 10.1016/s0005-2736(98)00232-6. [DOI] [PubMed] [Google Scholar]
- 13.Daan S., Spoelstra K., Albrecht U., Schmutz I., Daan M., Daan B. Lab mice in the field: unorthodox daily activity and effects of a dysfunctional circadian clock allele. Journal of Biological Rhythms. 2011;26:118–129. doi: 10.1177/0748730410397645. [DOI] [PubMed] [Google Scholar]
- 14.Ripperger J.A., Schibler U. Rhythmic CLOCK-BMAL1 binding to multiple E-box motifs drives circadian Dbp transcription and chromatin transitions. Nature Genetics. 2006;38:369–374. doi: 10.1038/ng1738. [DOI] [PubMed] [Google Scholar]
- 15.Schmutz I., Ripperger J.A., Baeriswyl-Aebischer S., Albrecht U. The mammalian clock component PERIOD2 coordinates circadian output by interaction with nuclear receptors. Genes & Development. 2010;24:345–357. doi: 10.1101/gad.564110. [DOI] [PMC free article] [PubMed] [Google Scholar]
- 16.Langmesser S., Tallone T., Bordon A., Rusconi S., Albrecht U. Interaction of circadian clock proteins PER2 and CRY with BMAL1 and CLOCK. BMC Molecular Biology. 2008;9:41. doi: 10.1186/1471-2199-9-41. [DOI] [PMC free article] [PubMed] [Google Scholar]
- 17.Zheng B., Larkin D.W., Albrecht U., Sun Z.S., Sage M., Eichele G. The mPer2 gene encodes a functional component of the mammalian circadian clock. Nature. 1999;400:169–173. doi: 10.1038/22118. [DOI] [PubMed] [Google Scholar]
- 18.Yang X., Downes M., Yu R.T., Bookout A.L., He W., Straume M. Nuclear receptor expression links the circadian clock to metabolism. Cell. 2006;126:801–810. doi: 10.1016/j.cell.2006.06.050. [DOI] [PubMed] [Google Scholar]
- 19.Cullen K.E., Sarge K.D. Characterization of hypothermia-induced cellular stress response in mouse tissues. Journal of Biological Chemistry. 1997;272:1742–1746. doi: 10.1074/jbc.272.3.1742. [DOI] [PubMed] [Google Scholar]
- 20.Albrecht U., Bordon A., Schmutz I., Ripperger J. The multiple facets of Per2. Cold Spring Harbor Symposia on Quantitative Biology. 2007;72:95–104. doi: 10.1101/sqb.2007.72.001. [DOI] [PubMed] [Google Scholar]
- 21.Cannon B., Nedergaard J. Metabolic consequences of the presence or absence of the thermogenic capacity of brown adipose tissue in mice (and probably in humans) International Journal of Obestetrics (London) 2010;34(1):S7–16. doi: 10.1038/ijo.2010.177. [DOI] [PubMed] [Google Scholar]
- 22.Enerback S., Jacobsson A., Simpson E.M., Guerra C., Yamashita H., Harper M.E. Mice lacking mitochondrial uncoupling protein are cold-sensitive but not obese. Nature. 1997;387:90–94. doi: 10.1038/387090a0. [DOI] [PubMed] [Google Scholar]
- 23.Barbera M.J., Schluter A., Pedraza N., Iglesias R., Villarroya F., Giralt M. Peroxisome proliferator-activated receptor alpha activates transcription of the brown fat uncoupling protein-1 gene. A link between regulation of the thermogenic and lipid oxidation pathways in the brown fat cell. Journal of Biological Chemistry. 2001;276:1486–1493. doi: 10.1074/jbc.M006246200. [DOI] [PubMed] [Google Scholar]
- 24.Rabelo R., Schifman A., Rubio A., Sheng X., Silva J.E. Delineation of thyroid hormone-responsive sequences within a critical enhancer in the rat uncoupling protein gene. Endocrinology. 1995;136:1003–1013. doi: 10.1210/endo.136.3.7867554. [DOI] [PubMed] [Google Scholar]
- 25.Lee S.S., Pineau T., Drago J., Lee E.J., Owens J.W., Kroetz D.L. Targeted disruption of the alpha isoform of the peroxisome proliferator-activated receptor gene in mice results in abolishment of the pleiotropic effects of peroxisome proliferators. Molecular and Cellular Biology. 1995;15:3012–3022. doi: 10.1128/mcb.15.6.3012. [DOI] [PMC free article] [PubMed] [Google Scholar]
- 26.Puigserver P., Wu Z., Park C.W., Graves R., Wright M., Spiegelman B.M. A cold-inducible coactivator of nuclear receptors linked to adaptive thermogenesis. Cell. 1998;92:829–839. doi: 10.1016/s0092-8674(00)81410-5. [DOI] [PubMed] [Google Scholar]
- 27.Guerra C., Koza R.A., Walsh K., Kurtz D.M., Wood P.A., Kozak L.P. Abnormal nonshivering thermogenesis in mice with inherited defects of fatty acid oxidation. Journal of Clinical Investigation. 1998;102:1724–1731. doi: 10.1172/JCI4532. [DOI] [PMC free article] [PubMed] [Google Scholar]
- 28.Grimaldi B., Bellet M.M., Katada S., Astarita G., Hirayama J., Amin R.H. PER2 controls lipid metabolism by direct regulation of PPARgamma. Cell Metabolism. 2010;12:509–520. doi: 10.1016/j.cmet.2010.10.005. [DOI] [PMC free article] [PubMed] [Google Scholar]
- 29.Furuhashi M., Hotamisligil G.S. Fatty acid-binding proteins: role in metabolic diseases and potential as drug targets. Nature Reviews Drug Discovery. 2008;7:489–503. doi: 10.1038/nrd2589. [DOI] [PMC free article] [PubMed] [Google Scholar]
- 30.Vergnes L., Chin R., Young S.G., Reue K. Heart-type fatty acid-binding protein is essential for efficient brown adipose tissue fatty acid oxidation and cold tolerance. Journal of Biological Chemistry. 2011;286:380–390. doi: 10.1074/jbc.M110.184754. [DOI] [PMC free article] [PubMed] [Google Scholar]
- 31.Morf J., Rey G., Schneider K., Stratmann M., Fujita J., Naef F. Cold-inducible RNA-binding protein modulates circadian gene expression posttranscriptionally. Science. 2012;338:379–383. doi: 10.1126/science.1217726. [DOI] [PubMed] [Google Scholar]
- 32.Viswambharan H., Carvas J.M., Antic V., Marecic A., Jud C., Zaugg C.E. Mutation of the circadian clock gene Per2 alters vascular endothelial function. Circulation. 2007;115:2188–2195. doi: 10.1161/CIRCULATIONAHA.106.653303. [DOI] [PubMed] [Google Scholar]
- 33.Bae K., Lee K., Seo Y., Lee H., Kim D., Choi I. Differential effects of two period genes on the physiology and proteomic profiles of mouse anterior tibialis muscles. Molecules and Cells. 2006;22:275–284. [PubMed] [Google Scholar]
- 34.Kalsbeek A., Yi C.X., Cailotto C., la Fleur S.E., Fliers E., Buijs R.M. Mammalian clock output mechanisms. Essays in Biochemistry. 2011;49:137–151. doi: 10.1042/bse0490137. [DOI] [PubMed] [Google Scholar]
- 35.Guilding C., Piggins H.D. Challenging the omnipotence of the suprachiasmatic timekeeper: are circadian oscillators present throughout the mammalian brain? European Journal of Neuroscience. 2007;25:3195–3216. doi: 10.1111/j.1460-9568.2007.05581.x. [DOI] [PubMed] [Google Scholar]
Associated Data
This section collects any data citations, data availability statements, or supplementary materials included in this article.
Supplementary Materials
Supplementary data
Supplementary data