

Abstract
Alterations in the gut microbiota have been proposed to modify the development and maintenance of obesity and its sequelae. Definition of underlying mechanisms has lagged, although the ability of commensal gut microbes to drive pathways involved in inflammation and metabolism has generated compelling, testable hypotheses. We studied C57BL/6 mice from two vendors that differ in their obesogenic response and in their colonization by specific members of the gut microbiota having well-described roles in regulating gut immune responses. We confirmed the presence of robust differences in weight gain in mice from these different vendors during high fat diet stress. However, neither specific, highly divergent members of the gut microbiota (Lactobacillus murinus, segmented filamentous bacteria) nor the horizontally transmissible gut microbiota were found to be responsible. Constitutive differences in locomotor activity were observed, however. These data underscore the importance of selecting appropriate controls in this widely used model of human obesity.
Keywords: Microbiome, Obesity, Inflammation, Metabolism, Nicotinamide nucleotide transhydrogenase
1. Introduction
Obesity has become a full-fledged pandemic [1]. Increases in obesity prevalence are expected to drive attendant increases in morbidity and mortality, as obesity is associated with diverse pernicious sequelae, including insulin resistance, type 2 diabetes, hypertension, metabolic syndrome, atherosclerotic coronary artery disease, non-alcoholic fatty liver disease and various cancers [2–5]. In light of the increasing clinical and public health burden and the limitations of current therapies, novel therapeutic approaches to obesity are clearly needed [6,7]. For this, clearer definition of the cellular and molecular mechanisms causing obesity, and the relative contribution of such mechanisms to the recent rapid increase in obesity prevalence will likely be important.
The intestinal microbiota has been proposed to be a contributory factor in the development and maintenance of obesity [8]. The observations that gnotobiotic mice are resistant to diet-induced obesity (DIO) and that transfer of gut bacteria from obese to lean mice can transfer obesity phenotypes led to studies employing high-throughput genome sequencing technologies that have reported differences in the gut microbiomes and/or metagenomes of obese and non-obese humans [9–15]. If the gut microbiome does play a causal role in obesity, there is promise for approaches (pre-, pro- and anti-biotic) aimed at modulating the microbiota as novel therapeutic modalities for obesity and its sequelae. The field remains controversial, however (reviewed in [8]). Specifically, efforts to replicate the initial description of phylum-level shifts in the obese human microbiome have only been marginally successful [8]; it is presently unclear whether this is due to true lack of association or lack of power to detect associations of the expected effect size. Additionally, the protection of gnotobiotic mice from DIO, may depend on mouse strain and obesogenic diet [8]. More generally, efforts to rigorously define the mechanisms through which putatively obesogenic microbes might drive obesity phenotypes have been hampered by a failure to identify specific causal microbes or microbial properties [8,10,16–21].
Following on the relatively recent understanding that obesity is associated with a state of chronic, low-grade inflammation [22,23], the innate immune response to gut microbes has been implicated in the development of obesity and its pernicious sequelae [16–18,24]. In turn, the immune system's apparent causal contributions to the development of obesity appear to be mediated by alterations in the constitution of the intestinal microbiota. In particular, deletion of genes encoding pattern-recognition receptors that signal the presence of microbe-associated molecular patterns, such as Tlr5 and Pycard, has been shown to select for microbiota that can transfer obesity to other mice [16,17]. Given the relationship between the intestinal immune system and the gut microbiota [25,26], we hypothesized that members of the gut microbiota capable of robust stimulatory effects on the intestinal immune system might also causally contribute to the development and maintenance of obesity. This hypothesis was bolstered by the observation that colonization with one such microbe, segmented filamentous bacteria (SFB), specifically induced the intestinal expression of genes with dual roles in both immunity and metabolism, such as Retnlb, Saa1 and Il17a [25], and altered extraintestinal (patho)physiology in diverse disease models [27–29].
We thus defined the contribution of the microbiota to obesity in mice known to differ in both the development of DIO [25,30–33] and in colonization with particular species known to alter immune responses [25,34,35]. Specifically, C57BL/6 mice from two commercial vendors, Jackson Labs and Taconic Farms, are known to vary in their colonization with SFB and L. murinus, as well as in their body weight gain in response to high fat diet (HFD) challenge. We confirmed previously reported differences between these strains in their response to HFD challenge. However, our data indicate that these differences are not due to SFB or L. murinus, or, indeed, to the entire gut microbiota—as assessed by a variety of experimental designs, including cross-colonization via co-housing, oral gavage of whole gut microbiota, and oral gavage with specific members of the gut microbiota. While our data demonstrate that the gut microbiota is not responsible for the divergent response to HFD challenge in these mice, we observed constitutively increased locomotor activity in the (leaner) C57BL/6 mice from Jackson Labs. Moreover, in the course of these studies, a number of novel experimental techniques were developed to interrogate the microbiota and their role in modulating host (patho)physiology.
2. Materials and methods
2.1. Mice
Wild type C57BL/6J (NntB6J) and C57BL/6NJ (NntWT) mice were obtained from Jackson labs. Wild type C57BL/6NTac (NntWT) mice were obtained from Taconic Farms. Gnotobiotic C57BL/6 germ-free mice were obtained from the National Gnotobiotic Rodent Resource Center at UNC-Chapel Hill. Except where otherwise indicated, the mice from Taconic farms were of the “Murine Pathogen Free™” (MPF) health status. All mice were housed in a specific pathogen-free animal facility and handled in high-efficiency particulate-filtered laminar flow hoods with ad libitum access to food and water at CCHMC, except for the experiments in the PhenoMaster/LabMaster cages from TSE Systems, which were performed at the metabolic diseases institute at the University of Cincinnati. For all experiments, animal care was performed according to the procedures outlined in the Guide for Care and Use of Laboratory Animals. All animal studies were carried out with the approval of the Institutional Animal Care and Use Committees at which they were performed: the Cincinnati Children's Hospital Medical Center IACUC (Protocol #1DO5047) and the University of Cincinnati College of Medicine IACUC (Protocol #06-08-07-01).
2.2. Fecal and intestinal DNA extraction, 16S rDNA qPCR, cDNA synthesis, qPCR
DNA extraction was carried out according to a modified version of a published protocol [36]. Briefly, fecal pellets or approximately 1 cm sections of terminal ileum were placed in lysis buffer and homogenized with a TissueLyser (Qiagen) set at 30 Hz for 5 min. For fecal pellets, 0.1 mm zirconia–silica beads (BioSpec, Bartlesville, OK) were used to homogenize bacterial cells. For homogenization of terminal ilea, such beads were used in combination with 1/8'' diameter stainless steel beads (McMaster-Carr). Following extraction and resuspension in DEPC-treated H2O, DNA quantification was performed with a NanoDrop ND-1000. 50 ng of DNA was used as the amplification template in a Light Cycler 480 II using Sybr Green I Master mix (both from Roche). The following primers for the 16S rDNA of SFB, Lactobacillus murinus, all Lactobacillus species or all Eubacterial (EUB) species were used: SFB 5′ GACGCTGAGGCATGAGAGCAT, 3′ GACGGCACGGATTGTTATTCA; L. murinus 5′ GCAATGATGCGTAGCCGAAC, 3′ GCACTTTCTTCTCTAACAACAGGG; All Lactobacillus sp. 5′ AGCAGTAGGGAATCTTCCA, 3′ CACCGCTACACATGGAG; EUB 5′ ACTCCTACGGGAGGCAGCAGT, 3′ ATTACCGCGGCTGCTGGC [37,38]. Phylum and species levels were then normalized to the total amount of Eubacterial DNA or, where indicated, total amount of Lactobacillus DNA. Notably, while the primers used to detect L. murinus were designed to detect the ASF361 isolate of L. murinus present in altered Schaedler flora, they have also been predicted to bind the 16S sequence from the closely related Lactobacillus species, L. animalis [37].
For RNA isolation, tissue samples were homogenized as above in TRIzol (Invitrogen) with 1/8'' diameter stainless steel beads (McMaster-Carr) to disrupt the tissue. RNA was extracted according to manufacturer instructions. Equal amounts of RNA were used as templates to synthesize cDNA with oligo-dT, random hexamers and Superscript II reverse transcriptase (Invitrogen). The cDNA was then RNase-digested, diluted 1:7 in DEPC-treated water and subjected to qPCR analysis using Light Cycler 480 II (Roche). Sybr Green I Master mix (Roche) and the following primer pairs [25,39] were used: Gapdh 5′ CCTCGTCCCGTAGACAAAATG, 3′ TCTCCACTTTGCCACTGCAA; Saa1 5′ CATTTGTTCACGAGGCTTTCC, 3′ GTTTTTCCAGTTAGCTTCCTTCATGT; Reg3g 5′ CCTTCCTCTTCCTCAGGCAAT, 3′ TAATTCTCTCTCCACTTCAGAAATCCT; IL-17A 5′ ACTACCTCAACCGTTCCACG, 3′ AGAATTCATGTGGTGGTCCAG.
2.3. Obesity models
Except where otherwise indicated, 6–7 week-old male mice were placed on a high-fat diet (HFD; 60% of kcal from fat, carbohydrate 20% kcal, protein 20% kcal; Research Diets #D12492i), a chow diet (Chow; fat 13.5% kcal, carbohydrate 59% kcal, protein 27.5% kcal; Lab Diet #5010), a semi-purified low fat diet (LFD; fat 10% kcal, carbohydrate 70%kcal, protein 20% kcal; Research Diet #D12450Bi), or autoclavable chow from Jackson Labs present in the shipping container, in which mice were received (Jax Chow; fat 16% kcal, carbohydrate 61.7%kcal, protein 22.2%kcal; Lab Diet#5K67). Animals were weighed weekly. Fresh food was provided on a weekly basis and food consumption was quantified weekly.
Quantification of fasting glucose was carried out as follows. Mice were fasted overnight (12 h) and the glucose level in a single drop of blood was quantified using the FreeStyle flash blood glucose monitoring system (Abbot Diabetes Care Inc.). Insulin tolerance testing was carried out as follows. Mice were fasted during the day (8 h) and challenged via intraperitoneal injection (10 μL/g of body weight) with 1.5 U/kg Novolin R insulin (Novo Nordisk Inc.). Immediately following injection, and kinetically thereafter, one drop of blood was collected and analyzed for glucose levels as above. Glucose tolerance testing was carried out as follows. Mice were fasted overnight and challenged via intraperitoneal injection (10 μL/g of body weight) with 10% dextrose dissolved in normal saline (Sigma). Glucose levels were then analyzed as in insulin tolerance testing. Hemoglobin A1C was quantified using A1CNow+ (Bayer) according to the manufacturer's instructions [40].
2.4. Colonization
Broadly speaking, mice were colonized as indicated and colonization was assessed 2 weeks later on the day of (but prior to) the initiation of HFD-challenge. In particular, 4–8 week-old male C57BL/6 mice were colonized via oral gavage with a slurry of fecal material dissolved in PBS. The slurry contained either: (1) an isolate of SFB obtained (as described below) from the terminal ilea of MPF health status C57BL/6NTac mice; or (2) the fecal material of a conventionally raised mouse, as indicated. Oral gavage of autologous fecal material served as a control. Experiments aimed at transferring a single bacterial species whether from SFB monocolonized fecal material or a pure culture of Lactobacillus murinus included a 1:1 mixture of pooled autologous fecal material to control for effects of gavage with only a single bacterial species versus a complex mixture of bacterial species, with one exception: SFB-enriched microbiota isolated from the terminal ilea of mice from Taconic Farms was transferred by itself, without the addition of autologous fecal material. Colonization was assessed by quantitation of SFB or L. murinus levels in fecal pellets obtained 2 weeks later on the day of (but prior to) the initiation of HFD challenge. In the experiments depicted in Figures 4G, 7A and 8D, WT C57BL/6 breeders from Jackson labs were colonized as indicated. The colonization status of their 4–6 week-old offspring was verified, and the offspring were subsequently subjected to HFD-challenge for 12 weeks. For the cohousing experiment in Figure 8A, 4 week-old C57BL/6 males from Jackson Labs or Taconic Farms were housed with a single 4 week-old C57BL/6 female from the other vendor for a period of 2 weeks. After 2 weeks, the females were removed and the males were subjected to HFD challenge. For the experiment in shown in Figure 9, 6–8 week-old germ-free C57BL/6J males (from the National Gnotobiotic Rodent Research Center; originally derived from mice obtained from Jackson Labs) were colonized as above with fecal material from conventionally raised mice. SFB-monoassociated mice were maintained at the UNC National Gnotobiotic Rodent Resource Center as a source SFB. SFB containing stools used to colonize these mice were provided by Drs. Y. Umesaki and A. Imaoka, Yakult Center Laboratories, who isolated SFB by limiting dilution [41].
Figure 4.
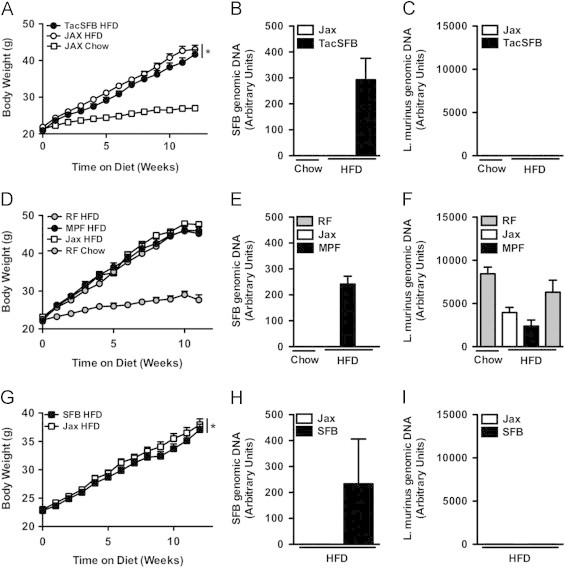
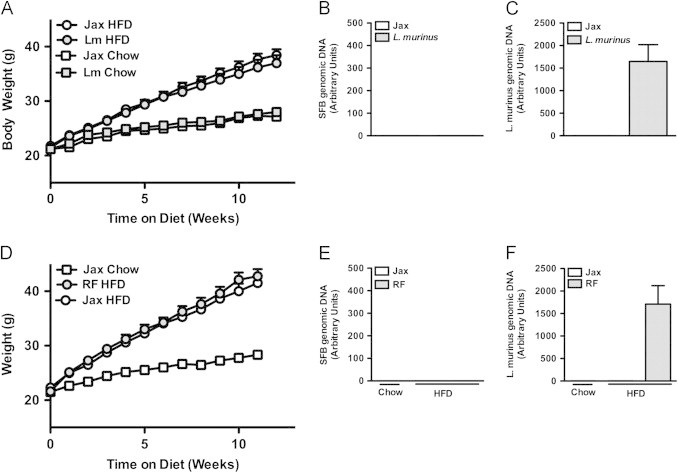
SFB is not responsible for accelerated obesity in Taconic mice. (A–C) Colonization with SFB isolated from Taconic mice: C57BL/6 mice from Jackson Labs were colonized via oral gavage with either SFB isolated from C57BL/6 mice from Taconic Farms, or mock-colonized, and placed on HFD or chow diet for 12 weeks. (A) Body weight. (B, C) Fecal bacterial levels (pooled by cage), 6 week-old (prior to diet challenge): (B) SFB. (C) L. murinus. (D–F) Colonization of C57BL/6NTac mice with SFB: SFB-negative C57BL/6NTac RF health status mice were colonized via oral gavage with fecal material either from C57BL/6NTac MPF health status mice or C57BL/6J mice from Jackson Labs and placed on HFD or chow diet for 12 weeks. (D) Body weight. (E, F) Fecal bacterial levels (pooled by cage), 6 week-old: (E) SFB. (F) L. murinus. (G–H) Vertical colonization of C57BL/6 mice with SFB: C57BL/6 mice from Jackson Labs were colonized with autologous SFB-negative fecal material, alone or in combination with SFB-positive fecal material from mice monocolonized with SFB. Progeny were place on HFD for 12 weeks. (G) Body weight. (H, I) Fecal bacterial levels (pooled by cage), 4 week-old: (H) SFB. (I) L. murinus. Data represent means+SE. A–C: N=6–9 mice/condition; D–F: N=4–9 mice/condition; G–I: N=8–11 mice/condition. (A, D, G) *P<0.01, one-way repeated measures ANOVA with Tukey's correction. Data are from a single experiment.
Figure 7.
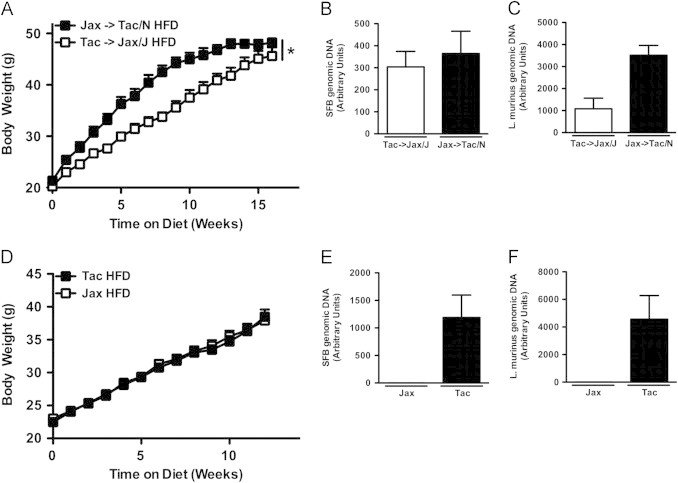
Horizontally transmissible gut microbiota in mice from Taconic Farms is not responsible for accelerated obesity. (A–C) Reciprocal Co-Housing: C57BL/6 males from the indicated vendor were housed with females from the other vendor for 2 weeks (Taconic males with Jackson females, and vice versa) and placed on HFD or chow for 16 weeks. (A) Body weight. (B, C) Fecal bacterial levels, 6 week-old (B) SFB. (C) L. murinus. (D–F) Colonization of C57BL/6 mice from Jackson Labs with Taconic fecal material from birth: C57BL/6 mice from Jackson Labs were colonized with either autologous SFB-negative fecal material or exogenous fecal material of mice from Taconic Farms. Progeny were placed on HFD for 12 weeks. (D) Body weight. (E, F) Fecal bacterial levels (pooled by cage), 4 week-old: (E) SFB. (F) L. murinus. Data represent means+SE. (A–C) N=7–8 mice/condition from a single experiment. (D–F) N=10–11 mice/condition from a single experiment. (A, D) *P<0.01, one-way repeated measures ANOVA with Tukey's correction.
Figure 8.
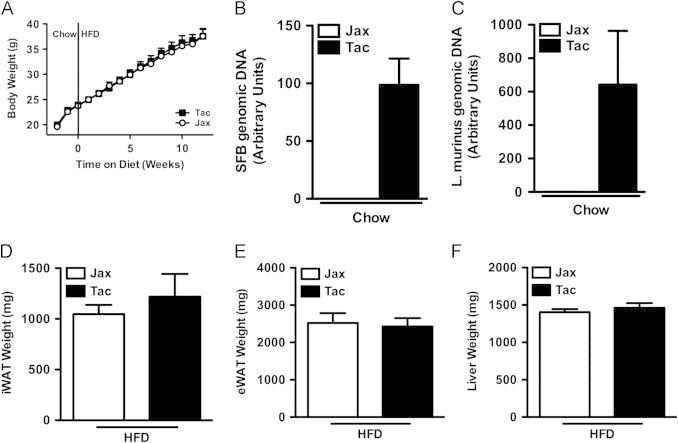
Taconic Farms gut microbiota is not responsible for accelerated obesity in gnotobiotic mice. (A–F) 6–8 week-old germ-free C57BL/6J males were colonized with fecal material from mice obtained from the indicated vendor, fed chow for 2 weeks, and then switched to HFD for 12 weeks. (A) Body weight. (B, C) Fecal bacterial levels after 2 weeks on chow diet. (B) SFB. (C) L. murinus. (D) Inguinal white adipose tissue (iWAT) weight. (E) Perigonadal white adipose tissue (eWAT) weight. (F) Liver weight. Data represent means+SE. (A–F) N=6–8 mice/condition from a single experiment. (A) *P<0.01, paired Student's t-test. (D–F) *P<0.01, unpaired Student's t-test.
Figure 9.
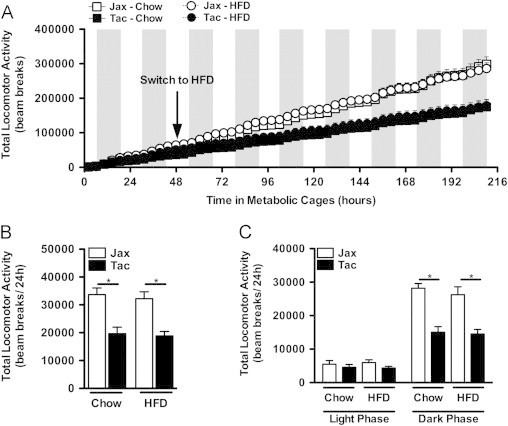
Mice from Taconic exhibit increased locomotor activity regardless of diet. C57BL/6 mice from the indicated vendor were individually housed in metabolic cages from TSE Systems. After 2 days of chow feeding, HFD-challenge was initiated. (A) Cumulative total locomotor activity. (B) Average total locomotor activity. (C) Diurnal average total locomotor activity. Data represent means+SE of an N=4–5 mice/condition. (B, C) *P<0.01, one-way ANOVA with Tukey's correction. Data are from a single experiment.
2.5. Enrichment of SFB from the terminal ilea of conventionally raised mice
SFB was enriched from conventionally-raised mice using a method similar to the procedure described for the isolation of SFB from gnotobiotic mice colonized with a mixture of clostridial species and SFB [42]. Briefly, 6 cm sections of terminal ileum (starting 1 cm proximal to the ileo-cecal junction) were isolated under sterile conditions in a laminar flow hood and homogenized in a bead beater. This homogenate was then shaken in sterile-filtered ethanol, washed and left in culture medium (Lactobacilli MRS Broth, Difco) under aerobic conditions at 37 °C and 5% CO2 overnight. The next day, it was used to colonize 4 week-old C57BL/6 males from Jackson Labs. C57BL/6 males from Jackson Labs gavaged with their own fecal material were controls. Specificity of colonization (SFB-positive, L. murinus-negative) was confirmed 2 weeks later via qPCR analysis of fecal pellets (pooled by cage).
2.6. Energy expenditure analysis
Mice were received from the vendors, individually housed in standard housing and fed chow for 1 week. Following this, they were transferred to PhenoMaster/LabMaster cage system (TSE Systems, Inc). Food and water intake, locomotor activity, VO2 and VCO2 were measured every 10 min for 210 h. Subsequently, the mice were transferred to standard housing and their food intake in response to challenge with recombinant human leptin (1 mg/kg of total body mass) was assessed. Terminal body composition (EchoMRI) and bacterial colonization were assessed. Respiratory exchange rate was calculated from VO2 and VCO2.
2.7. Statistical analysis
Data were analyzed by one-way ANOVA, followed by Tukey's correction for multiple comparisons or unpaired Student's t-test. For longitudinal data over the course of HFD-feeding, repeated measures ANOVA or paired Student's t-test was used, as appropriate.
3. Results
3.1. C57BL/6 mice from Jackson Labs are protected from obesity and many of its adverse sequelae, compared to C57BL/6 mice from Taconic Farms
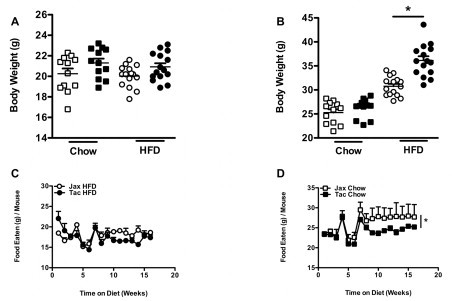
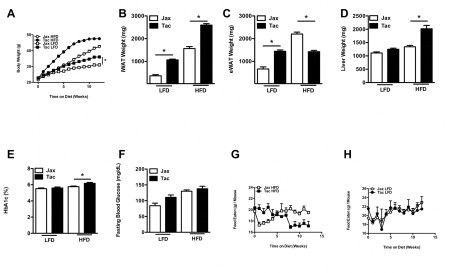
We tested the hypothesis that the differential rate of development of DIO exhibited by C57BL/6 mice from two separate commercial vendors, Jackson Labs and Taconic Farms, was due to differences in their gut microbiota. Mice from Taconic Farms are colonized with SFB and L. murinus, whereas those from Jackson Labs are not [25]. Confirming previous reports [30–33], when subjected to the stress of HFD feeding, mice from Jackson Labs exhibited resistance to the development of obesity, compared with mice from Taconic Farms (Figure 1A). This was not a subtle phenotype. Significant differences in body weight were observed within the first few weeks of HFD feeding (Figure S1A and S1B). Notably, significant differences in food intake were not observed (Figure S1C and S1D). In this model, the size of the epididymal white adipose tissue depot reaches an apex that coincides with a metabolic crisis marked by white adipose tissue inflammation, systemic insulin resistance, epididymal white adipocyte death (associated with contraction of this depot), elevation in serum triglycerides, hepatomegaly and hepatic steatosis [43]. As this occurs, epididymal white adipose tissue lipids undergo redistribution: to the blood (with increased serum triglyceride concentrations), and to the liver (leading to steatosis and hepatomegaly) [43]. This lipid redistribution is marked by negative correlation between liver and epididymal white adipose tissue weight [43]. While inguinal white adipose tissue weight parallels body weight, and serves as a proxy for adiposity in this model (Figure 1B), integration of epididymal white adipose tissue weight and liver weight thus serves as a proxy for relative metabolic status and overall progression in the model [43]. Of note, in parallel with the increased obesity observed in C57BL/6 mice from Taconic Farms, such mice exhibited decreases in both epididymal white adipose tissue weight and increased liver weight, indicative of poor metabolic outcome (Figure 1C and D).
Figure 1.
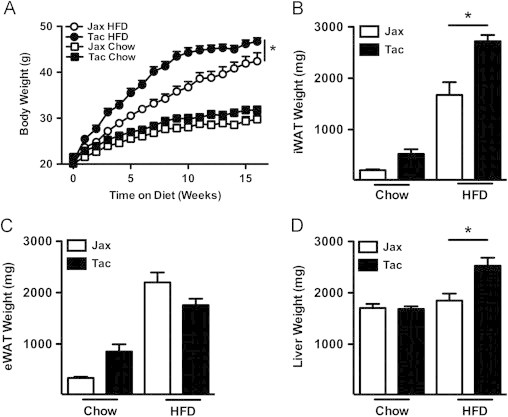
Vendor source alters HFD-induced obesity in C57BL/6 mice. C57BL/6 mice from the indicated vendors were placed on HFD or chow diet for 16 weeks. (A) Body weight. (B) Inguinal white adipose tissue (iWAT) weight. (C) Perigonadal white adipose tissue (eWAT) weight. (D) Liver weight. Data represent means+SE of an N=8–9 mice/condition. (A) *P<0.01, one-way repeated measures ANOVA with Tukey's correction. (B–D) *P<0.01, one-way ANOVA with Tukey's correction. One experiment, representative of 6 independent experiments. Jax, Jackson Laboratories; Tac, Taconic Farms.
To quantify glucose (dys)metabolism in these mice, formal metabolic testing was carried out. Insulin tolerance testing revealed increased insulin resistance, commensurate with greater obesity, in mice from Taconic Farms (Figure 2A, B). Curiously, no significant differences were observed in glucose tolerance or fasting hyperglycemia between mice from the two vendors (Figure 2C–E). Given the tightly coupled relationship between obesity and glucose dysmetabolism observed in HFD-fed C57BL/6 mice [44], the mice from Jackson Labs would have been expected to exhibit protection from glucose intolerance and fasting hyperglycemia on the basis of their relative leanness. Importantly, however, C57BL/6 mice from Jackson Labs carry a loss-of-function mutant allele (NntB6J) of the gene encoding the nicotinamide nucleotide transhydrogenase (Nnt), whereas C57BL/6 mice from Taconic Farms carry the wild type allele (NntWT) [45]. NNT activity regulates glucose-stimulated insulin release from the pancreas [46]. Thus, Nnt mutants would be expected to exhibit increased glucose intolerance and fasting hyperglycemia relative to equivalently obese controls. However, as noted above, the C57BL/6 mice from Jackson Labs were leaner than their C57BL/6 counterparts from Taconic Farms. In this instance, it appears that the competing effects of DIO and the Nnt mutation on fasting hyperglycemia and glucose intolerance cancel each other out.
Figure 2.
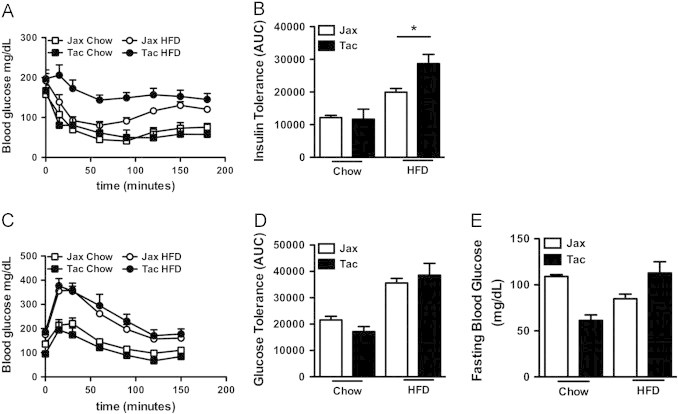
Insulin resistance tracks with obesity in mice from different vendors. C57BL/6 mice from the indicated vendors were place on HFD or chow diet, as indicated. (A, B) Insulin tolerance test (ITT) after 14 weeks of HFD feeding: (A) Kinetic analysis; (B) Area under the curve (AUC) analysis. (C, D) Glucose tolerance Test (GTT) after 11 weeks of HFD feeding: (C) Kinetic analysis; (D) AUC analysis. (E) Fasting blood glucose after 9 weeks of HFD feeding. Data represent means+SE of an N=4–6 mice/condition. (B, D, E), *P<0.01, unpaired Student's t-test. Data are from a single experiment.
3.2. Known genetic differences between C57BL/6 substrains do not explain divergence in obesity phenotype
Given the variant Nnt alleles in these C57BL/6 substrains, it was important to rule out a contributory role for Nnt in the divergent response of these substrains to HFD challenge. Thus, the response to HFD challenge of both NntWT mice (C57BL/6NJ) and NntB6J mice (C57BL/6J) from Jackson Labs was compared to that of NntWT mice (C57BL/6NTac) from Taconic Farms. In agreement with a prior report comparing DIO in NntWT and NntB6J mice with the same model [47], we found that, relative to NntB6J mice raised in the same facility at Jackson Labs, NntWT mice were protected from the development of obesity (Figure 3). Thus, Nnt genotype, by itself, is not responsible for the increased obesity observed in C57BL/6 mice from Taconic Farms, though it appears to exacerbate HFD-induced glucose intolerance (Figure 2).
Figure 3.
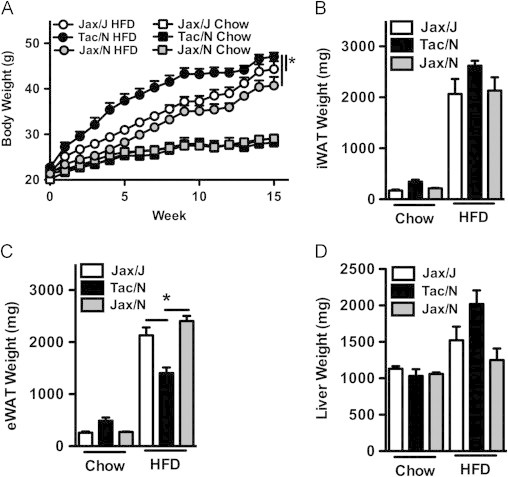
Mutant nicotinamide nucleotide transhydrogenase (NntB6J) is not responsible for protection from obesity. NntWT C57BL/6 mice obtained from both Jackson Labs (Jax/N, C57BL/6NJ) and Taconic Farms (Tac/N, C57BL/6NTac), and NntB6J mutant C57BL/6 mice from Jackson Labs (Jax/J, C57BL/6J), were placed on HFD or chow diet for 16 weeks. (A) Body weight. (B) Inguinal white adipose tissue (iWAT) weight. (C) Perigonadal white adipose tissue (eWAT) weight. (D) Liver weight. Data represent means+SE of an N=3–6 mice/condition. (A) *P<0.01, one-way repeated measures ANOVA with Tukey's correction. (B–D) *P<0.01, one-way ANOVA with Tukey's correction. Data are from a single experiment.
3.3. SFB is not obesogenic
Having ruled out the Nnt mutation as an explanation for these divergent obesity phenotypes, we addressed our primary hypothesis: that differences in specific members of the gut microbiota were responsible. In light of the established contribution of immune regulation in microbiota-mediated obesity [16,17] and the specific induction of a number of immunometabolic genes by SFB [25], we first focused our attention on SFB, a commensal found in C57BL/6 mice from Taconic Farms but absent in C57BL/6 mice from Jackson Labs [25]. We took three complementary approaches to defining whether differential colonization with SFB underlay these differential responses to HFD stress. First, we isolated SFB-enriched microbiota from the ileum of C57BL/6 mice from Taconic Farms, and colonized C57BL/6 mice from Jackson Labs (by oral gavage) with this isolate after weaning. Recipient mice did not exhibit increased weight gain in comparison to mock-colonized C57BL/6 mice (Figure 4A–C). Second, we found that, while C57BL/6 mice from Taconic Farms of the “Murine Pathogen Free™” (MPF) health status were colonized with SFB and L. murinus, C57BL/6 mice from Taconic Farms of the “Restricted Flora™” (RF) health status were only colonized with L. murinus (Figure S2). Thus, we compared C57BL/6 RF mice that were colonized by oral gavage (again, after weaning) with MPF fecal material (SFB positive and L. murinus positive), autologous RF fecal material (SFB negative and L. murinus positive) or Jackson fecal material (SFB negative and L. murinus negative). As shown in Figure 4D–F, no differences in the development of obesity were observed in these mice. Finally, since adoptive transfer via oral gavage shortly after weaning may not be entirely physiological, we sought to more closely mimic natural colonization with SFB. To do this, C57BL/6 breeders from Jackson Labs were colonized with autologous fecal material, alone or in combination with fecal material from an SFB mono-associated mouse. Again, SFB-colonized mice did not exhibit increased obesity, compared with SFB-negative mice (Figure 4G–I).
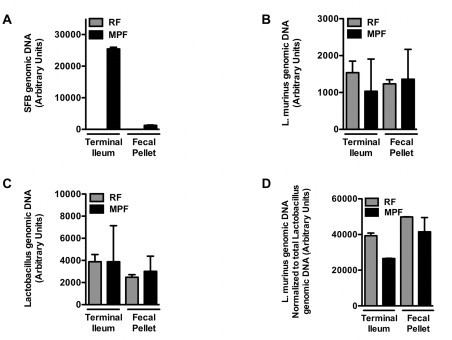
We also quantified SFB colonization density in C57BL/6 mice from Taconic Farms (Jackson Labs as a negative control) at the time of harvest in diet challenge studies. SFB colonization density is known to decline after weaning, with the induction of mucosal immune responses [48]. Of note, HFD feeding led to significantly greater suppression of terminal ileal SFB levels than chow feeding (Figure 5A and B). Importantly, the HFD employed for these studies is a semi-purified elemental diet, as opposed to the natural ingredient chow diet control. Prior reports indicate that mice fed semi-purified diets are resistant to colonization with SFB [49]. We also found that C57BL/6 mice from Jackson Labs fed a semi-purified low-fat control diet (LFD) were resistant to colonization with SFB (data not shown). This effect was also evident in mice with established SFB colonization, as lower fecal SFB levels were also observed in C57BL/6 mice from Taconic Farms within a week of switching to this diet (Figure 5C). As the vitamin A levels present in the natural ingredient chow diets fed at the Jackson Labs and Taconic Farms facilities vary, and since vitamin A levels are known to influence SFB carriage [50], we determined whether feeding the chow diet used at Jackson Labs to C57BL/6 mice from Taconic farms also altered SFB levels. As shown in Figure 5C, feeding Jackson Labs chow led to rapid suppression of fecal SFB levels. Taken together, these data indicate that SFB is exquisitely sensitive to dietary composition, and suggest that dietary differences may play a role in divergent SFB colonization in mice from Jackson Labs and Taconic Farms.
Figure 5.
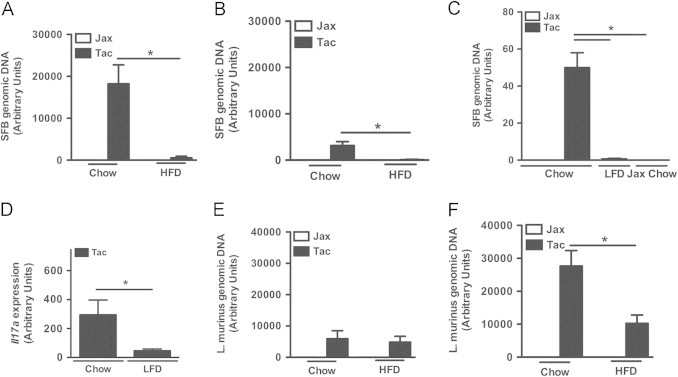
SFB colonization is acutely sensitive to dietary composition, whereas L. murinus is not. (A–C) SFB levels. (A) Terminal ileum after 1 week on the indicated diet. (B) Terminal ileum after 16 weeks on diet. (C) Fecal pellet, after 4 days on diet. (D) Il17a mRNA expression in terminal ileum after 2 weeks on the indicated diet. (E, F) L. murinus levels: (E) Terminal ileum after 1 week on diet; (F) Terminal ileum, after 16 weeks on diet. Data represent means+SE. (A, E) N=4–8 mice/condition; (B, F) N=4–10 mice/condition; (C) N=2–3 mice/condition; (D) N=6 mice/condition. Data (A) and (E) are from the same experiment. Data in (B) and (F) are from the same experiment. Otherwise, each panel represents a separate experiment performed once. (A–C, E, F) *P<0.01, one-way ANOVA with Tukey's correction. (D) *P<0.05, unpaired Student's t-test.
This observation provided another experimental approach to address the contribution of SFB to the development of obesity–LFD challenge. Dietary challenge of C57BL/6 mice from the 2 vendors with the obesogenic LFD (despite the “low fat” designation, the diet is markedly more calorie dense than standard chow) replicated the differential weight gain (C57BL/6 mice from Taconic Farms>C57BL/6 mice from Jackson Labs) with HFD challenge (Figure S3). The fact that this increased obesity occurred in the absence of detectable SFB lends further support to the conclusion that SFB is not responsible for differential weight gain between mice from these vendors.
This decline in SFB levels was also associated with modulation of immune responses. HFD-fed C57BL/6 mice from Taconic Farms displayed a relative defect in the expression of anti-microbial effectors [25,51] in the terminal ileum that are acutely induced following colonization of naïve mice with SFB [25] (Figure S4). Decreased expression of these effectors is consistent with a parallel decline in SFB levels during HFD-feeding. Similarly, alterations in the SFB-stimulated immune response were observed in LFD-fed C57BL/6 mice from Taconic Farms, as they displayed decreased IL-17A (Figure 5D) and IL-17F (data not shown) expression in their terminal ilea relative to chow-fed C57BL/6 mice from Taconic Farms.
3.4. L. murinus is not obesogenic
While gut SFB levels rapidly decline with HFD challenge, levels of L. murinus do not. In fact, L. murinus levels in the terminal ileum appear to increase during the course of both HFD and chow feeding (Figure 5E and F). L. murinus is a member of the model microbiota, altered Schaedler flora that is used as a basal inoculum in all re-derived strains at Taconic Farms [25]. While L. murinus is considered to be typical commensal [37], it is reported to translocate to mesenteric lymph nodes at a higher-than-expected rate for a commensal [34], something with obvious potential immune stimulatory properties. We thus defined the potential contribution of L. murinus to DIO by colonizing C57BL/6 breeders from Jackson Labs with autologous fecal material, alone or in combination with a pure culture of L. murinus, and then challenged their progeny with HFD feeding. No significant differences in the development of obesity between L. murinus positive and negative mice were observed (Figure 6A–C). Additionally, C57BL/6 mice from Jackson Labs were colonized with either autologous fecal material or with fecal material from C57BL/6 RF mice (SFB negative and L. murinus positive). Again, no significant differences in the development of obesity were observed (Figure 6D–F). Taken together, these data indicate that L. murinus is not responsible for the divergent propensity to develop obesity in C57BL/6 mice from Jackson Labs and Taconic Farms.
Figure 6.
L. murinus is not responsible for accelerated obesity. (A–C) Colonization of C57BL/6 mice from birth: C57BL/6 mice from Jackson Labs were colonized with autologous fecal material alone (Jax) or in combination with pure culture of L. murinus (Lm). Progeny were placed on HFD or chow diet for 12 weeks. (A) Body weight. (B, C) Fecal bacterial levels (pooled by cage), 4 week-old (B) SFB. (C) L. murinus. (D–F) Colonization of C57BL/6 mice with L. murinus from Taconic Farms: C57BL/6 mice from Jackson Labs were colonized with autologous SFB-negative fecal material (Jax) or Taconic “Restricted Flora™” (RF) fecal material. (C) Body weight. (E, F) Fecal bacterial levels (pooled by cage), 6 week-old (E) SFB. (F) L. murinus. Data represent means+SE. (A–C) N=9–10 mice/condition, from one experiment, representative of two independent experiments. (D–F) N=4–9 mice/condition, from a separate experiment performed once. (A, D) *P<0.01, one-way repeated measures ANOVA with Tukey's correction.
3.5. Taconic Farms microbiota is not obesogenic
The above experiments eliminated SFB and L. murinus, previously reported to be the gut microbiota components that varied most greatly between the mice from these vendors [25,52], as playing a causal role in the divergent responses of these C57BL/6 substrains to HFD stress. They did not, however, address the potential contribution of the broader microbiota of these mice. We thus addressed the role of the entire horizontally transmissible members of the microbiota using similar approaches. First, we employed reciprocal co-housing of C57BL/6 mice from Taconic Farms and Jackson Labs. As shown in Figure 7A–C, such co-housing failed to eliminate differences in the obesity response. Second, in the same experiment displayed in Figure 4G, we defined the contribution of the horizontally transmissible members of the Taconic microbiota to DIO by colonizing C57BL/6 breeders from Jackson Labs with autologous fecal material or fecal material from MPF health status C57BL/6 mice, and then challenging their progeny with HFD-feeding. No significant difference in the development of obesity was found between the progeny of these mice (Figure 7D–F). Taken together, these data indicate that the portion of the gut microbiota that is horizontally transmissible to conventionally raised mice is not responsible for the divergent obesity phenotypes observed in these mice.
To investigate the possibility that pre-existing microbial colonization might inhibit horizontal transmission of a critical component of the microbiota of mice from Taconic Farms responsible for divergent weight phenotypes, gnotobiotic C57BL/6J mice were colonized with either Taconic or Jackson microbiota and subjected to HFD-challenge (Figure 8). Of note, such mice did not exhibit significant differences in body weight (Figure 8A) even though they were successfully colonized (or not) with Taconic microbiota as indicated by L. murinus and SFB levels (Figure 8B, C). Thus, divergent microbiota do not account for the divergent development of obesity of C57BL/6 mice from these two vendors.
3.6. Constitutive differences in locomotor activity correlate with the divergent development of obesity
To further dissect the divergent obesity phenotypes in C57BL/6 mice from Taconic Farms and Jackson Labs, we housed these mice in metabolic cages for 1 week and observed a significant increase in body weight of HFD-fed C57BL/6 mice from Taconic Farms relative to those from Jackson Labs (Figure S5). In parallel, we observed a trend towards increased percentage of body fat mass, consistent with obesity (Figure S5). Only modest differences in food intake (both total and body-weight adjusted), energy expenditure (whether mean or cumulative, both total and metabolic mass adjusted), respiratory quotient or leptin-driven food intake were observed (Figures S6–S8, and data not shown). However, C57BL/6 mice from Taconic Farms and Jackson Labs displayed significant differences in their fine, ambulatory and total locomotor activity, with the (leaner) C57BL/6 mice from Jackson Labs exhibiting greater activity (Figures 9 and S9). Increased locomotor activity might seem counterintuitive in the face of no quantifiable differences in energy expenditure in these metabolic cages. However, despite the modest contribution of locomotor activity to total energy expenditure [53], the cumulative effects of increases in locomotor activity can translate into sizable differences in weight gain over time. Previous work, seeking to dissect the relative contribution of basal metabolism and locomotor activity to weight gain with western diet challenge found that a 2-fold increase in locomotor activity could account for an approximately 0.5 g decrement in body weight gain per week, even though differences in total energy expenditure were undetectable during this period in similar metabolic cages [53]. Thus, the observed difference in locomotor activity likely accounts for most of the divergence in the development of DIO in C57BL/6 mice from Jackson Labs and mice from Taconic Farms.
4. Discussion
Taken together, our data indicate that variations in the gut microbiota between C57BL/6 mice from Jackson Labs and Taconic Farms are not responsible for their divergent development of diet-induced obesity. More broadly, our data suggest that differences in the gut microbiota do not materially contribute to the development of DIO in conventionally raised wild type mice. Of course, systematic investigation of additional strains of wild type mice raised under a greater diversity of environmental conditions would be required to draw the more general conclusion.
These data mirror that from unpublished studies in the lab aimed at defining the contribution of SFB to the development of non-alcoholic fatty liver disease (NAFLD) In these studies, the contributions of SFB were analyzed using three approaches: (1) colonization of C57BL/6 mice from Jackson Labs via oral gavage with SFB-monocolonized fecal material; (2) vancomycin-mediated depletion of SFB in C57BL/6 mice from Taconic Farms; and (3) colonization of Leprdb/db mice from Jackson Labs via oral gavage with SFB-monocolonized fecal material. While the focus of this work was on NAFLD, obesity was also quantified. We found that neither colonization with, nor depletion of, SFB altered the development of obesity in C57BL/6 mice; whereas colonization of Leprdb/db mice with SFB led to a moderate (~10%) decrease in body weight (unpublished). The experimental approaches used carry caveats, however. On the one hand, SFB colonization of C57BL/6 mice from Jackson Labs using fecal material from SFB mono-associated mice resulted in lower levels of fecal SFB than did colonization with fecal material from Taconic Farms. This suggests that SFB growing in the competitive environment of conventionally raised mice from Taconic Farms have a competitive advantage compared with SFB repetitively passaged in the competition-free environment of mono-associated mice. On the other hand, selective depletion of SFB using vancomycin dramatically alters intestinal microbial ecology [54] and could confound results if other vancomycin-susceptible microbes made a negative contribution to the development of DIO. The decreased body weight in Leprdb/db mice colonized with SFB relative to their mock-colonized counterparts suggests that colonization with SFB might actually protect from obesity under some circumstances. Such protection might be explained by SFB-mediated induction of IL-17 family cytokines, which have described roles in reduction of adipogenesis and weight gain in DIO models [55]. Consistent with this, we occasionally observed statistically significant but biologically modest protection from obesity in SFB-positive mice, in refutation of the hypothesis that SFB is obesogenic, a hypothesis suggested by the divergent course of DIO in C57BL/6 mice from Taconic Farms and Jackson Labs (Figure 4A and G). Together with the data presented here, these parallel data definitively exclude a role for SFB in promoting obesity.
Similarly, these parallel unpublished studies shed additional (negative) light on the potential contribution of L. murinus to obesity. As noted above, vancomycin-treated C57BL/6 mice from Taconic Farms did not diverge in their development of obesity. Most Lactobacillus species are intrinsically resistant to vancomycin [56] and L. murinus is no exception. In fact, L. murinus levels expand significantly during vancomycin treatment, likely at the expense of other bacterial species (data not shown). This observation further supports the conclusion that L. murinus is not responsible for the divergence in DIO between C57BL/6 mice from Taconic Farms and Jackson Labs.
These experiments further address the potential contribution of microbes that are not horizontally transmissible to conventional mice that is, the constituents of the microbiota that are not transferrable into mice with a pre-existing microbial community structure. To formally address this possibility, we performed the relevant microbiota transfers into gnotobiotic recipients. Taken together, our data indicate that divergent microbiota are not responsible for the divergent DIO response between C57BL/6 substrains. Of note, a recent study has implicated an SFB-enriched microbiota as protective in similar models of DIO in the context of IL-22 pathway deficiency [57]. Our data indicate that either SFB is likely not responsible for modulating the development of obesity in such mice or that the contribution of such microbiota to obesity is less pronounced in the context of a fully functional immune response. Whether our data have broader implications on the role microbiome-mediated modulation of obesity development remains to be determined.
Regardless of the role of the gut microbiota, our studies highlight the need for critical attention to the selection of control groups in studies employing DIO models. Substrains of C57BL/6 mice commonly used to model human obesity differ in their response to HFD feeding. This difference is in addition to, and apparently independent of, a previously-described genetic mutation that varies between substrains of C57BL/6.
We have yet to identify the underlying causal mechanism(s) responsible for these phenotypic differences. We have, however, identified a potentially useful proxy (and likely intermediate mechanism): locomotor activity, which may have utility in defining underlying cause(s). By itself, altered locomotor activity is consistent with a role for microbiota, other environmental factors, or genetic effects. On the one hand, a previous retrospective analysis of behavioral testing on thousands of mice over several years found that mice of the C57BL/6J substrain exhibited increased spontaneous locomotor activity relative to C57BL/6N mice [58]. The scale of analysis and the varied sources of mice studied [58] suggest that this difference in locomotor activity has a genetic basis. On the other hand, studies of locomotion in germ-free and conventionally raised mice suggest possibility role for environmental factors, as germ-free mice exhibit increased locomotion relative to conventionally raised or conventionalized (that is, previously germ-free colonized with conventional microbiota) mice [12,59]. Regardless of the ultimate cause of differences in locomotion, the proximal cause of the divergent development of obesity is likely locomotion, as differences in locomotion acutely contribute to weight gain on a time-scale consistent with the rapid increase in body weight that we have observed [53].
As for underlying environmental mechanisms, plausible candidates abound. First, the diets used by these vendors differ in their vitamin A concentration. While the differences are relatively modest, early life exposure to this vitamin and its metabolites, which alters thermogenic adipose tissue development [60], could alter the subsequent response to HFD-challenge. Second, while the mean reported temperatures maintained by these vendors are similar, the range of acceptable temperatures at the Jackson Labs facilities is wider than at the facilities at Taconic Farms. Given the profound effects of even moderate cold-stress on non-shivering thermogenesis and the development of obesity [61], such differences might explain subsequent differences in locomotor activity and in the development of DIO. Third, it remains possible that an as-yet unknown genetic difference between the C57BL/6 substrains is responsible [62].
The current studies provide an experimental framework to address a key question in the study of the effects of the microbiota on obesity: Does the microbiome exert effects on obesity through the action of specific individual species? As part of this, we have developed a number of experimental procedures (as well as instructive experimental dead ends) that may prove useful in dissection of the (patho)physiologic consequences of gut microbiota variation more generally. It should be noted, however, that an alternative question might provide an experimental pathway with more traction: Does the microbiome exert effects on obesity through expression of species-independent metagenomic pathways [15]?
Conflict of interest
None declared.
Acknowledgments
Supported by NIH Grant AI075159 (to C.L.K), and 5-P30-DK034987 and 5-P40-OD010995. (to the National Gnotobiotic Rodent Research Center). I.T.W.H. also received support from HD07463, and GM063483, as well as a Fellowship from the Albert J. Ryan Foundation. The funding sources played no role in study design; in the collection, analysis and interpretation of data; in the writing of the report; or in the decision to submit the article for publication. We thank J. Ashworth and J. Dunn for their assistance with the experiments; Y. Umesaki and A. Imaoka (Yakult) for providing a source of monocolonized SFB; A. Gewirtz, M. Stefater, R. Seeley and S. Woods for helpful discussions; and CCHMC Veterinary Services for patience with these studies.
Appendix A. Supporting information
Supplementary data associated with this article can be found in the online version at doi:10.1016/j.molmet.2013.04.004.
Appendix A. Supplementary materials
Supplementary Material
Figure S1.
Additional parameters for experiment presented inFigure 1. (A) Individual body weight, week 0. (B) Individual body weight, week 5. (C) Weekly food intake, HFD. (D) Weekly food intake, chow diet. Data represent means+SE. (A, B) *P<0.01, one-way ANOVA with Tukey's correction. (C, D) *P<0.01, paired Student's t-test.
Figure S2.
Mice from Taconic Farms with “Restricted Flora™” health status are colonized withL. murinus, but not SFB. Fecal bacterial levels were quantified in age-matched 5–6 week-old male C57BL/6NTac mice of either the “Restricted Flora™” (RF) or “Murine Pathogen Free™” (MPF) health status. (A) SFB. (B) L. murinus. (C) All Lactobacillus sp. (D) L. murinus, normalized to all Lactobacillus sp. Data represent means+SE of an N=2 mice/condition. Data represent a single experiment.
Figure S3.
A semi-purified low-fat diet similarly accelerates obesity in C57BL/6 mice from Taconic Farms. C57BL/6 mice from the indicated vendors were placed on LFD for 1 week and then placed on a HFD or LFD for 12 weeks. (A) Body weight. (B) Inguinal white adipose tissue (iWAT) weight. (C) Perigonadal white adipose tissue (eWAT) weight. (D) Liver weight. (E) Hemoglobin A1c percentage, 12 weeks. (F) Fasting blood glucose, 12 weeks. (G) Weekly food intake, HFD. (H) Weekly food intake, LFD. Data represent means+SE of an N=6–18 mice/group. (A) *P<0.01, one-way repeated measures ANOVA with Tukey's correction. (B–F) *P<0.05, one-way ANOVA with Tukey's correction. (G, H) *P<0.01, paired Student's t-test. Data are from a single experiment.
Figure S4.
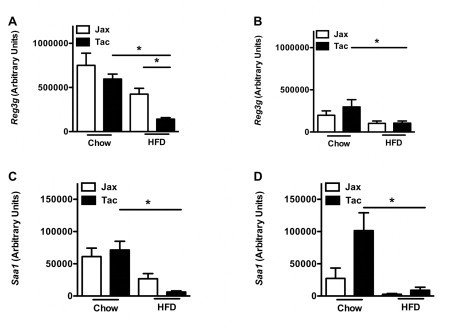
HFD-challenged mice from Taconic Farms express lower levels of anti-microbial effectors. C57BL/6 mice from the indicated vendors were placed on HFD or chow diet for 5 or 16 weeks, and gene expression levels were quantified in their terminal ilea. (A) Reg3g, 5 weeks. (B) Reg3g, 16 weeks. (C) Saa1, 5 weeks. (D) Saa1, 16 weeks. Data represent means+SE of an N=4–10 mice/condition. *P<0.01, one-way ANOVA with Tukey's correction. Data are from a single experiment.
Figure S5.
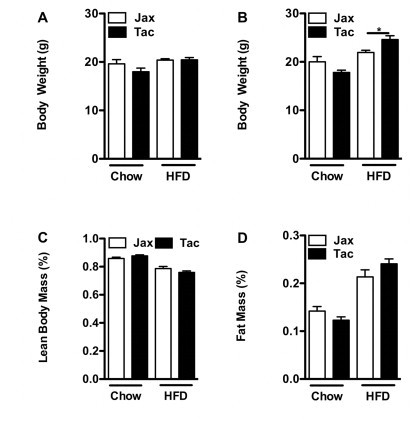
Additional parameters from the TSE Systems Metabolic Cage experiment described in Figure 8. (A) Body weight, 0 week. (B) Body weight, 1 week. (C) Percentage lean body mass, 1 week. (D) Percentage fat body mass, 1 week. Data represent means+SE of an N=4–5 mice/condition. (A, D–F) *P<0.01, unpaired Student's t-test.
Figure S6.
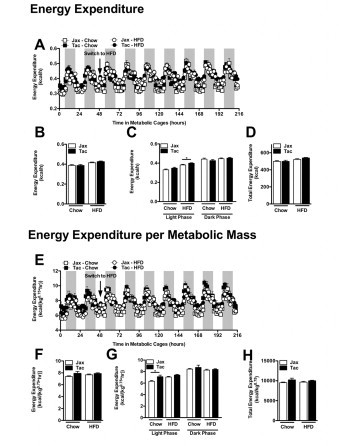
Mice from Taconic Farms and Jackson labs exhibit similar in energy expenditure. Experiment described in Figure 8. (A) Hourly energy expenditure. (B) Average hourly energy expenditure. (C) Diurnal average hourly energy expenditure. (D) Cumulative energy expenditure. (E) Hourly energy expenditure adjusted for metabolic mass. (F) Average hourly energy expenditure adjusted for metabolic mass. (G) Diurnal average hourly energy expenditure adjusted for metabolic mass. (H) Cumulative energy expenditure adjusted for metabolic mass. Data represent mean+SE of an N=4–5 mice/condition. (B–D, F–G) *P<0.01, unpaired Student t-test.
Figure S7.
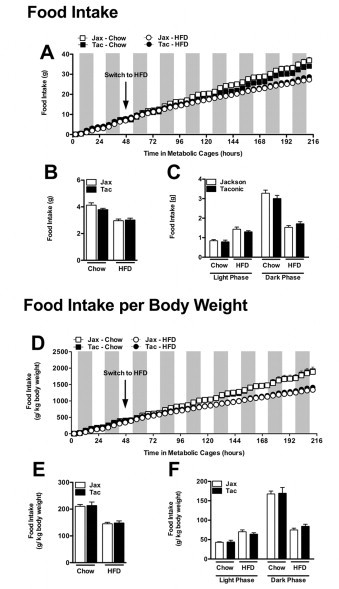
Mice from Taconic Farms and Jackson labs exhibit similar food intake. Experiment described in Figure 8. (A) Cumulative food intake. (B) Average food intake. (C) Diurnal average food intake. (D) Cumulative body weight-adjusted food intake. (E) Average body weight-adjusted food intake. (F) Diurnal average body weight-adjusted food intake. Data represent mean+SE of an N=4–5 mice/condition. (B, C, E, F) *P<0.01, unpaired Student's t-test.
Figure S8.
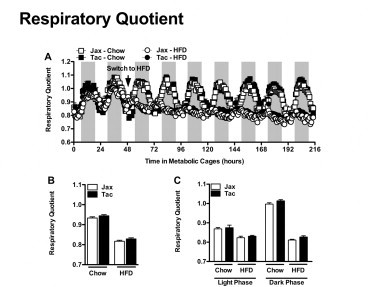
Mice from Taconic Farms and Jackson labs exhibit similar fuel utilization. Experiment described in Figure 8. (A) Respiratory quotient. (B) Average respiratory quotient. (C) Diurnal average respiratory quotient. Data represent mean+SE of an N=4–5 mice/condition. (B, C) *P<0.01, unpaired Student's t-test.
Figure S9.
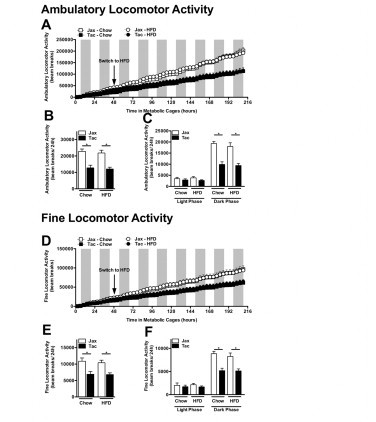
Locomotor activity analysis reveals similar contribution to differences in total locomotor activity from both fine and ambulatory activity. Experiment described in Figure 8. (A) Cumulative ambulatory locomotor activity. (B) Average ambulatory locomotor activity. (C) Diurnal average ambulatory locomotor activity. (D) Cumulative fine locomotor activity. (E) Average fine locomotor activity. (F) Diurnal fine ambulatory locomotor activity. Data represent means+SE of an N=4–5 mice/condition. (B, C, E, F) *P<0.01, one-way ANOVA with Tukey's correction.
References
- 1.Finucane M.M., Stevens G.A., Cowan M.J., Danaei G., Lin J.K. National, regional, and global trends in body-mass index since 1980: systematic analysis of health examination surveys and epidemiological studies with 960 country-years and 9.1 million participants. Lancet. 2011;377:557–567. doi: 10.1016/S0140-6736(10)62037-5. [DOI] [PMC free article] [PubMed] [Google Scholar]
- 2.Reaven G.M. Banting lecture 1988. Role of insulin resistance in human disease. Diabetes. 1988;37:1595–1607. doi: 10.2337/diab.37.12.1595. [DOI] [PubMed] [Google Scholar]
- 3.Eckel R.H., Grundy S.M., Zimmet P.Z. The metabolic syndrome. Lancet. 2005;365:1415–1428. doi: 10.1016/S0140-6736(05)66378-7. [DOI] [PubMed] [Google Scholar]
- 4.Adams T.D., Gress R.E., Smith S.C., Halverson R.C., Simper S.C. Long-term mortality after gastric bypass surgery. New England Journal of Medicine. 2007;357:753–761. doi: 10.1056/NEJMoa066603. [DOI] [PubMed] [Google Scholar]
- 5.Calle E.E., Rodriguez C., Walker-Thurmond K., Thun M.J. Overweight, obesity, and mortality from cancer in a prospectively studied cohort of US adults. New England Journal of Medicine. 2003;348:1625–1638. doi: 10.1056/NEJMoa021423. [DOI] [PubMed] [Google Scholar]
- 6.Wing R.R., Phelan S. Long-term weight loss maintenance. American Journal of Clinical Nutrition. 2005;82:222S–225S. doi: 10.1093/ajcn/82.1.222S. [DOI] [PubMed] [Google Scholar]
- 7.Melnikova I., Wages D. Anti-obesity therapies. Nature Reviews Drug Discovery. 2006;5:369–370. doi: 10.1038/nrd2037. [DOI] [PubMed] [Google Scholar]
- 8.Harley I.T.W., Karp C.L. Obesity and the gut microbiome: striving for causality. Molecular Metabolism. 2012;1:21–31. doi: 10.1016/j.molmet.2012.07.002. [DOI] [PMC free article] [PubMed] [Google Scholar]
- 9.Turnbaugh P.J., Backhed F., Fulton L., Gordon J.I. Diet-induced obesity is linked to marked but reversible alterations in the mouse distal gut microbiome. Cell Host & Microbe. 2008;3:213–223. doi: 10.1016/j.chom.2008.02.015. [DOI] [PMC free article] [PubMed] [Google Scholar]
- 10.Turnbaugh P.J., Ley R.E., Mahowald M.A., Magrini V., Mardis E.R. An obesity-associated gut microbiome with increased capacity for energy harvest. Nature. 2006;444:1027–1031. doi: 10.1038/nature05414. [DOI] [PubMed] [Google Scholar]
- 11.Turnbaugh P.J., Hamady M., Yatsunenko T., Cantarel B.L., Duncan A. A core gut microbiome in obese and lean twins. Nature. 2009;457:480–484. doi: 10.1038/nature07540. [DOI] [PMC free article] [PubMed] [Google Scholar]
- 12.Backhed F., Manchester J.K., Semenkovich C.F., Gordon J.I. Mechanisms underlying the resistance to diet-induced obesity in germ-free mice. Proceedings of the National Academy of Sciences USA. 2007;104:979–984. doi: 10.1073/pnas.0605374104. [DOI] [PMC free article] [PubMed] [Google Scholar]
- 13.Backhed F., Ding H., Wang T., Hooper L.V., Koh G.Y. The gut microbiota as an environmental factor that regulates fat storage. Proceedings of the National Academy of Sciences USA. 2004;101:15718–15723. doi: 10.1073/pnas.0407076101. [DOI] [PMC free article] [PubMed] [Google Scholar]
- 14.Fleissner C.K., Huebel N., Abd El-Bary M.M., Loh G., Klaus S. Absence of intestinal microbiota does not protect mice from diet-induced obesity. British Journal of Nutrition. 2010;104:919–929. doi: 10.1017/S0007114510001303. [DOI] [PubMed] [Google Scholar]
- 15.Arumugam M., Raes J., Pelletier E., Le Paslier D., Yamada T. Enterotypes of the human gut microbiome. Nature. 2011;473:174–180. doi: 10.1038/nature09944. [DOI] [PMC free article] [PubMed] [Google Scholar]
- 16.Vijay-Kumar M., Aitken J.D., Carvalho F.A., Cullender T.C., Mwangi S. Metabolic syndrome and altered gut microbiota in mice lacking Toll-like receptor 5. Science. 2010;328:228–231. doi: 10.1126/science.1179721. [DOI] [PMC free article] [PubMed] [Google Scholar]
- 17.Henao-Mejia J., Elinav E., Jin C., Hao L., Mehal W.Z. Inflammasome-mediated dysbiosis regulates progression of NAFLD and obesity. Nature. 2012;482:179–185. doi: 10.1038/nature10809. [DOI] [PMC free article] [PubMed] [Google Scholar]
- 18.Caricilli A.M., Picardi P.K., de Abreu L.L., Ueno M., Prada P.O. Gut microbiota is a key modulator of insulin resistance in TLR 2 knockout mice. PLoS Biology. 2011;9:e1001212. doi: 10.1371/journal.pbio.1001212. [DOI] [PMC free article] [PubMed] [Google Scholar] [Retracted]
- 19.Ley R.E., Turnbaugh P.J., Klein S., Gordon J.I. Microbial ecology: human gut microbes associated with obesity. Nature. 2006;444:1022–1023. doi: 10.1038/4441022a. [DOI] [PubMed] [Google Scholar]
- 20.Nadal I., Santacruz A., Marcos A., Warnberg J., Garagorri M. Shifts in clostridia, bacteroides and immunoglobulin-coating fecal bacteria associated with weight loss in obese adolescents. International Journal of Obesity (London) 2009;33:758–767. doi: 10.1038/ijo.2008.260. [DOI] [PubMed] [Google Scholar]
- 21.Schwiertz A., Taras D., Schafer K., Beijer S., Bos N.A. Microbiota and SCFA in lean and overweight healthy subjects. Obesity (Silver Spring) 2010;18:190–195. doi: 10.1038/oby.2009.167. [DOI] [PubMed] [Google Scholar]
- 22.Wellen K.E., Hotamisligil G.S. Inflammation, stress, and diabetes. Journal of Clinical Investigation. 2005;115:1111–1119. doi: 10.1172/JCI25102. [DOI] [PMC free article] [PubMed] [Google Scholar]
- 23.Xu H., Barnes G.T., Yang Q., Tan G., Yang D. Chronic inflammation in fat plays a crucial role in the development of obesity-related insulin resistance. Journal of Clinical Investigation. 2003;112:1821–1830. doi: 10.1172/JCI19451. [DOI] [PMC free article] [PubMed] [Google Scholar]
- 24.Letran S.E., Lee S.J., Atif S.M., Flores-Langarica A., Uematsu S. TLR5-deficient mice lack basal inflammatory and metabolic defects but exhibit impaired CD4 T cell responses to a flagellated pathogen. Journal of Immunology. 2011;186:5406–5412. doi: 10.4049/jimmunol.1003576. [DOI] [PMC free article] [PubMed] [Google Scholar]
- 25.Ivanov I.I., Atarashi K., Manel N., Brodie E.L., Shima T. Induction of intestinal Th17 cells by segmented filamentous bacteria. Cell. 2009;139:485–498. doi: 10.1016/j.cell.2009.09.033. [DOI] [PMC free article] [PubMed] [Google Scholar]
- 26.Kamada N., Kim Y.G., Sham H.P., Vallance B.A., Puente J.L. Regulated virulence controls the ability of a pathogen to compete with the gut microbiota. Science. 2012;336:1325–1329. doi: 10.1126/science.1222195. [DOI] [PMC free article] [PubMed] [Google Scholar]
- 27.Lee Y.K., Menezes J.S., Umesaki Y., Mazmanian S.K. Proinflammatory T-cell responses to gut microbiota promote experimental autoimmune encephalomyelitis. Proceedings of the National Academy of Sciences USA. 2011;108(Suppl. 1):4615–4622. doi: 10.1073/pnas.1000082107. [DOI] [PMC free article] [PubMed] [Google Scholar]
- 28.Kriegel M.A., Sefik E., Hill J.A., Wu H.J., Benoist C. Naturally transmitted segmented filamentous bacteria segregate with diabetes protection in nonobese diabetic mice. Proceedings of the National Academy of Sciences USA. 2011;108:11548–11553. doi: 10.1073/pnas.1108924108. [DOI] [PMC free article] [PubMed] [Google Scholar]
- 29.Wu H.J., Ivanov I.I., Darce J., Hattori K., Shima T. Gut-residing segmented filamentous bacteria drive autoimmune arthritis via T helper 17 cells. Immunity. 2010;32:815–827. doi: 10.1016/j.immuni.2010.06.001. [DOI] [PMC free article] [PubMed] [Google Scholar]
- 30.Gareski, T.W.S., Kubasiak, D., Unger, T.J., Li, X., Panza, D., Qadri, A., Bedard, P., Ranganath, S., Gimeno, R., Hahm, S., Perreault, M., 2009. The Severity of Insulin Resistance in C57BL/6 Mice Depends on Genetic Background and Dietary Fat Source. Available from: 〈http://professional.diabetes.org/Abstracts_Display.aspx?TYP=1&CID=73710〉. [accessed 01.08.12].
- 31.Hayward, M.D.C.T., Karagrigoriou, S., Chen, D., Campbell, W., Mottershead, C., Wozniczka, A., Bothe, G., Phelan, J., Grass, D.S., Buiakova O., 2011. A comparison of metabolic characteristics amont C57BL/6NTAC, C57BL/6J and C57BL/6JBOM diet induced obese mice with environmental conditioning. Available from: 〈http://www.taconic.com/user-assets/Documents/Products and Services/Animal Models/DIO_2011_Poster.pdf〉. [accessed 01.08.12].
- 32.Jackson Labs. JAX® Inventoried (DIO) Mice—Combining Genetics and Environment. Available from: 〈http://jaxmice.jax.org/literature/factsheet/FS0022_JAX_Inventoried_DIO_Mice.pdf〉. [accessed 01.08.12].
- 33.Taconic Farms. Available from: 〈http://www.taconic.com/user-assets/Images/growth_charts/DietInducedObesityB6Mice.jpg〉. [accessed 01.08.12].
- 34.Ma L., Deitch E., Specian R., Steffen E., Berg R. Translocation of Lactobacillus murinus from the gastrointestinal tract. Current Microbiology. 1990;20:177–184. [Google Scholar]
- 35.Costalonga M., Cleary P.P., Fischer L.A., Zhao Z. Intranasal bacteria induce Th1 but not Treg or Th2. Mucosal Immunology. 2009;2:85–95. doi: 10.1038/mi.2008.67. [DOI] [PMC free article] [PubMed] [Google Scholar]
- 36.Ley R.E., Hamady M., Lozupone C., Turnbaugh P.J., Ramey R.R. Evolution of mammals and their gut microbes. Science. 2008;320:1647–1651. doi: 10.1126/science.1155725. [DOI] [PMC free article] [PubMed] [Google Scholar]
- 37.Sarma-Rupavtarm R.B., Ge Z., Schauer D.B., Fox J.G., Polz M.F. Spatial distribution and stability of the eight microbial species of the altered schaedler flora in the mouse gastrointestinal tract. Applied and Environmental Microbiology. 2004;70:2791–2800. doi: 10.1128/AEM.70.5.2791-2800.2004. [DOI] [PMC free article] [PubMed] [Google Scholar]
- 38.Barman M., Unold D., Shifley K., Amir E., Hung K. Enteric salmonellosis disrupts the microbial ecology of the murine gastrointestinal tract. Infection and Immunity. 2008;76:907–915. doi: 10.1128/IAI.01432-07. [DOI] [PMC free article] [PubMed] [Google Scholar]
- 39.Mintz-Cole R.A., Gibson A.M., Bass S.A., Budelsky A.L., Reponen T. Dectin-1 and IL-17A suppress murine asthma induced by Aspergillus versicolor but not Cladosporium cladosporioides due to differences in beta-glucan surface exposure. Journal of Immunology. 2012;189:3609–3617. doi: 10.4049/jimmunol.1200589. [DOI] [PMC free article] [PubMed] [Google Scholar]
- 40.Osborn O., Brownell S.E., Sanchez-Alavez M., Salomon D., Gram H. Treatment with an Interleukin 1 beta antibody improves glycemic control in diet-induced obesity. Cytokine. 2008;44:141–148. doi: 10.1016/j.cyto.2008.07.004. [DOI] [PMC free article] [PubMed] [Google Scholar]
- 41.Umesaki Y., Okada Y., Matsumoto S., Imaoka A., Setoyama H. Segmented filamentous bacteria are indigenous intestinal bacteria that activate intraepithelial lymphocytes and induce MHC class II molecules and fucosyl asialo GM1 glycolipids on the small intestinal epithelial cells in the ex-germ-free mouse. Microbiology and Immunology. 1995;39:555–562. doi: 10.1111/j.1348-0421.1995.tb02242.x. [DOI] [PubMed] [Google Scholar]
- 42.Klaasen H.L., Koopman J.P., Van den Brink M.E., Van Wezel H.P., Beynen A.C. Mono-association of mice with non-cultivable, intestinal, segmented, filamentous bacteria. Archives of Microbiology. 1991;156:148–151. doi: 10.1007/BF00290989. [DOI] [PubMed] [Google Scholar]
- 43.Strissel K.J., Stancheva Z., Miyoshi H., Perfield J.W., II, DeFuria J. Adipocyte death, adipose tissue remodeling, and obesity complications. Diabetes. 2007;56:2910–2918. doi: 10.2337/db07-0767. [DOI] [PubMed] [Google Scholar]
- 44.Parekh P.I., Petro A.E., Tiller J.M., Feinglos M.N., Surwit R.S. Reversal of diet-induced obesity and diabetes in C57BL/6J mice. Metabolism. 1998;47:1089–1096. doi: 10.1016/s0026-0495(98)90283-9. [DOI] [PubMed] [Google Scholar]
- 45.Mekada K., Abe K., Murakami A., Nakamura S., Nakata H. Genetic differences among C57BL/6 substrains. Experimental Animals. 2009;58:141–149. doi: 10.1538/expanim.58.141. [DOI] [PubMed] [Google Scholar]
- 46.Freeman H., Shimomura K., Horner E., Cox R.D., Ashcroft F.M. Nicotinamide nucleotide transhydrogenase: a key role in insulin secretion. Cell Metabolism. 2006;3:35–45. doi: 10.1016/j.cmet.2005.10.008. [DOI] [PubMed] [Google Scholar]
- 47.Nicholson A., Reifsnyder P.C., Malcolm R.D., Lucas C.A., MacGregor G.R. Diet-induced obesity in two C57BL/6 substrains with intact or mutant nicotinamide nucleotide transhydrogenase (Nnt) gene. Obesity (Silver Spring) 2010;18:1902–1905. doi: 10.1038/oby.2009.477. [DOI] [PMC free article] [PubMed] [Google Scholar]
- 48.Jiang H.Q., Bos N.A., Cebra J.J. Timing, localization, and persistence of colonization by segmented filamentous bacteria in the neonatal mouse gut depend on immune status of mothers and pups. Infection and Immunity. 2001;69:3611–3617. doi: 10.1128/IAI.69.6.3611-3617.2001. [DOI] [PMC free article] [PubMed] [Google Scholar]
- 49.Klaasen H.L., Koopman J.P., van den Brink M.E., Bakker M.H., Beynen A.C. Influence of a natural-ingredient diet containing Phaseolus vulgaris on the colonization by segmented, filamentous bacteria of the small bowel of mice. International Journal for Vitamin and Nutrition Research. 1992;62:334–341. [PubMed] [Google Scholar]
- 50.Cha H.R., Chang S.Y., Chang J.H., Kim J.O., Yang J.Y. Downregulation of Th17 cells in the small intestine by disruption of gut flora in the absence of retinoic acid. Journal of Immunology. 2010;184:6799–6806. doi: 10.4049/jimmunol.0902944. [DOI] [PubMed] [Google Scholar]
- 51.Eckhardt E.R., Witta J., Zhong J., Arsenescu R., Arsenescu V. Intestinal epithelial serum amyloid A modulates bacterial growth in vitro and pro-inflammatory responses in mouse experimental colitis. BMC Gastroenterology. 2010;10:133. doi: 10.1186/1471-230X-10-133. [DOI] [PMC free article] [PubMed] [Google Scholar]
- 52.Ivanov I.I., Frutos Rde L., Manel N., Yoshinaga K., Rifkin D.B. Specific microbiota direct the differentiation of IL-17-producing T-helper cells in the mucosa of the small intestine. Cell Host & Microbe. 2008;4:337–349. doi: 10.1016/j.chom.2008.09.009. [DOI] [PMC free article] [PubMed] [Google Scholar]
- 53.Bjursell M., Gerdin A.K., Lelliott C.J., Egecioglu E., Elmgren A. Acutely reduced locomotor activity is a major contributor to Western diet-induced obesity in mice. American Journal of Physiology—Endocrinology and Metabolism. 2008;294:E251–E260. doi: 10.1152/ajpendo.00401.2007. [DOI] [PubMed] [Google Scholar]
- 54.Ubeda C., Taur Y., Jenq R.R., Equinda M.J., Son T. Vancomycin-resistant Enterococcus domination of intestinal microbiota is enabled by antibiotic treatment in mice and precedes bloodstream invasion in humans. Journal of Clinical Investigation. 2010;120:4332–4341. doi: 10.1172/JCI43918. [DOI] [PMC free article] [PubMed] [Google Scholar]
- 55.Zuniga L.A., Shen W.J., Joyce-Shaikh B., Pyatnova E.A., Richards A.G. IL-17 regulates adipogenesis, glucose homeostasis, and obesity. Journal of Immunology. 2010;185:6947–6959. doi: 10.4049/jimmunol.1001269. [DOI] [PMC free article] [PubMed] [Google Scholar]
- 56.Swenson J.M., Facklam R.R., Thornsberry C. Antimicrobial susceptibility of vancomycin-resistant Leuconostoc, Pediococcus, and Lactobacillus species. Antimicrobial Agents and Chemotherapy. 1990;34:543–549. doi: 10.1128/aac.34.4.543. [DOI] [PMC free article] [PubMed] [Google Scholar]
- 57.Upadhyay V., Poroyko V., Kim T.J., Devkota S., Fu S. Lymphotoxin regulates commensal responses to enable diet-induced obesity. Nature Immunology. 2012;13:947–953. doi: 10.1038/ni.2403. [DOI] [PMC free article] [PubMed] [Google Scholar]
- 58.Matsuo N., Takao K., Nakanishi K., Yamasaki N., Tanda K. Behavioral profiles of three C57BL/6 substrains. Frontiers in Behavioral Neuroscience. 2010;4:29. doi: 10.3389/fnbeh.2010.00029. [DOI] [PMC free article] [PubMed] [Google Scholar]
- 59.Diaz Heijtz R., Wang S., Anuar F., Qian Y., Bjorkholm B. Normal gut microbiota modulates brain development and behavior. Proceedings of the National Academy of Sciences USA. 2011;108:3047–3052. doi: 10.1073/pnas.1010529108. [DOI] [PMC free article] [PubMed] [Google Scholar]
- 60.Kiefer F.W., Vernochet C., O'Brien P., Spoerl S., Brown J.D. Retinaldehyde dehydrogenase 1 regulates a thermogenic program in white adipose tissue. Nature Medicine. 2012;18:918–925. doi: 10.1038/nm.2757. [DOI] [PMC free article] [PubMed] [Google Scholar]
- 61.Karp C.L. Unstressing intemperate models: how cold stress undermines mouse modeling. Journal of Experimental Medicine. 2012;209:1069–1074. doi: 10.1084/jem.20120988. [DOI] [PMC free article] [PubMed] [Google Scholar]
- 62.Wang J.R., de Villena F.P., Lawson H.A., Cheverud J.M., Churchill G.A. Imputation of single-nucleotide polymorphisms in inbred mice using local phylogeny. Genetics. 2012;190:449–458. doi: 10.1534/genetics.111.132381. [DOI] [PMC free article] [PubMed] [Google Scholar]
Associated Data
This section collects any data citations, data availability statements, or supplementary materials included in this article.
Supplementary Materials
Supplementary Material