

Abstract
The interplay between hepatic glycogen metabolism and blood glucose levels is a paradigm of the rhythmic nature of metabolic homeostasis. Here we show that mice lacking a functional PER2 protein (Per2Brdm1) display reduced fasting glycemia, altered rhythms of hepatic glycogen accumulation, and altered rhythms of food intake. Per2Brdm1 mice show reduced hepatic glycogen content and altered circadian expression during controlled fasting and refeeding. Livers from Per2Brdm1 mice display reduced glycogen synthase protein levels during refeeding, and increased glycogen phosphorylase activity during fasting. The latter is explained by PER2 action on the expression of the adapter proteins PTG and GL, which target the protein phosphatase-1 to glycogen to decrease glycogen phosphorylase activity. Finally, PER2 interacts with genomic regions of Gys2, PTG, and GL. These results indicate an important role for PER2 in the hepatic transcriptional response to feeding and acute fasting that promotes glucose storage to liver glycogen.
Keywords: PER2, Glycogen metabolism, Glucose metabolism, Gene expression, Circadian biology
1. Introduction
In most organisms each day is organized in two periods: an activity/feeding phase and a resting/starvation phase. Nutrients ingested during the activity phase provide substrates such as glucose, lipids, and amino acids to fuel metabolic pathways in our cells, whereas during the resting phase energy and substrates stored in our body are mobilized to sustain metabolic homeostasis [1–3]. Blood glucose homeostasis can be seen as a paradigm of the circadian control of metabolism. Indeed, whereas during the activity/feeding phase blood glucose is mainly of dietary origin, during the resting/starvation phase hepatic glucose production is progressively recruited to maintain blood glucose levels within a relatively narrow range. In this process liver glycogen content undergoes large circadian fluctuations to sustain blood glucose levels, as glycogen synthesis and degradation are specifically recruited during the activity/feeding and resting/starvation periods [4,5]. Activity and resting periods are defined by a molecular clock in the suprachiasmatic nucleus (SCN) of the hypothalamus. Indeed, lesions of the SCN cause loss of circadian rhythmicity of locomotor activity and circulating glucocorticoids [6,7]. At the molecular level, daily rhythms of activity and rest depend on a circadian pattern of gene expression within the SCN, which is generated by a transcriptional clock. This clock operates like an oscillator consisting of a positive loop activating gene expression and a negative loop inhibiting gene expression [8,9]. The positive loop is mediated by the CLOCK–BMAL1 complex, which activates the expression of several genes including the period (Per) 1 and 2 and cryptochrome (Cry) 1 and 2 genes. PERs and CRYs proteins are part of a negative feedback loop complex, which inhibits the action of the CLOCK–BMAL1 complex. The positive and negative loops of the molecular clock are further interlinked by the REV-ERBs and RORs nuclear receptors. This molecular machinery is capable of generating rhythmic patterns of gene expression with a period length of about 24 h. The transcriptional output time of the molecular clock is set by light, the most important environmental timing cue (zeitgeber), which synchronizes the SCN clock with the photoperiod [8].
The definition of activity/feeding and resting/starvation phases by the SCN implies that peripheral cells (e.g. hepatocytes) need a rhythmic recruitment of specific metabolic pathways (e.g. glycogen metabolism) to cope with a rhythmic uptake of nutrients (e.g. glucose). It was shown that it is possible to set liver and SCN transcriptional clocks of mice on two different 12-h apart time zones by feeding mice only during the light phase [10,11]. These studies demonstrate that the feeding period is the major zeitgeber for the liver clock. In principle, circadian gene expression in peripheral cells could be directly driven by the rhythmic uptake of nutrients. Indeed, it was shown that rhythmic feeding is necessary and sufficient to drive the circadian expression of hundreds of genes in liver [12]. Still, all cells express the molecular machinery for the circadian clock, which is believed to play a major role in sustaining circadian gene expression in peripheral cells [8,9,12]. Importantly, it was shown that feeding mice a high-fat diet perturbs behavioral rhythms and circadian gene expression in different peripheral tissues, including liver [13]. Furthermore, derangements of circadian rhythms may play a role in the pathogenesis of obesity and obesity-related diseases [14,15]. Thus, identifying the molecular mechanisms controlling circadian metabolism is necessary for a better understanding of metabolic homeostasis, and may be fundamental to the development of new therapies for the treatment of metabolic diseases.
Here we investigate the role of PER2 in glucose homeostasis using mutant mice lacking a functional PER2 protein (Per2Brdm1). Altogether, our data show that hepatic PER2 expression is dynamically controlled by fasting and feeding and that PER2 controls a gene expression program which promotes glucose storage to liver glycogen.
2. Materials and methods
2.1. In-vivo metabolic assays
Animal experiments were approved by the cantonal veterinary committee. Per2Brdm1 mice harbor an in frame deletion of exon 10 of the Per2 gene (part of PAS domain) yielding an unstable protein [16]. Per2Brdm1 mice and WT control mice were bred on a 129S5/C57BL/6-Tyrc-Brd mixed background, and experiments were performed with 3–5 months old male mice. Mice were hosted in our standard facility at 23 °C with 12 h light and 12 h dark cycles and fed ad libitum with standard chow diet. Glucose tolerance test (GTT) and insulin tolerance test (ITT) were performed as described [17]. For GTT mice received 1 g of glucose per kg body weight (Sigma), for ITT mice received 0.5 iU of insulin (Humalog Lilly) per kg of body weight. For the 12 h starvation time-course mice were fasted from ZT2 until ZT14 (light phase time-course), or from ZT14 until ZT2 (dark phase time-course). Blood was collected from the tail vein every 4 h to measure glucose. For circadian fed glycemia blood was collected every 6 h starting from ZT2 until ZT20. For circadian fasting glycemia blood was collected as above but the mice were fasted 8 h before blood collection at each time-point.
For pyruvate tolerance test (PTT) mice were fasted for 16 h to deplete liver glycogen and then received an intraperitoneal injection of 2 g/kg sodium pyruvate (Sigma) at either ZT2 (light phase PTT) or ZT14 (dark phase PTT).
For precise measurements of food intake, powder chow diet was placed in glass beakers (2 cm diameter) fixed on the cage wall to avoid spillage [17]. Food intake was measured every 6 h for 8 days.
For the synchronized refeeding–fasting experiments, mice were fasted for 24 h from ZT12 to deplete liver glycogen and induce hyperphagia (time point 1); then mice were refed ad libitum for 6 h in special cages to measure food intake as described above (time point 2); finally mice were fasted for 8 h (time point 3). Body weight was recorded and a group of mice was sacrificed at each time point and livers were collected for molecular measurements.
For the analysis of kidney function mice were placed in metabolic cages (Indulab) and water deprived for 24 h starting at ZT12. Urine samples were collected twice after 12 h. Urine volumes were measured and osmolarity was determined by freezing point depression using a Fiske osmo-ten osmometer.
2.2. Gene expression analysis
For DNA-microarray and real-time qPCR analysis total RNA was isolated from livers or kidneys by the guanidinium thiocyanate method [18]. For DNA-microarray livers were collected at ZT9 from 4 mice per genotype after 7 h of fasting. Total RNA samples were labeled using a commercial kit (Agilent Technology) and hybridized on a whole mouse genome (4×44K) oligo microarray (Agilent Technology). Data acquisition was performed with a microarray scanner (Agilent Technologies) at 5 μm resolution. Images were analyzed using the Agilent Feature Extraction Software version 10.7.7.1 with the Agilent standard protocol GE1_107_Sep09. Following analyses were carried out with GeneSpring GX 9 software, R software environment for statistical computing and the Bioconductor library of biostatistical packages. All microarray data are available at the Gene Expression Omnibus database http://www.ncbi.nlm.nih.gov/geo/(accession number GSE30139).
For qPCR, 1 μg of total RNA per sample was retro-transcribed using 0.5 μg oligo-dT, 0.5 μg random primers, with a reverse transcription kit (Improm II, Promega). PCR reactions were performed using Power SYBR® green Mix (Applied Biosystem) using the Biorad icycler and manufacturer software for data acquisition. The specific primer sequences used are listed in Table S1 of the supplemental material available with this article online.
2.3. Biochemical assays
Body composition was assessed on carcasses by soxhlet analysis as described [17]. Serum insulin was measured using an ELISA kit (Crystal Chem). Serum glucagon levels were measured using an ELISA kit (USCN, Life Science). Serum vasopressin levels were measured using Arg8-vasopressin ELISA kit (Enzo Life Science).
Immunoblot analysis was performed using commercial antibodies for glycogen synthase (Cell signaling), and glycogen phosphorylase (Santa Cruz). Actin (Sigma) was used as the loading control.
Glycogen content was measured in liver and muscle (gastrocnemius) as described [19,20]. Fifty milligram of powder tissue was digested in 0.2 ml of 1 M KOH at 99 °C for 30 min. Digestion was stopped by adding 2 volumes of 1 M perchloric acid, and cellular debris were eliminated by centrifugation. Five milliliter of 95% ethanol 0.1% LiCl was added to the supernatant and glycogen was precipitated overnight at −20 °C. The glycogen pellet was washed once with 80% methanol 0.1% LiCl and once with 80% ethanol 0.1% LiCl. Finally glycogen was dissolved in distilled water and glucose equivalents were measured using the anthrone reagent (Sigma) in 13.5 M sulfuric acid.
Glycogen phosphorylase activity was measured as described [21,22]. Samples lysates were prepared mechanically in ice-cold extraction buffer (150 mM KF, 20 mM Hepes, 0.5 mM EDTA, 1 mM benzamidine, 1 mM PMSF pH 7.4) using a homogenizer. After centrifugation 20 μl of supernatant was diluted in 180 μl of reaction buffer (50 mmol/l imidazole, 50 mmol/l NaF, 2 mmol/l MgCl2, 0.5 mmol/l EDTA, 1 mg/ml glycogen, 1 mmol/l caffeine, 1 mmol/l NADP, 10 μmol/l glucose-1,6-bisphosphate, 2.5 U/ml phosphoglucomutase, and 2 U/ml G-6-P dehydrogenase, pH 7.5). Phosphorylase-a activity was determined by spectrometric detection of NADP to NADPH conversion by phosphorylase-mediated glycogenolysis coupled to phosphoglucomutase and glucose 6-P dehydrogenase reactions. The reaction was started by the addition of 10 mmol/l of phosphate and activity was normalized on protein content.
2.4. Chromatin-immunoprecipitation (ChIP) from mouse liver tissue
ChIP experiments were performed as described [23]. Briefly, livers were homogenized in 1% formaldehyde/1× PBS and fixed for 5 min at RT. The reaction was stopped by adding 2.5 volumes of ice-cold 2.4 M sucrose stop buffer, and nuclei were obtained by ultracentifugation through 2.05 M sucrose cushions. Soluble chromatin was prepared by sonication for 10 cycles of 15 s sonication (level 50%, Branson SLPe sonicator equipped with 4 mm tip) and 1 min in an ice bath. Antibodies for ChIP have been described [24]. The regions of potential BMAL1 and PER2 genomic binding sites were reported [25] and RT-PCR probes were designed to span these regions (Supplemental Table 2). Quantitative PCR reactions were performed using 2× Kapa Sybr master mix and a Rotorgene 6002 RT-qPCR machine according to the producers.
2.5. Statistical analysis
For DNA-microarrays, probeset flagged as present in three out of four samples within each condition was retained, log2 transformed, quantile normalized and only the upper 75th percentile was retained for subsequent analysis. Differentially expressed genes were detected applying a significance threshold on t-test unequal variance (Benjamini–Hochberg corrected p-value <0.05) and no fold change threshold. Lists of significant probeset were uploaded in Biobase explain 3.0 software (http://www.biobase-international.com/) and 3289 differentially expressed genes (DEGs) were obtained. Signal intensities from probes associated with the same genes were averaged DEGs with absolute value of log2 fold change (FC) >1 were 606: 218 negative and 388 positive. The Biobase explain 3.0 software resource was used for gene-annotation enrichment analysis of DEG lists. The significance of over-representation was determined at a p-value of 0.05. In order to select for final branches of gene ontology (GO) tree, GO group had a minimum of 2 hits per group and a maximum of 200 elements per group.
For repeated measures of food intake differences across genotypes, over 8 days for each 6 h period, were tested by repeated measure ANOVA. Statistical significance was considered for P<0.05. For all other data analysis we used student t-test, statistical significance was considered for P<0.05.
3. Results
3.1. Per2Brdm1 mice display altered response to fasting
To investigate the role of PER2 in blood glucose homeostasis we have assessed body composition, we have performed glucose tolerance test (GTT), and insulin tolerance test (ITT) on 3 months old Per2Brdm1 mice and littermates WT control mice. WT and Per2Brdm1 mice display similar body weight, but consistently with a previous report [26] Per2Brdm1 mice showed decreased body lipids and increased partitioning from fat to lean mass (Supplemental Figure 1A). For GTT and ITT, mice were fasted for 7 h starting from zeitgeber time (ZT) 2 (light is on at ZT0 and off at ZT12) before glucose or insulin injection at ZT9. The results show that WT mice and Per2Brdm1 mice display similar glucose and insulin tolerance, although we observed a small but significant decrease in fasting glycemia in Per2Brdm1 mice compared to WT mice (Supplemental Figure 1B and C). To further investigate this phenotype we have fasted Per2Brdm1 mice and WT mice for 12 h starting at the beginning of the light phase (ZT2–ZT14), or at the beginning of the dark phase (ZT14–ZT2), and we measured blood glucose every 4 h. The results show that Per2Brdm1 mice display reduced blood glucose during fasting, compared to WT controls, specifically when food was removed at the beginning of the light phase but not at the beginning of the dark phase (Figure 1A and B). To further investigate this phenotype 4 WT mice and 4 Per2Brdm1 mice were fasted for 7 h starting from ZT2. Mice were then sacrificed and their livers were collected for DNA microarray gene expression analysis. Gene ontology (GO) analysis for upregulated and downregulated genes, using a cutoff of two-fold change in gene expression, showed significant differences in GO terms related to circadian gene expression, feeding, starvation, and carbohydrates metabolism in Per2Brdm1 mice compared to WT mice (Figure 1C). The same analysis using a cutoff of 0.5 fold change in gene expression showed additional GO terms including genes implicated in glycogen metabolism (Figure 1D).
Figure 1.
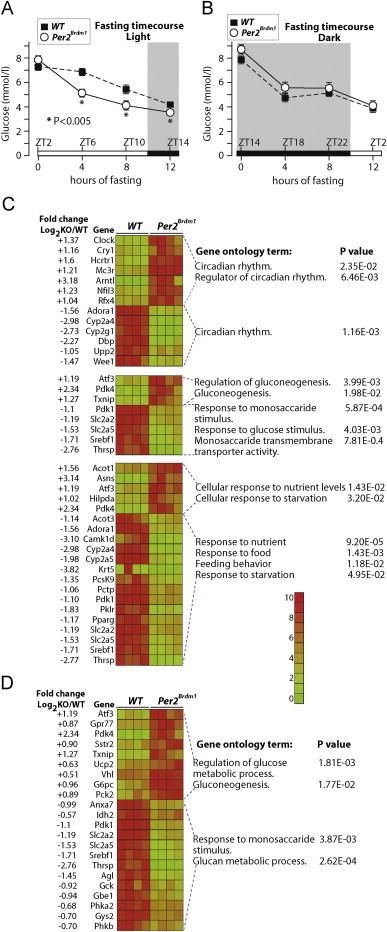
PER2 is implicated in the metabolic response to fasting. Fasting glycemia time-course was measured in WT and Per2Brdm1 mice fasted either from ZT2, the beginning of the light phase (A), or from ZT 14, the beginning of the dark phase (B). Data are expressed as means, standard errors are indicated, and P values were calculated using the Student t-test. (C) Gene ontology “GO” analysis of DNA microarray gene-expression data of livers collected at ZT9 from WT and Per2Brdm1 mice fasted for 7 h. Differentially regulated genes are divided in positively and negatively regulated genes and GO analyses were performed separately on the two datasets. Relative fold changes are expressed as log2 KO/WT. Relative expression values are represented as heat maps and colors are scaled as indicated. The gene list was selected on a fold change of log2Per2Brdm1/WT=1 or higher. (D) GO analysis was performed as for E but using gene list cut at a fold change of 0.5.
Overall, these results suggest a role for PER2 in the control of fasting blood glucose and in the hepatic expression of genes implicated in circadian rhythms, fasting/feeding responses, and carbohydrate metabolism during fasting.
3.2. Per2Brdm1 mice display altered hepatic circadian expression of clock genes and glucose output genes
The results above motivated us to further characterize the role of PER2 in liver circadian gene expression and in hepatic glucose output. Eight mice per genotype were sacrificed at four different ZTs (for a total of 32 mice per genotype) to measure the expression of key components of the hepatic circadian oscillator and of glucose output. The results show that genes encoding essential clock proteins and genes playing a major role in hepatic glucose output displayed altered gene expression rhythms in livers from Per2Brdm1 mice compared to WT mice (Figure 2A and B). Thus these results indicate that the liver transcriptional oscillator requires a functional PER2 to sustain precise circadian gene expression of the key glucose output genes phosphoenolpyruvate carboxykinase (PEPCK), glucose 6-phosphate transporter (G6PT), and the glucose transporter GLUT-2.
Figure 2.
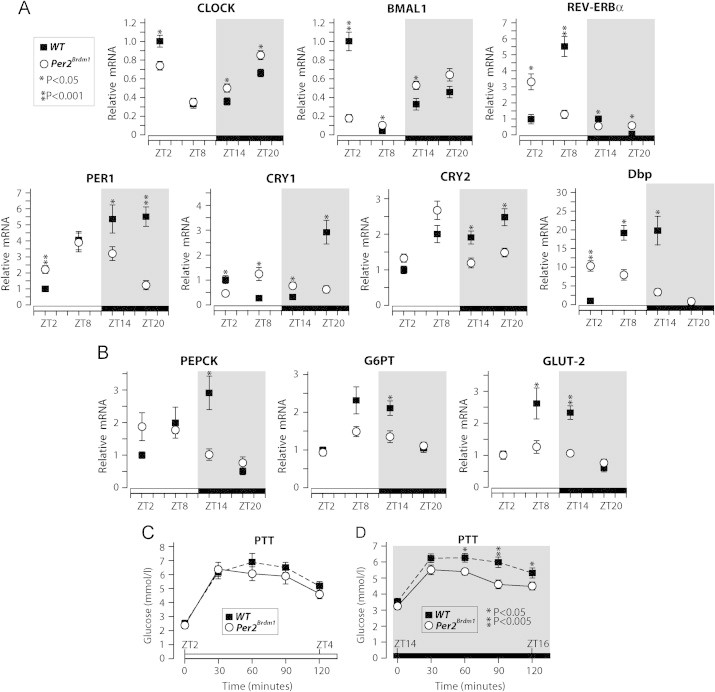
PER2 is required for normal circadian expression of the liver clock and glucose output genes. (A) Real-time qPCR analysis of the expression of clock genes in livers from WT and Per2Brdm1 mice collected at the indicated zeitgeber times (ZT). (B) Real-time qPCR analysis of the samples described above for key liver glucose output genes. Pyruvate tolerance tests were performed starting at either ZT2 (C) or ZT14 (D) on 16 h-fasted WT and Per2Brdm1 mice. Data are expressed as means, standard errors are indicated, and P values were calculated using the Student t-test. Phosphoenolpyruvate carboxykinase (PEPCK); glucose 6-phosphate transporter (G6PT); Glucose transporter 2 (GLUT2).
To evaluate the circadian capacity for hepatic glucose production from gluconeogenesis WT mice and Per2Brdm1 mice were fasted for 16 h, to deplete hepatic glycogen, and then we performed a pyruvate tolerance test (PTT) at either the beginning of light phase (ZT2) or at the beginning of dark phase (ZT14). We observed that, compared to WT mice, Per2Brdm1 mice displayed reduced blood glucose during pyruvate tolerance test performed at ZT14 but not at ZT2 (Figure 2C and D).
Altogether, these results suggest that PER2 is implicated in the fasting response of the liver oscillator and in the rhythmic expression of the molecular machinery sustaining fasting blood glucose via gluconeogenesis.
3.3. Per2Brdm1 mice display altered expression of circadian genes in kidney, but overall normal excretory function
The liver is the major source of endogenous glucose production via glycogenolysis and gluconeogenesis. However, it has been proposed that the kidney may contribute up to 20% of total endogenous glucose production via gluconeogenesis [27]. Furthermore, it recently emerged that the circadian oscillator controls important kidney functions such as diuresis and sodium excretion [28]. Thus, we have investigated the role of PER2 in the kidney circadian gene expression. Our results show that the circadian rhythms of expression of clock genes were altered to some extent in kidneys from Per2Brdm1 mice compared to WT mice (Supplemental Figure 2A). Consistently, the circadian expression of key glucose output genes PEPCK, G6PT, and GLUT-2 was also to some extent altered in kidneys from Per2Brdm1 mice compared to WT mice (Supplemental Figure 2B). To further evaluate the impact of loss of PER2 in kidney function we measured the expression of several genes implicated in the control of diuresis and sodium excretion, including the vasopressin receptor AVPR2, renin, the sodium transporters Gilz and Usp2, and several water transporters: Nhe3, AQP1, AQP2, AQP3, AQP4, and AQP7. Compared to WT mice, we observed some differences in circadian gene expression of AVPR2, renin, Gilz, Usp2, AQP3, and AQP7 in Per2Brdm1 mice (Supplemental Figure 3A). We have also measured serum levels of vasopressin, a hormone playing a major role in the control of kidney water readsorption and liver glycogenolysis. The data show a modest tendency for decreased levels of vasopressin in serum from Per2Brdm1 mice compared to WT mice. However the levels of vasopressin were very low, close to detection limit, and the observed differences were not statistically significant (Supplemental Figure 3B). To evaluate the role of PER2 in kidney function we measured urine excretion and osmolarity of Per2Brdm1 mice and WT mice kept in metabolic cages for 24 h without water. We observed a modest but significant increase in diuresis during the last 12 h of water deprivation and slightly lower urine osmolarity during the 24 h water deprivation period in Per2Brdm1 mice compared to WT mice (Supplemental Figure 3C–E). Overall these data suggest that kidney circadian gene expression depends to some extent on PER2. However, we could not observe an evident role for PER2 in urine concentration or sodium excretion.
3.4. Per2Brdm1 mice display altered rhythms of hepatic glycogen metabolism and altered rhythms of food intake
To evaluate the role of PER2 in the circadian control of fasting glycemia we have measured 8 h-fasting blood glucose at different ZTs. The results show that, compared to control WT mice, Per2Brdm1 mice display reduced fasting blood glucose specifically at ZT8 and ZT14 (across the transition from light phase to dark phase), but not at ZT20 and ZT2 (Figure 3A).
Figure 3.
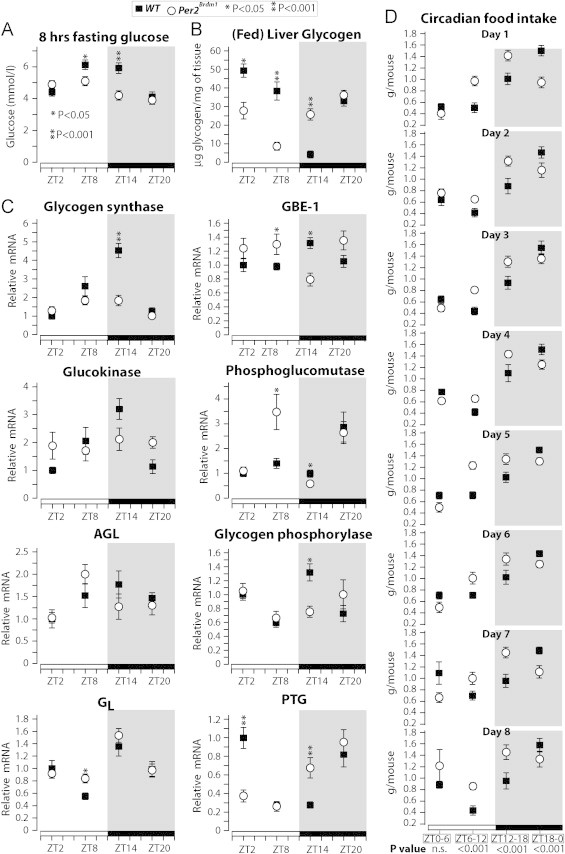
PER2 controls rhythmic hepatic glycogen accumulation and food intake. (A) Blood glucose concentrations were measured after 8 h of fasting at the indicated ZT points in WT and Per2Brdm1 mice. (B) Glycogen content was measured at the indicated zeitgeber times (ZT) in livers from WT and Per2Brdm1 mice fed ad libitum. (C) Real-time qPCR analysis of the expression of key genes for glycogen metabolism in livers from WT and Per2Brdm1 mice collected at the indicated ZT. (D) Precise evaluation of food intake rhythms of WT and Per2Brdm1 mice was performed by measuring food intake in special cages every 6 h for 8 days. Data are expressed as means; standard errors are indicated. P values were calculated using the Student t-test for data in A–C, and repeated measures ANOVA for data in D.
The data in Figure 2 suggest that the reduced fasting glycemia observed in Per2Brdm1 mice may depend on reduced gluconeogenesis. However, previous studies suggested a possible role for PER2 in the control of liver glycogen [24,29,30]. Furthermore, it is also possible that PER2 controls the rhythms of food intake [29]. Therefore, we have measured glycogen content and expression of key genes in glycogen metabolism at different ZTs in livers from WT and Per2Brdm1 mice, as well as the circadian food intake of these mice. The results show that, compared to WT mice, Per2Brdm1 mice display an evident alteration of the rhythms of glycogen accumulation in the liver (Figure 3B). Interestingly, Per2Brdm1 mice display lower hepatic glycogen levels than WT mice at ZT2 (early light phase) but higher glycogen levels at ZT14 (early dark phase). This could explain why Per2Brdm1 mice exhibit decreased fasting glucose compared to WT mice when fasted from ZT2 but not when fasted from ZT14 (Figure 1A and B). Consistently, compared to WT mice, Per2Brdm1 mice showed altered rhythmic liver expression of several genes implicated in glycogen metabolism (Figure 3C). Despite the large difference observed in liver glycogen, fed blood glucose concentrations were constant and similar between WT mice and Per2Brdm1 mice (Supplemental Figure 1D). Furthermore, glycogen accumulation was only marginally altered in gastrocnemius muscles from WT mice and Per2Brdm1 mice (Supplemental Figure 1E). Thus the role of PER2 in glycogen metabolism is much more potent in liver than in muscle.
To test whether the different rhythmic recruitment of the hepatic glycogen machinery and gluconeogenesis was related to altered food intake we have measured rhythmic food intake (every 6 h) in Per2Brdm1 mice and WT control animals for 8 days. Our data show altered food intake for Per2Brdm1 mice compared to WT mice over the 8 days period, which was significant by repeated measure ANOVA (P<0.001 for ZT6–12, ZT12–18, and ZT18–0) (Figure 3D).
Altogether our data show that PER2 controls the rhythms of liver glycogen accumulation, the rhythmic expression of key genes for glycogen metabolism, and the rhythms of food intake. The observed differences in rhythmic hepatic glycogen content largely explain the different responses to starvation observed in Per2Brdm1 mice compared to WT mice. However, the metabolic phenotype of Per2Brdm1 mice may be at least in part consequent to altered feeding/starvation periods.
3.5. PER2 controls the hepatic clock response to feeding and starvation to promote liver glycogen storage
The data above show that Per2Brdm1 mice display a complex metabolic phenotype including altered rhythms of gluconeogenic potential, hepatic glycogen accumulation and metabolism, altered fasting glycemia at specific circadian time points, altered circadian gene-expression, and altered food intake. Therefore, it is not possible from our data (Figure 3) or from previous studies [24,30] to conclude a direct role for PER2 in the control of hepatic carbohydrate metabolism which is independent from central effects on feeding behavior. Thus, we decided to investigate whether PER2 controls glycogen metabolism in the condition of controlled food intake. To achieve this aim WT and Per2Brdm1 mice were fasted for 24 h to completely deplete their livers from glycogen and to induce hyperphagia, then refed ad libitum for 6 h, to induce glycogen synthesis, and finally fasted for 8 h, to induce glycogen degradation (Figure 4A). The refeeding was performed in special cages for precise measurement of food intake. Seven mice per genotype were sacrificed at time-point TP1 (24 h fasting), 12 mice per genotype at TP2 (6 h refeeding), and 16 mice per genotype at TP3 (8 h fasting), and livers were collected for measurements of glycogen content and gene expression (Figure 4A). Our data show that whereas WT mice and Per2Brdm1 mice displayed a similar food intake and glycemia during refeeding (Figure 4B and C), Per2Brdm1 mice showed a modest but significant reduction of hepatic glycogen content compared to WT mice (Figure 4D). This result strongly indicates that a functional PER2 is required for efficient glycogen synthesis during refeeding. Furthermore, the absolute difference in hepatic glycogen levels observed between genotypes at TP3, the end of the 8-h fasting period, was about twice the one observed at the end of refeeding period TP2 (Figure 4D). This observation indicates a possible role for PER2 in the control of glycogen degradation.
Figure 4.
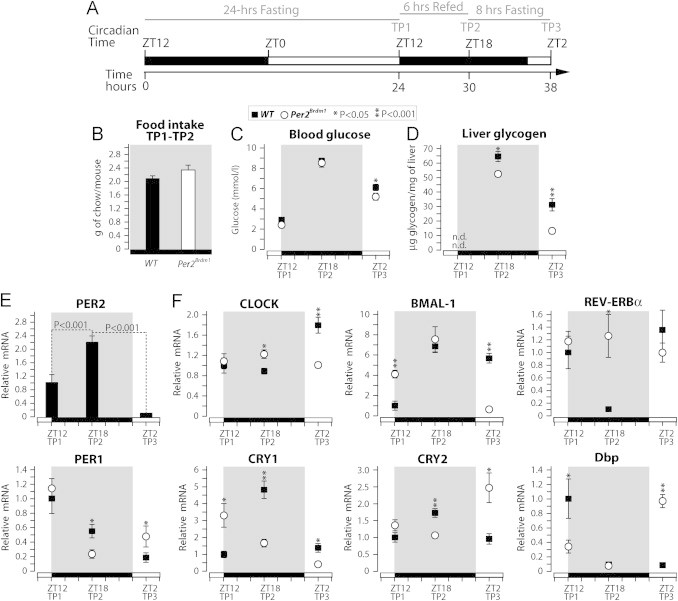
Lack of PER2 causes reduced liver glycogen accumulation and altered expression of clock genes in response to feeding and fasting. (A) Experimental design. WT mice and Per2Brdm1 mice were fasted for 24 h from ZT12 time point (TP) 1, fed ad libitum for 6 h TP2, and then fasted again for 8 h TP3. (B) Food intake was precisely measured for WT and Per2Brdm1 mice during the 6 h refeeding period. Blood glucose (C) and hepatic glycogen content (D) were measured at the indicated time points. (E) Real-time qPCR analysis of the hepatic expression of PER2 in WT mice at the indicated fasting and fed time points. (F) Real-time qPCR analysis of the expression of clock genes in livers from WT and Per2Brdm1 mice collected at the indicated time points. Data are expressed as means; standard errors are indicated (n.d.=non-detectable). P values were calculated using the Student t-test.
To evaluate the role of PER2 in the liver transcriptional oscillator response to feeding and fasting we measured the expression of circadian clock genes in livers from WT and Per2Brdm1 mice collected at TP1, TP2, and TP3. We observed that Per2 gene expression is induced more than 2-fold during the refeeding period, and then it is suppressed below basal level at 8 h of fasting (Figure 4E). This expression profile of PER2 is consistent with its expected circadian pattern (Supplemental Figure 4G). Importantly, the results show that Per2Brdm1 mice display altered expression of several clock genes at different time points (Figure 4F). Most notably, REV-ERBα expression was upregulated specifically during refeeding (TP2), whereas BMAL-1 and CLOCK expression was downregulated specifically after 8 h of fasting (TP3) in livers from Per2Brdm1 mice compared to WT mice.
Collectively these results show that PER2 is required for normal liver circadian gene-expression and for efficient glycogen storage under controlled feeding/starvation conditions.
3.6. PER2 sustains hepatic glycogen synthase levels during refeeding
To investigate the role of PER2 in glycogen synthesis we have measured the expression of key genes in glucose output and glycogen metabolism in livers from WT mice and Per2Brdm1 mice collected at the end of the refeeding period TP2 (Figure 4A). We observed that the expression of Glut-2 and G6PT was reduced in livers from Per2Brdm1 mice but that the expression of PEPCK was similar to controls (Figure 5A). Importantly, we observed that the mRNA levels of several genes implicated in glycogen metabolism were reduced in livers from Per2Brdm1 mice compared to the ones from WT control mice (Figure 5B). Most notably mRNA levels of glycogen synthase (Gys-2), the enzyme catalyzing the rate limiting step of glycogen synthesis, in livers from Per2Brdm1 mice were about half of the one measured in WT mice (Figure 5B). To further evaluate the physiological significance of this change in gene expression we measured glycogen synthase protein levels in livers from the mice above by immunoblot. The results show that glycogen synthase protein levels in livers from Per2Brdm1 mice were about the half of the one measured in livers from WT mice at TP2 (Figure 5C and D). These results indicate that PER2 is required to sustain glycogen synthase expression during refeeding. Thus, the difference in liver glycogen content observed at TP2 between WT mice and Per2Brdm1 mice (Figure 4D) can be largely explained by the role of PER2 in the expression of glycogen synthase during refeeding.
Figure 5.
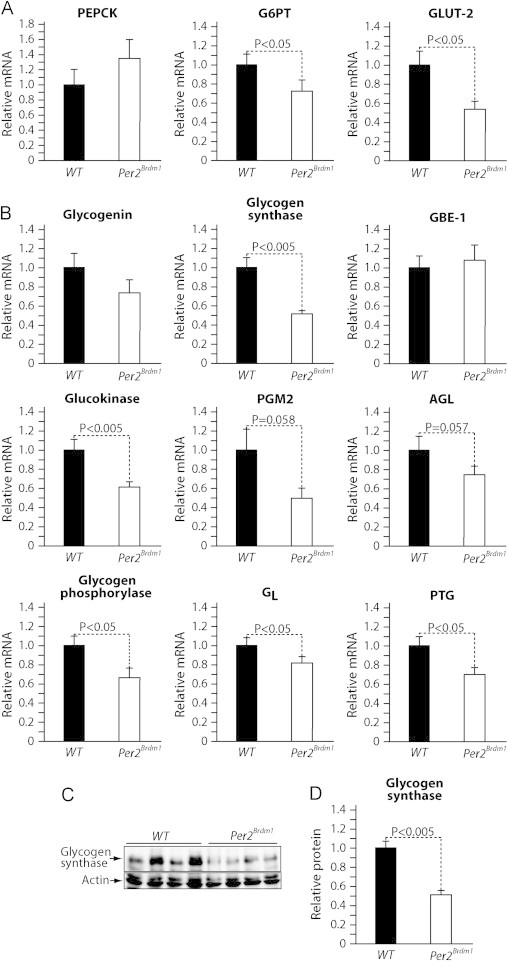
PER2 sustains glycogen synthase expression during refeeding. (A) Real-time qPCR analysis of the expression of key glucose output genes in livers from WT and Per2Brdm1 mice collected after 6 h of refeeding (TP2). (B) qPCR analysis of the expression of genes in glycogen metabolism from the livers above. (C) Representative immunoblot analysis of glycogen synthase protein levels from livers described above. (D) Quantification of the immunoblots in C. Data are expressed as means; standard errors are indicated. P values were calculated using the Student t-test.
3.7. PER2 sustains GL and PTG expression during fasting with consequent modulation of glycogen phosphorylase activity
To investigate the role of PER2 in hepatic glucose output and glycogenolysis we have measured the expression of key genes in glucose output and glycogen metabolism in livers from WT mice and Per2Brdm1 mice collected at TP3, the end of the 8 h fasting period following the refeeding period (Figure 4A). Differently from what was observed in mice fed ad libitum (Figure 2B) in this experiment of controlled fasting we could not observe significant differences in the rate-limiting gluconeogenic enzyme PEPCK, or glucose output genes G6PT and Glut-2 (Figure 6A). The expression of major enzymes in glycogenolysis, including glycogen phosphorylase, and the debranching enzyme AGL, was also similar between livers of fasted WT mice and Per2Brdm1 mice (Figure 6B). Expression of the catalytic subunit of the phosphatase PP1c, a major negative regulator of glycogen phosphorylase activity, was also not affected in Per2Brdm1 mice (Figure 6B). However, we observed that in livers from Per2Brdm1 mice mRNA levels of GL and PTG, the key adapter proteins targeting PP1c to glycogen, were respectively about half and five time less than in livers from WT control mice (Figure 6B). Being PP1c a major negative post-translational regulator of glycogen phosphorylase activity, it is expected that glycogen phosphorylase activity should be elevated in livers from Per2Brdm1 mice compared to WT mice independently from its protein levels. Consistently, liver glycogen phosphorylase protein levels were similar in WT and Per2Brdm1 mice as assessed by immunoblot (Figure 6C and D). Nonetheless, we observed that glycogen phoshorylase activity in livers from Per2Brdm1 mice was about twice as much the activity measured in livers from WT mice (Figure 6E). At present we cannot exclude an extra hepatic action of PER2 in the control of glycogen phosphorylase activity. Indeed, serum insulin levels were significantly decreased in Per2Brdm1 mice at TP3 compared to WT mice (Supplemental Figure 4A).
Figure 6.
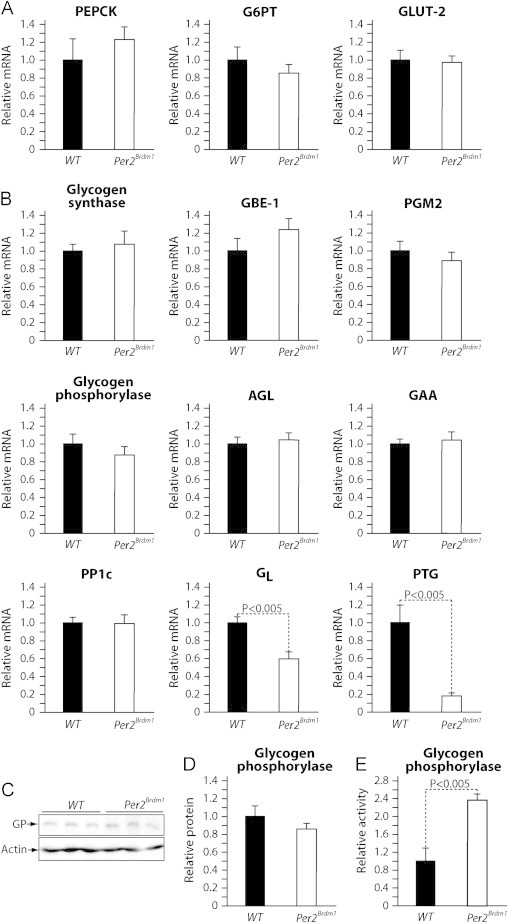
PER2 controls glycogen phosphorylase activity during fasting by sustaining the expression of the PP1 glycogen-targeting proteins PTG and GL. (A) Real-time qPCR analysis of the expression of key glucose output genes in livers from WT and Per2Brdm1 mice collected after 8 h of fasting (TP3) following a controlled refeeding period. (B) Real-time qPCR analysis of the expression of key genes in glycogen metabolism in livers from WT and Per2Brdm1 mice described above. (C) Representative immunoblot analysis of glycogen phosphorylase protein levels from livers of WT and Per2Brdm1 mice. (D) Quantification of the immunoblots in C. (E) Glycogen phosphorylase activity was measured in livers from the WT and Per2Brdm1 mice described above. Data are expressed as means; standard errors are indicated. P values were calculated using the Student t-test.
Altogether our results show that PER2 is required to sustain GL and to a higher extent PTG expression in liver during fasting. Thus the decreased hepatic glycogen content observed in 8 h fasted Per2Brdm1 mice compared to WT mice (Figure 4D) can be largely explained by elevated glycogen phosphorylase activity (Figure 6E) due to reduced expression of GL and most importantly PTG (Figure 6B).
3.8. The expression of PER2 and of the molecular clock during controlled fasting and refeeding is strongly food-dependent
Our data from the controlled fasting refeeding experiment show that PER2 expression is maximal during refeeding and minimal during acute fasting (Figure 4E). However, from this data it is not clear to which extent the expression of PER2, and of other components of the molecular clock, is dynamically driven by nutrients or it is consequent to a pre-determined rhythm. To answer this question we have fasted, refed, and fasted again one group of WT mice as described in Figure 4A, and another group of WT mice was sacrificed at the same time points without refeeding (continuous fasting). The results show that the induction of PER2 expression, observed during refeeding (TP2), is totally dependent on food as mice kept in continuous fasting display reduced PER2 levels at TP2 compared to TP1 (Figure 7A). This dependency on food for rhythmic expression was observed also for the other clock genes (Figure 7A), but the magnitude to which PER2 expression was affected was remarkable. These data show that the expression of the hepatic oscillator, and in particular of PER2, during the controlled fasting–refeeding experiment depends on the food administration at TP2.
Figure 7.
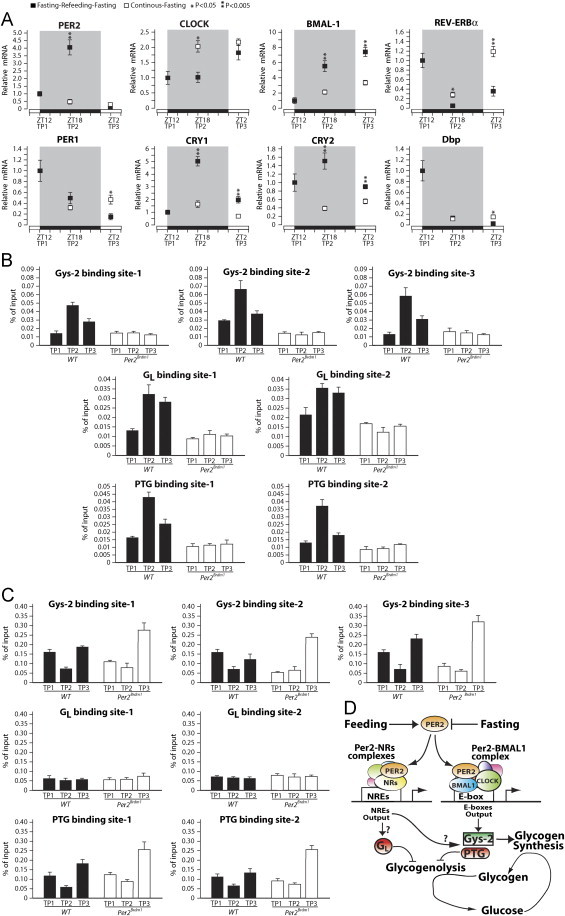
Fasting and feeding dynamically control PER2 expression and binding to Gys-2, PTG, and GL genomic regions. (A) WT mice were fasted and refed as described in Figure 4A (dark squares) or fasted for the entire period (open squares) livers were collected at the indicated time points and the expression of clock genes was measured by quantitative PCR. (B) PER2 binding to Gys-2, PTG, and GL promoter regions during fasting and refeeding was evaluated by quantitiative CHIP assay using specific antibodies against PER2. (C) BMAL-1 binding to Gys-2, PTG, and GL promoter regions was evaluated by quantitiative CHIP assay using specific antibodies against BMAL-1. (D) A model for the role of PER2 in the promotion of glucose accumulation into hepatic glycogen is proposed.
3.9. PER2 binding to Gys-2, GL, and PTG genomic regions
In a recent study large-scale chromatin immunoprecipitation sequencing (ChIP-seq) was performed to identify the DNA-binding sites of the core transcriptional clock components in the mouse liver [25]. In the ChIP-seq database from the study above it is reported that PER2 binds in a circadian manner three different sites of the Gys-2 genomic region, two binding sites at the GL locus, and two sites at the PTG gene, indicating a direct role for PER2 in the expression of these genes. The same DNA-binding sites were also occupied by BMAL-1 in a circadian manner but with a different circadian profile than PER2 [25]. To further analyze PER2 binding to Gys-2, GL, and PTG genes we have performed quantitative PCR-chromatin immunoprecipitation (qPCR-ChIP) analysis of the DNA binding sites above in livers from WT and Per2Brdm1 mice using either PER2 or BMAL-1 specific antibodies. As control we measured PER2 and BMAL-1 binding to Bmal-1 and Rev-Erbα promoters as described [24] (Supplemental Figure 5) and we have performed the qPCR-ChIP analysis on livers from Per2Brdm1 mice. The results show that PER2 binds to the Gys-2, GL, and PTG binding sites, with a maximal binding activity during refeeding “TP2” but that was significant also during acute fasting “TP3” (Figure 7B). We could observe a significant binding of BMAL1 to Gys-2, and PTG genomic regions but not to GL (Figure 7C). Furthermore BMAL-1 binding to Gys-2, and PTG was minimal at refeeding when PER2 binding was maximal.
Overall these data show that during controlled fasting and refeeding PER2 binds to Gys-2, GL, and PTG genes with a peak at refeeding. BMAL-1 binds to the same regions at the Gys-2 and PTG genes. However, BMAL-1 and PER2 display a different binding kinetic to Gys-2 and PTG sites and we could not detect BMAL-1 binding to the PER2 binding sites at the GL locus.
4. Discussion
To cope with the daily rhythmic uptake of nutrients hepatic glycogen content undergoes large circadian fluctuations to maintain blood glucose within the physiological narrow range. Yet the mechanisms controlling the rhythmic accumulation and mobilization of liver glycogen are only partially understood. Our results here indicate that the core clock protein PER2 controls a gene expression program that promotes glucose storage to hepatic glycogen in response to feeding and that reduces glycogenolysis during acute fasting. We show that mice lacking a functional PER2 display a complex metabolic phenotype including altered rhythms of glycogen metabolism, decreased fasting glycemia at specific circadian time points, altered food intake, and altered rhythmic expression of the hepatic oscillator and of several genes implicated in carbohydrate metabolism (Figures 1–3). The fasting glycemia kinetic of Per2Brdm1 mice and WT mice shows that the difference among genotypes is maximal between 4 and 8 h of fasting, when glycogen is an important source of glucose, and then this difference closes at later time points, where gluconeogenesis is the major source of glucose (Figure 1A). We have observed altered expression of gluconeogenesis gene ontology terms (Figure 1C and D), altered expression of PEPCK, and reduced blood glucose during pyruvate tolerance in Per2Brdm1 mice compared to WT mice (Figure 2B-D). These results indicate decreased gluconeogenesis in Per2Brdm1 mice. Still, under controlled fasting condition, the expression of PEPCK or of the key glucose output genes G6PT and GLUT-2 was similar between genotypes (Figure 6). Importantly, we show that under controlled refeeding and fasting conditions PER2 is required for efficient glycogen storage despite identical food intake. The fact that Per2Brdm1 mice and WT mice gained the same weight during refeeding and lost the same weight during fasting (Supplemental Figure 4D-F) suggests that differences in hepatic glycogen are unlikely due to altered feeding efficiency (e.g. thermogenesis). This role of PER2 in glycogen metabolism can be explained by its action on the expression of the glycogen synthase gene Gys-2 during refeeding (Figure 5) and on the negative regulators of glycogen phosphorylase activity PTG and GL during fasting (Figure 6). Our data do not exclude a possible extra-hepatic action for PER2 in glycogen metabolism. However, whereas we observed reduced insulin levels in Per2Brdm1 mice during fasting (Supplemental Figure 4A), insulin levels during refeeding, glucagon levels, and insulin/glucagon ratio during refeeding and fasting were similar between genotypes (Supplemental Figure 4B and C). Furthermore, we did not observe altered kidney function or an elevation of circulating vasopressin, which could affect hepatic glycogen metabolism (Supplemental Figure 3). Although we evaluated the circulating levels of major hormones controlling glycogen metabolism (insulin, glucagon, and vasopressin) we have not tested the hepatic sensitivity of WT and Per2Brdm1 mice to these hormones. Therefore for the future it will be important to investigate whether PER2 affects hepatic sensitivity to systemic signals controlling glycogen metabolism. However, we observed that PER2 binds to Gys-2, PTG and GL genes indicating a direct role for PER2 in the control of the expression of these key players in glycogen metabolism. We show that PER2 binds to Gys-2, PTG and GL genomic regions with a peak of binding at refeeding “TP2”, when glycogen is synthesized, and we have observed elevated binding also during acute fasting “TP3”, when glycogen is mobilized (Figure 7B). It was proposed that PER2 binds to DNA in complex with either BMAL-1 and CLOCK or with nuclear receptors [24]. Our data, consistently with a previous study [25], show that BMAL-1 binds to the same PER2 binding regions at the Gys-2 and PTG genes (Figure 7C). Hence it is likely that PER2 binds to these sequences in a complex with BMAL-1. However, BMAL-1 binding to Gys-2 and PTG genes was minimal at refeeding “TP2”, when PER2 binding was maximal. Furthermore, we could not observe significant BMAL-1 binding to the PER2 binding sites at the GL locus. Thus it is possible that at specific time points PER2 may bind to sequences at the Gys-2, PTG and GL genes independently from BMAL-1 (e.g. in a complex with a nuclear receptor).
We show that PER2 expression in the mouse liver is induced by refeeding following fasting and is suppressed by starvation (Figure 7A). This gene expression pattern was not a predetermined self-sustained cyclic expression as mice kept fasted and sacrificed at the same time points did not display the peak of PER2 expression observed during refeeding (Figure 7A). Thus cyclic expression of PER2 is potently and rapidly driven by food. We have observed that the expression pattern of other genes of the molecular clock was also food dependent (Figure 7A). Therefore from our data it is not clear whether nutrients control PER2 expression directly or via another component of the hepatic oscillator. Nonetheless, others have shown that in genetic models where the rhythmic expression of the hepatic oscillator was disrupted, either by REV-ERBα overexpression or Bmal1 deletion, PER2 was the only clock gene retaining normal circadian expression [31,32]. Hence, PER2 expression could be directly modulated by feeding and fasting sensing pathways. It is also important to consider that our controlled fasting–refeeding–fasting experiment was performed starting the refeeding at the beginning of the dark phase, which is the physiological activity/feeding phase. Thus it remains to investigate whether this molecular mechanism has the flexibility to be recruited during the light phase, the physiological resting/starvation phase.
A model describing our understanding of the role of PER2 in the control of the hepatic glycogen metabolic response to rhythmic food intake is shown in Figure 7D. PER2 expression is induced during feeding and is suppressed during prolonged fasting. PER2 binds to specific genetic sequences at the Gys-2, PTG and GL genes with a maximal binding activity during refeeding and with a significant binding during acute fasting. For Gys-2 and PTG genomic sequences the PER2 binding may occur via a BMAL-1 complex. However, our data suggest that PER2 may bind to the GL gene in a BMAL-1 independent manner, possibly in a complex with nuclear receptors. We do not exclude that nuclear receptors could be implicated in PER2 binding to the Gys-2 and PTG genomic sites at specific time points and in particular during refeeding. The final outcome is that PER2 promotes efficient glycogen storage during feeding by sustaining Gys-2 gene expression, whereas during acute fasting PER2 limits glycogenolysis by sustaining the expression of GL and PTG.
It thus emerges that an important function of the circadian protein PER2 is to promote liver glycogen storage during refeeding and acute fasting. Our study provides original insights on the homeostatic mechanisms controlling rhythmic hepatic glycogen accumulation and mobilization, an important process contributing to maintain blood glucose within its physiological narrow range.
Conflict of interest
The authors wish to confirm that there are no known conflicts of interest associated with this publication and there has been no significant financial support for this work that could have influenced its outcome.
Acknowledgments
This project was supported by the Swiss National Science Foundation Grants 31003A-118172 and 31003A_135684 to G.S.
Footnotes
This is an open-access article distributed under the terms of the Creative Commons Attribution-NonCommercial-No Derivative Works License, which permits non-commercial use, distribution, and reproduction in any medium, provided the original author and source are credited.
Appendix A. Supplementary materials
Supplementary data associated with this article can be found in the online version at 10.1016/j.molmet.2013.06.006.
Appendix A. Supplementary materials
Supplementary material
References
- 1.Asher G., Schibler U. Crosstalk between components of circadian and metabolic cycles in mammals. Cell Metabolism. 2011;13:125–137. doi: 10.1016/j.cmet.2011.01.006. [DOI] [PubMed] [Google Scholar]
- 2.Sahar S., Sassone-Corsi P. Regulation of metabolism: the circadian clock dictates the time. Trends in Endocrinology and Metabolism. 2012;23:1–8. doi: 10.1016/j.tem.2011.10.005. [DOI] [PMC free article] [PubMed] [Google Scholar]
- 3.Huang W., Ramsey K.M., Marcheva B., Bass J. Circadian rhythms, sleep, and metabolism. Journal of Clinical Investigation. 2011;121:2133–2141. doi: 10.1172/JCI46043. [DOI] [PMC free article] [PubMed] [Google Scholar]
- 4.Ishikawa K., Shimazu T. Daily rhythms of glycogen synthetase and phosphorylase activities in rat liver: influence of food and light. Life Sciences. 1976;19:1873–1878. doi: 10.1016/0024-3205(76)90119-3. [DOI] [PubMed] [Google Scholar]
- 5.Ishikawa K., Shimazu T. Circadian rhythm of liver glycogen metabolism in rats: effects of hypothalamic lesions. American Journal of Physiology. 1980;238:E21–E25. doi: 10.1152/ajpendo.1980.238.1.E21. [DOI] [PubMed] [Google Scholar]
- 6.Stephan F.K., Zucker I. Circadian rhythms in drinking behavior and locomotor activity of rats are eliminated by hypothalamic lesions. Proceedings of the National Academy of Sciences of the United States of America. 1972;69:1583–1586. doi: 10.1073/pnas.69.6.1583. [DOI] [PMC free article] [PubMed] [Google Scholar]
- 7.Moore R.Y., Eichler V.B. Loss of a circadian adrenal corticosterone rhythm following suprachiasmatic lesions in the rat. Brain Research. 1972;42:201–206. doi: 10.1016/0006-8993(72)90054-6. [DOI] [PubMed] [Google Scholar]
- 8.Schibler U., Sassone-Corsi P. A web of circadian pacemakers. Cell. 2002;111:919–922. doi: 10.1016/s0092-8674(02)01225-4. [DOI] [PubMed] [Google Scholar]
- 9.Albrecht U. Timing to perfection: the biology of central and peripheral circadian clocks. Neuron. 2012;74:246–260. doi: 10.1016/j.neuron.2012.04.006. [DOI] [PubMed] [Google Scholar]
- 10.Damiola F., Le Minh N., Preitner N., Kornmann B., Fleury-Olela F., Schibler U. Restricted feeding uncouples circadian oscillators in peripheral tissues from the central pacemaker in the suprachiasmatic nucleus. Genes and Development. 2000;14:2950–2961. doi: 10.1101/gad.183500. [DOI] [PMC free article] [PubMed] [Google Scholar]
- 11.Stokkan K.A., Yamazaki S., Tei H., Sakaki Y., Menaker M. Entrainment of the circadian clock in the liver by feeding. Science. 2001;291:490–493. doi: 10.1126/science.291.5503.490. [DOI] [PubMed] [Google Scholar]
- 12.Vollmers C., Gill S., DiTacchio L., Pulivarthy S.R., Le H.D., Panda S. Time of feeding and the intrinsic circadian clock drive rhythms in hepatic gene expression. Proceedings of the National Academy of Sciences of the United States of America. 2009;106:21453–21458. doi: 10.1073/pnas.0909591106. [DOI] [PMC free article] [PubMed] [Google Scholar]
- 13.Kohsaka A., Laposky A.D., Ramsey K.M., Estrada C., Joshu C., Kobayashi Y. High-fat diet disrupts behavioral and molecular circadian rhythms in mice. Cell Metabolism. 2007;6:414–421. doi: 10.1016/j.cmet.2007.09.006. [DOI] [PubMed] [Google Scholar]
- 14.Marcheva B., Ramsey K.M., Buhr E.D., Kobayashi Y., Su H., Ko C.H. Disruption of the clock components CLOCK and BMAL1 leads to hypoinsulinaemia and diabetes. Nature. 2010;466:627–631. doi: 10.1038/nature09253. [DOI] [PMC free article] [PubMed] [Google Scholar]
- 15.Turek F.W., Joshu C., Kohsaka A., Lin E., Ivanova G., McDearmon E. Obesity and metabolic syndrome in circadian Clock mutant mice. Science. 2005;308:1043–1045. doi: 10.1126/science.1108750. [DOI] [PMC free article] [PubMed] [Google Scholar]
- 16.Zheng B., Larkin D.W., Albrecht U., Sun Z.S., Sage M., Eichele G. The mPer2 gene encodes a functional component of the mammalian circadian clock. Nature. 1999;400:169–173. doi: 10.1038/22118. [DOI] [PubMed] [Google Scholar]
- 17.Becattini B., Marone R., Zani F., Arsenijevic D., Seydoux J., Montani J.P. PI3K gamma within a nonhematopoietic cell type negatively regulates diet-induced thermogenesis and promotes obesity and insulin resistance. Proceedings of the National Academy of Sciences of the United States of America. 2011;108:E854–E863. doi: 10.1073/pnas.1106698108. [DOI] [PMC free article] [PubMed] [Google Scholar]
- 18.Chomczynski P., Sacchi N. The single-step method of RNA isolation by acid guanidinium thiocyanate-phenol-chloroform extraction: twenty-something years on. Nature Protocols. 2006;1:581–585. doi: 10.1038/nprot.2006.83. [DOI] [PubMed] [Google Scholar]
- 19.Mora A., Lipina C., Tronche F., Sutherland C., Alessi D.R. Deficiency of PDK1 in liver results in glucose intolerance, impairment of insulin-regulated gene expression and liver failure. Biochemical Journal. 2005;385:639–648. doi: 10.1042/BJ20041782. [DOI] [PMC free article] [PubMed] [Google Scholar] [Retracted]
- 20.Roe J.H., Dailey R.E. Determination of glycogen with the anthrone reagent. Analytical Biochemistry. 1966;15:245–250. doi: 10.1016/0003-2697(66)90028-5. [DOI] [PubMed] [Google Scholar]
- 21.Aiston S., Agius L. Leptin enhances glycogen storage in hepatocytes by inhibition of phosphorylase and exerts an additive effect with insulin. Diabetes. 1999;48:15–20. doi: 10.2337/diabetes.48.1.15. [DOI] [PubMed] [Google Scholar]
- 22.Latsis T., Andersen B., Agius L. Diverse effects of two allosteric inhibitors on the phosphorylation state of glycogen phosphorylase in hepatocytes. Biochemical Journal. 2002;368:309–316. doi: 10.1042/BJ20021070. [DOI] [PMC free article] [PubMed] [Google Scholar]
- 23.Ripperger J.A., Schibler U. Rhythmic CLOCK-BMAL1 binding to multiple E-box motifs drives circadian Dbp transcription and chromatin transitions. Nature Genetics. 2006;38:369–374. doi: 10.1038/ng1738. [DOI] [PubMed] [Google Scholar]
- 24.Schmutz I., Ripperger J.A., Baeriswyl-Aebischer S., Albrecht U. The mammalian clock component PERIOD2 coordinates circadian output by interaction with nuclear receptors. Genes and Development. 2010;24:345–357. doi: 10.1101/gad.564110. [DOI] [PMC free article] [PubMed] [Google Scholar]
- 25.Koike N., Yoo S.H., Huang H.C., Kumar V., Lee C., Kim T.K. Transcriptional architecture and chromatin landscape of the core circadian clock in mammals. Science. 2012;338:349–354. doi: 10.1126/science.1226339. [DOI] [PMC free article] [PubMed] [Google Scholar]
- 26.Grimaldi, B., Bellet, M.M., Katada, S., Astarita, G., Hirayama, J., Amin, R.H., et al., 2010. PER2 controls lipid metabolism by direct regulation of PPARγ. Cell Metabolism 12:509–20. [DOI] [PMC free article] [PubMed]
- 27.Gerich J.E., Meyer C., Woerle H.J., Stumvoll M. Renal gluconeogenesis: its importance in human glucose homeostasis. Diabetes Care. 2001;24:382–391. doi: 10.2337/diacare.24.2.382. [DOI] [PubMed] [Google Scholar]
- 28.Zuber A.M., Centeno G., Pradervand S., Nikolaeva S., Maquelin L., Cardinaux L. Molecular clock is involved in predictive circadian adjustment of renal function. Proceedings of the National Academy of Sciences of the United States of America. 2009;106:16523–16528. doi: 10.1073/pnas.0904890106. [DOI] [PMC free article] [PubMed] [Google Scholar]
- 29.eillet C.A., Ripperger J.A., Magnone M.C., Dulloo A., Albrecht U., Challet E. Lack of food anticipation in Per2 mutant mice. Current Biology. 2006;16:2016–2022. doi: 10.1016/j.cub.2006.08.053. [DOI] [PubMed] [Google Scholar]
- 30.Carvas J.M., Vukolic A., Yepuri G., Xiong Y., Popp K., Schmutz I. Period2 gene mutant mice show compromised insulin-mediated endothelial nitric oxide release and altered glucose homeostasis. Frontiers in Physiology. 2012;3:337. doi: 10.3389/fphys.2012.00337. [DOI] [PMC free article] [PubMed] [Google Scholar]
- 31.Kornmann B., Schaad O., Bujard H., Takahashi J.S., Schibler U. System-driven and oscillator-dependent circadian transcription in mice with a conditionally active liver clock. PLos Biology. 2007;5:e34. doi: 10.1371/journal.pbio.0050034. [DOI] [PMC free article] [PubMed] [Google Scholar]
- 32.Lamia K.A., Storch K.F., Weitz C.J. Physiological significance of a peripheral tissue circadian clock. Proceedings of the National Academy of Sciences of the United States of America. 2008;105:15172–15177. doi: 10.1073/pnas.0806717105. [DOI] [PMC free article] [PubMed] [Google Scholar]
Associated Data
This section collects any data citations, data availability statements, or supplementary materials included in this article.
Supplementary Materials
Supplementary material