

Abstract
Lipocalin-2 (LCN2) is induced in conditions of obesity and Type 2 diabetes (T2DM). IFNγ and TNFα induce LCN2 expression in adipocytes in a manner that is dependent on transcription. The effects of these cytokines are additive. IFNγ induced STAT1 and TNFα induced NF-κB play a role in the induction of LCN2. In the LCN2 promoter, one NF-κB binding site and four STAT1 binding sites were identified by in silico and in vitro approaches. MAPK (ERKs 1 and 2) activation was required for the IFNγ and TNFα induction of LCN2 expression, but did not affect the nuclear translocation or DNA binding activity of STAT1 or NF-κB. The NF-κB binding site and the STAT1 binding sites we identified in vitro were confirmed by in vivo studies. Transfection of a LCN2 promoter/luciferase reporter construct confirmed acute activation by IFNγ and TNFα. Our studies identify mechanisms involved in the actions of cytokines secreted from immune cells in adipose tissue that induce LCN2 expression in conditions of obesity and T2DM.
Keywords: Lipocalin-2, STAT1, NF-κB, ERKs, Adipocyte, TNFα, IFNγ
1. Introduction
Adipose tissue is a major insulin sensitive tissue that plays key roles in regulating energy metabolism and insulin sensitivity [1–3]. Chronic inflammation and infiltration of immune cells in adipose tissues has been demonstrated to modulate adipocyte function and result in alterations of hormone secretion and insulin sensitivity [4,5]. TNFα and IFNγ are important pro-inflammatory cytokines that are known to be secreted from immune cells that infiltrate into adipose tissues [4,6,7]. These immune cells have the ability to induce insulin resistance in both cultured adipocytes and experimental animal models [6,8–10]. IFNγ signals via activating Janus kinase (JAK)-signal transducer and activator of transcription 1 (STAT1) signaling pathway and extracellular signal-regulated kinases (ERKs) mediated signaling pathway [10,11]. TNFα utilizes various signaling pathway and can stimulate both nuclear factor kappa B (NF-κB) signaling pathway and ERKs mediated signaling pathway [12,13].
Lipocalins are a family of proteins that bind and transport small or hydrophobic molecules with conserved ligand binding sites [14]. As a member of the lipocalin family, lipocalin-2 (LCN2), also called neutrophil gelatinase-associated lipocalin (NGAL), was initially discovered as a matrix metalloproteinase 9 (MMP-9) binding protein that attenuated MMP-9 degradation [15]. Studies have shown that LCN2 increases during exposure to invading bacteria [16] and can be bound to bacterial siderophores to limit bacterial growth by reducing iron uptake [17,18]. More recent research has revealed that LCN2 is secreted from mature adipocytes [19]. Expression of LCN2 is significantly up-regulated in conditions of insulin resistance and type 2 diabetes (T2DM) [20]. Human studies indicate that circulating LCN2 positively correlates with adiposity, triglyceride, blood glucose level, insulin resistance, and is negatively related to high-density lipoprotein cholesterol [21,22]. However, the roles of LCN2 in the pathology of adipose tissue insulin resistance are still unclear. There is evidence that LCN2 can induce the expression of PPARγ and adiponectin [23] and that administration of LCN2 attenuates the inhibitory effect of TNFα on insulin-stimulated glucose uptake [23]. However, other data indicates that knockdown of LCN2 improves insulin action in adipocytes [20]. In order to clarify the functions of LCN2 in whole body insulin sensitivity, LCN2 knockout mice have been generated by several labs. However, the results of these studies have further clouded our understanding of the functions of LCN2 and the topic is even more controversial. In one study, global LCN2 deficiency caused dyslipidemia, fatty liver and insulin resistance [24]. On the contrary, a separate study indicated that LCN2 null mice had improved aging and obesity-mediated insulin resistance [25], supporting the notion that the lack of LCN2 is metabolically favorable. The most recent characterization of LCN2 deficient mice indicates that LCN2 deficiency did not have a significant effect on age or obesity-induced insulin resistance [26]. Collectively, these studies suggest that the roles of LCN2 in modulating insulin sensitivity are still unclear. Nonetheless, there are numerous studies and clear and convincing evidence to demonstrate that modulation of LCN2 in mice and humans significantly affects insulin sensitivity. Our studies have focused on understanding the regulation of LCN2 expression by factors that contribute to the pathogenesis of insulin resistance.
To enhance our understanding of LCN2 in obesity and insulin resistance, we performed mechanistic studies to examine how LCN2 expression is induced in adipocytes. Our results demonstrate that the increase of LCN2 expression is mediated by pro-inflammatory cytokines that are present in adipose tissue in conditions of insulin resistance in mice and man. We observed that LCN2 expression and secretion was induced by IFNγ and TNFα in both murine 3T3-L1 adipocytes and human subcutaneous adipocytes. STAT1 and ERKs 1 and 2 signaling pathways mediated the effects induced by IFNγ and the effects of TNFα on LCN2 expression were mediated by both NF-κB and ERKs 1 and 2 signaling pathways. Our studies of the murine LCN2 promoter identified five STAT1 binding sites and one NF-κB binding site. Inhibition of ERKs signaling pathway attenuated the stimulatory effects of both IFNγ and TNFα on LCN2 expression. Inhibition of ERKs 1 and 2 reduced the activity of STAT1 and NF-κB without having any significant effects on the nuclear localization or DNA binding activity of these pro-inflammatory transcription factors. These mechanistic studies provide insight into the modulation of LCN2 that occurs during insulin resistance.
2. Research design and methods
2.1. Cell culture
Murine 3T3-L1 preadipocytes were grown to 2 days after confluence in Dulbecco's Modified Eagle's Media (DMEM) with 10% bovine serum. Media was changed every 48 h. 0.5 mmol/l 3-isobutyl-methylxanthine, 1 μmol/l dexamethasone, and 1.7 μmol/l insulin (MDI) cocktail were used to induce preadipocytes differentiation in DMEM containing 10% fetal bovine serum (FBS). After 48 h, the media was replaced by DMEM with 10% FBS. For serum deprivation, media was change to DMEM containing 0.3% BSA for 16–20 h before treatment. DMEM was purchased from Sigma. Bovine and FBS were purchased from Hyclone. Human subcutaneous adipocytes in 12-well plates were purchased from Zen-Bio. Cells were serum-deprived for 16 h before treatment. Recombinant mouse and human IFNγ were purchased from R&D Systems. Recombinant mouse and human TNFα were purchased from Gibco. Actinomycin D was purchased from Sigma.
2.2. Preparation of whole cell extracts
Cell monolayers were harvested in a non-denaturing IP buffer that contained 10 mmol/l Tris (pH 7.4), 150 mmol/l NaCl, 1 mmol/l EGTA, 1 mmol/l EDTA, 1% Triton X-100, 0.5% Nonidet P-40, with protease inhibitors 1 μmol/l phenylmethylsulfonyl fluoride, 1 μmol/l pepstatin, 50 mU trypsin inhibitory aprotinin, 10 μmol/l leupeptin, and phosphatase inhibitor 2 mmol/l sodium vanadate. The cells were scraped off the plates and the extract was passed through a 20 g needle three times. The extract was centrifuged at 9500g for 10 min at 4 °C. Supernatants were collected and analyzed with BCA (Pierce) to quantify protein content of whole cell extract.
2.3. RNA analysis
Total RNA was isolated from cell monolayers with RNeasy mini kit (Qiagen). 10 μl of RNA extract was used for reverse transcription PCR. cDNA was analyzed by delta delta ct real-time PCR with SYBR supermix reagent (Takara) and Applied Biosystem 7900HT system. Cyclophilin A was used as endogenous control. Following primers were used for the real-time PCR: mLipocalin-2 forward TGCAAGTGGCCACCACGGAG and reverse GCATTGGTCGGTGGGGACAGAGA; mCyclophilin A forward CCACTGTCGCTTTTCGCCGC and reverse TGCAAACAGCTCGAAGGAGACGC.
2.4. 3T3-L1-adipocyte fractionation
Cell monolayers were harvested in nuclear homogenization buffer containing 20 mmol/l Tris (pH 7.4), 10 mmol/l NaCl, 3 mmol/l MgCl2, 1 μmol/l dithiothreitol, with protease inhibitors listed above and 2 mmol/l sodium vanadate. Nonidet P-40 was added to final concentration of 0.15%. Cells were homogenized with 18 strokes in a Dounce homogenizer and centrifuged at 500g for 5 min. Supernatants were transferred to another tube as cytosolic extract. The precipitated nuclear pellets were resuspended in one-half volume of nuclear homogenization buffer and were centrifuged as before. The supernatant was removed and discarded. The majority of the pellet (intact nuclei) was resuspended in nuclear extraction buffer containing 20 mmol/l HEPES (pH 7.9), 150 mmol/l NaCl or 420 mmol/l NaCl, 1.5 mmol/l MgCl2, 0.2 mmol/l EDTA, 1 μmol/l dithiothreitol, 25% glycerol and the with protease inhibitors listed above with 2 mmol/l sodium vanadate. Resuspended nuclei were passed three times through a 20G needle every 10 min and extracted for 30 min on ice. The samples were centrifuged at 9500g at 4 °C for 10 min. The resulting supernatant was a nuclear extract.
2.5. Gel electrophoresis and immunoblotting
Proteins were separated in 7.5% or 10% polyacrylamide gels containing SDS, and transferred to nitrocellulose membrane (Bio-Rad) in 25 mmol/l Tris, 192 mmol/l glycine, and 20% methanol. After transfer, the membrane was blocked in 4% milk for 1 h at room temperature, and incubated with primary antibody overnight at 4 °C. Results were visualized with horseradish peroxidase-conjugated secondary antibodies (Jackson ImmunoResearch Laboratory) and enhanced chemiluminescence (Pierce). STAT1 antibody was purchased from Cell Signaling Technology. Lipocalin-2 antibody was from R&D System. STAT5A, p65, ERK1/2 antibodies were from Santa Cruz technology. Adiponectin antibody was from Thermo-Pierce. STAT1pY antibody was from Millipore. Active ERK1/2 antibody was from Promega.
2.6. Electrophoretic mobility shift analysis
Double-stranded oligonucleotides were annealed by heating single-stranded oligonucleotides in 95 °C water bath and gradually cooling to room temperature. 4 μg double-stranded oligonucleotides were labeled with 20 μCi [α-P32]dCTP (PerkinElmer) and 1 μl of each 5 mM dATP, dTTP, dGTP using Klenow fragment. The mix was incubated for 15 min at 30 °C. The reaction was stopped by adding 1 μl of 0.5 M EDTA. Labeled double-stranded oligonucleotides were purified with illustra MicroSpin G-25 Columns (GE Healthcare) according to manufacturer's instructions. Radioactivity of labeled oligonucleotides was determined by scintillation counting. Nuclear extracts were incubated with the labeled oligonucleotides for 30 min on ice. The samples were separated in a pre-run (30 min, 200 V at 4 °C) 6% acrylamide/bisacrylamide TBE gel. Nuclear extracts were pre-incubated with 1 μg antibody (STAT1, STAT3, STAT5A, STAT5B or p65 from Santa Cruz Technology) for 1 h at room temperature for supershift assay. The gels were run at 200 V for ~3.5 h, dried at 80 °C for 45 min with vacuum, and then exposed to Eastman Kodak Co. BioMax MS film with a Kodak BioMax high energy intensifying screen.
2.7. Chromatin immunoprecipitation
ChIP assay was performed with SimpleChIP® Enzymatic Chromatin IP Kit (Cell Signaling Technology) according to the protocol supplied by company. Cells were serum deprived overnight in DMEM containing 0.3% bovine serum. Cells were treated with IFNγ or TNFα for 30 min in the presence or absence of UO129, an ERK inhibitor (Promega). Adipocytes were cross-linked with formaldehyde and glycine. Chromatin extracts were prepared after sonication of harvested cells. Immunoprecipitation was performed with specific STAT1 (Cell Signaling Technology) or p65 (Cell Signaling Technology) antibodies. Rabbit normal IgG was used as a negative control. Purified DNA was quantified by real-time PCR with following primers: -266 forward GTGGACAGGCAGTCCAGATCTGAG and reverse AAGATTTCTGTCCCTCTCTCCCCC; -619 forward CTGTTCCTGTAAATGGCAGTGGGG and reverse GGGTGAGCAAGCTGAGAGTGAATG; -676 forward TAAGGACTACGTGGCACAGGAGAG and reverse GAAGTGTCCAATACCTTGAGCCCC; -1014 forward GCTTCTGCCCAAAGTAACTGGAGT and reverse TAAGGACTGCAACCTCGGTGTCAT; -1822 forward CTGCCCTGAGTGTTGGGTTCAAAG and reverse CTGGGGATGTAGCTCTCTGGTGTT; -3171 forward TAGTCCTGCATTCAGTTTGCAGGC and reverse ACCCAGGTCCAATCCACATGAAGA. 500 nM of each primer and 2 μl ChIP product were used with SYBR green supermix and ROX buffer (Takara) in 20 μl PCR reaction. Percentage of input was calculated by the formula: Percentage of input=2%×2(C[T] 2% input sample−C[T] IP sample).
2.8. Plasmid constructs
A 3470 bp-fragment of lipocalin-2 promoter (−3358 to 112) was cloned from genomic DNA of mouse liver. The fragment was amplified with following primers: forward: GATCGGTACCAAAGGGCTCTCCAGGTTCTC; reverse: GATCGATATCGGCAGGGATCAAGTTCTGAG. Nucleotides were added to the 5′ ends of each primer so that the forward primer could be digested by KpnI and the reverse primer by EcoRV for ligation into the pGL4.27 vector to create pGL4.27-LCN2pro. Plasmids were sequenced for verification of nucleotide sequence.
2.9. Plasmid transfection and luciferase reporter assays
Mature 3T3-L1 adipocytes in six-well plates were transfected with 2 μg pGL4.27-LCN2pro by using Dharmacon turboFect reagent (ThermoScientific). 2 μg pRL-TK/renilla vector was co-transfected to control transfection efficiency. After 24 h, the adipocytes were pretreated with UO126 for 30 min and that was followed by IFNγ or TNFα treatment for 24 h. Cell lysis was prepared with passive lysis buffer. Luciferase activity was measured with the Dual Luciferase Reporter System (Promega). Relative luciferase units were calculated by dividing firefly luciferase activity values by renilla luciferase activity. Each condition was performed in triplicate and on three independent batches of adipocytes.
3. Results
3.1. Lipocalin-2 expression and secretion is up-regulated by pro-inflammatory cytokines
Previous studies showed that lipocalin-2 is expressed in adipocytes and increased in obese and diabetic subjects [20]. However, the mechanisms involved in the induction of LCN2 expression are unknown. In our studies, we observed that both IFNγ and TNFα induced the expression and secretion of LCN2. Whole cell extracts and media samples were prepared from 3T3-L1 adipocytes that were untreated or treated for 24, 48, or 72 h. As shown in Figure 1A and B, LCN2 expression and secretion were induced by IFNγ and TNFα treatment within 24 h. After 24 h IFNγ treatment, the cellular levels of LCN2 were induced and remained high. However, the effect of TNFα on LCN2 levels increased over time. Since adiponectin expression and secretion is attenuated by both IFNγ and TNFα [27,28], we used it as control to assess the effectiveness of cytokine treatment. STAT5A was used as a loading control. As expected, cytokine treatment decreased adiponectin levels, but did not affect STAT5A expression. To determine if the observed effects were dependent on new transcription, we pretreated 3T3-L1 adipocytes with Actinomycin D for 30 min, followed by a IFNγ or TNFα treatment. As shown in Figure 1C, TNFα is a more potent inducer of LCN2 mRNA than IFNγ. In addition, the presence of Actinomycin D inhibited the ability of both inflammatory mediators to induce LCN2 mRNA expression.
Figure 1.
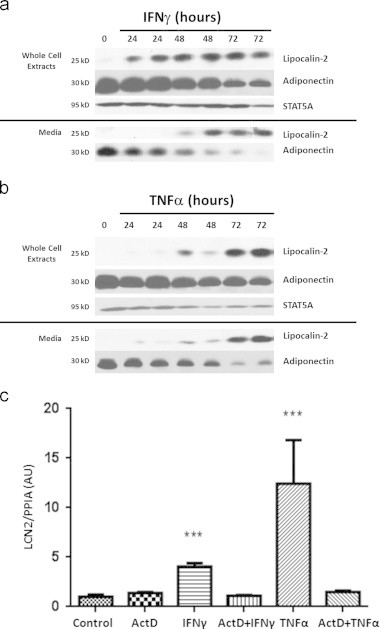
IFNγγ and TNFαα induce LCN2 expression and secretion in 3T3-L1 adipocytes. A: Mature 3T3-L1 adipocytes were chronically treated with 100 ng/ml IFNγ γ. Media was collected and whole cell extract was harvested at indicated time. Time 0 indicates no treatment. 250 µg protein from media samples and 150 µg of whole cell extracts were subjected to western blot analysis. B: Mature 3T3-L1 adipocytes were chronically treated with 0.5 nM TNFαα and samples were analyzed as indicated above. C: Adipocytes were pretreated with 5 µg/ml Actinomycin D for 30 min, and then treated with IFNγγ or TNFαα for 16 h. Total RNA was isolated and analyzed with reverse transcription and qPCR. Cyclophilin A was used as an endogenous control. These are representative experiments independently performed three times.
3.2. The effects of IFNγ and TNFα on LCN2 expression are additive
Next, we evaluated whether IFNγ and TNFα induced LCN2 expression by activating the same or different signaling pathways in adipocytes. Mature 3T3-L1 adipocytes were treated for 16 h and total RNA was isolated and analyzed by quantitative real-time PCR. As shown in Figure 2A, TNFα is a more potent inducer of LCN2 mRNA than IFNγ. However, the presence of both IFNγ and TNFα always resulted in at least an additive effect on LCN2 expression. This additive effect is also observed with LCN2 protein expression and secretion (Figure 2B). Collectively, these data indicate that IFNγ and TNFα affected LCN2 expression via stimulating different signaling pathways.
Figure 2.
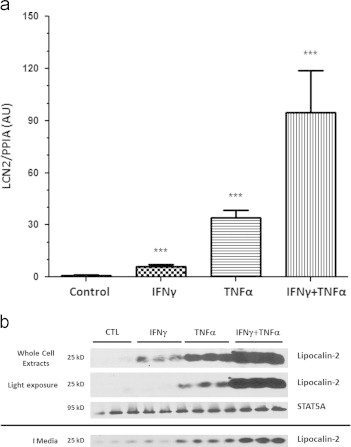
The effect of IFNγγ and TNFαα on LCN2 expression are additive. Mature 3T3-L1 adipocytes were treated with 100 ng/ml IFNγγ or 0.5 nM TNFαα or both cytokines. A: RNA was isolated 16 h later and subject to reverse transcription and qPCR. B: Whole cell extracts and media samples were collected after a 24 h treatment. 250 µg of protein from media samples and 150 µg of whole cell extracts were analyzed by western blot analysis. These are representative experiments performed with three biological replicates and independently performed on three batches of cells.
3.3. Identification of NF-κB and STAT1 binding sites in lipocalin-2 promoter
Since the induction of LCN2 expression by IFNγ or TNFα appeared to be mediated by different signaling pathways, we examined several signaling pathways known to mediate the effects of IFNγ and TNFα. We examined the role of STAT1, NF-κB and ERK1/2 signaling pathways in the ability of IFNγ and TNFα to induce LCN2 expression. First, we performed an analysis to search for potential STAT1 and NF-κB sites in the promoter of the murine LCN2 gene. Three potential NF-κB binding sites (Table 1) and nine potential STAT1 binding sites (Table 2) were identified by sequence analysis and experimentally examined by performing both electrophoretic mobility shift assays (EMSA) and chromatin immunoprecipitation (ChIP). Only one of the potential NF-κB binding sites was confirmed to interact with nuclear extracts from TNFα treated adipocytes and binding specificity was assessed by performing cold competition and generating a mutated binding site (Figure 3A and Tables 3 and 4). An increase of cold competitor reduced the interaction between radioactively labeled probe and nuclear protein. A mutated probe (Table 2) did not associate with nuclear protein. A specific p65 antibody was used to perform supershift analysis to determine whether NF-κB comprised the DNA binding complex. As indicated in Figure 3B, pre-incubation with a p65 antibody resulted in a supershift of the TNFα induced binding, which suggests that the p65 component of NF-κB is present in the DNA-protein complex. Chromatin immunoprecipitation (ChIP) was also performed to examine the association of p65 with the murine LCN2 promoter. As shown in Figure 3B, p65 bound to the murine LCN2 promoter in vivo.
Table 1.
NF-κκB binding sites in lipocalin-2 promoter.
| Gene | Position | Sequence |
TNFα responsive |
|
|---|---|---|---|---|
| EMSA | ChIP | |||
| Consensus | GGG NNN NNC C | |||
| Lipocalin-2 | −266 to -247 | GC CCT GGG AAT GTC CCT CTG | Yes | Yes |
| Lipocalin-2 | −713 to -694 | GG AGA GGG TGA GTC CCT GAG | No | No |
| Lipocalin-2 | −1795 to -1774 | GAA CTT GGG GTC TCC CAT GTG C | No | No |
Table 2.
STAT1 binding sites in lipocalin-2 promoter.
| Gene | Position | Sequence |
IFNγ responsive |
|
|---|---|---|---|---|
| EMSA | ChIP | |||
| Consensus GAS | TTC N2-4 GAA | |||
| Lipocalin-2 | −160 to −142 | G TAT TTC AAC AGA ATG TAC | No | No |
| Lipocalin-2 | −619 to −602 | GA CAC TTC CAG GAT AAT C | Yes | Yes |
| Lipocalin-2 | −676 to −697 | GT CTG TTC CTG TAA ATG GCA | Yes | Yes |
| Lipocalin-2 | −705 to −688 | GT GAG TCC CTG AGA GTT C | No | No |
| Lipocalin-2 | −1014 to −994 | CCC ACT TTC CCC AAG GGC TCC | No | Yes |
| Lipocalin-2 | −1822 to −1806 | GGT TGT TTC TTT GTA CT | Yes | Yes |
| Lipocalin-2 | −3132 to −3115 | GGA TCC TTG AGA TGC AAC | No | No |
| Lipocalin-2 | −3159 to −3143 | AG AGT TTC TGG ATC CGA | No | No |
| Lipocalin-2 | −3171 to −3152 | CC AGT TTC TGG AAG AGT TTC | Yes | Yes |
Figure 3.
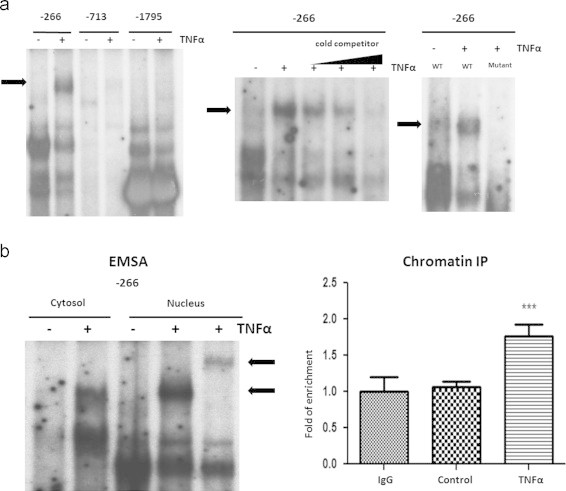
TNFα induces NF-κκB binding to LCN2 promoter. A: Mature 3T3-L1 adipocytes were treated with 0.5 nM TNFαα for 20 min. Cytosolic and nuclear extracts were separated from treated or untreated mature adipocytes. 10 µg of each extract was incubated with 50,000 cpm/µl 32P-labeled double-stranded oligonucleotides of murine LCN2 promoter. Protein–DNA complexes were resolved by EMSA. The TNFαα-responsive shift is indicated with an arrow (left panel). For cold competition, nuclear extracts were incubated with 50,000 cpm/µl 32P-labeled probe and 2 µl unlabeled oligonucleotides of different concentrations (0.4 µM, 2 µM, 10 µM) (middle panel). Nuclear extracts were also incubated with 50,000 cpm/µl 32P-labeled double-stranded probe of LCN2 promoter or probe of mutated sequence (right panel). B (left panel): Cytosolic and nuclear extracts were prepared from mature adipocytes treated with TNFαα for 20 min. For supershift assay, the nuclear protein was pre-incubated with 1 µg indicated antibody for 1 h, and then incubated with 32P-labeled probe and protein–DNA complexes were resolved by EMSA. B (right panel): 3T3-L1 adipocytes were treated or untreated with 0.5 nM TNFαα for 30 min, and then cross-linked with formaldehyde. Chromatin extracts were prepared and subject to immunoprecipitation with IgG (Negative control) or p65 antibody. IP products were analyzed by qPCR. Percentage of input was calculated and normalized to negative control. ***P<0.01. These are representative experiments independently performed three times.
Table 3.
Mutated STAT1 binding sites.
| Gene | Position | Mutated sequence | IFNγ responsive (EMSA) |
|---|---|---|---|
| Lipocalin-2 | −619 to -602 | GA CAC CTC CAG GCT AAT C | No |
| Lipocalin-2 | −676 to -657 | GT CTG TAC CTG TCA ATG GCA | No |
| Lipocalin-2 | −1822 to -1806 | GGT TGT CTC TTT GTC CT | No |
| Lipocalin-2 | −3171 to -3152 | CC AGT CTC TGG ACG AGT TTC | No |
Table 4.
Mutated NF-κκB binding site.
| Gene | Position | Mutated sequence | TNFα responsive (EMSA) |
|---|---|---|---|
| Lipocalin-2 | −266 to -247 | GC CCT GAG AAT GTA CCT CTG | No |
Nine potential STAT1 binding sites were experimentally examined by performing both EMSA and ChIP. EMSA analysis revealed that four of these sites interacted with nuclear protein from IFNγ treated adipocytes (Figure 4A). Specificity was assessed by performing cold competition and generating mutated binding sites (data not shown). Supershift assay was performed with specific STATs antibodies to demonstrate whether these proteins were involved in the DNA binding complex. STAT1 was shown to bind to all four binding sites. To our surprise, STAT5A and STAT5B also interacted with -619, -1822 and -3171 binding sites (Figure 4B). Since growth hormone (GH) is a physiological activator of STAT5A and STAT5B [29], we examined the ability of GH to regulate binding to these STAT sites. However, there was no association detected between labeled oligonucleotides and nuclear protein from GH treated adipocytes (data not shown). When we performed ChIP analysis to test these STAT binding sites, we confirmed the four binding sites that were validated by EMSA and observed STAT1 binding at one additional site (Table 2). Of note, this binding site at −1014 was not positive with nuclear protein in vitro, but was verified by ChIP using a STAT1 antibody (Figure 4C). For all the five STAT1 binding sites, we did not observe any IFNγ induced interaction with STAT5 in vivo (data not shown).
Figure 4.
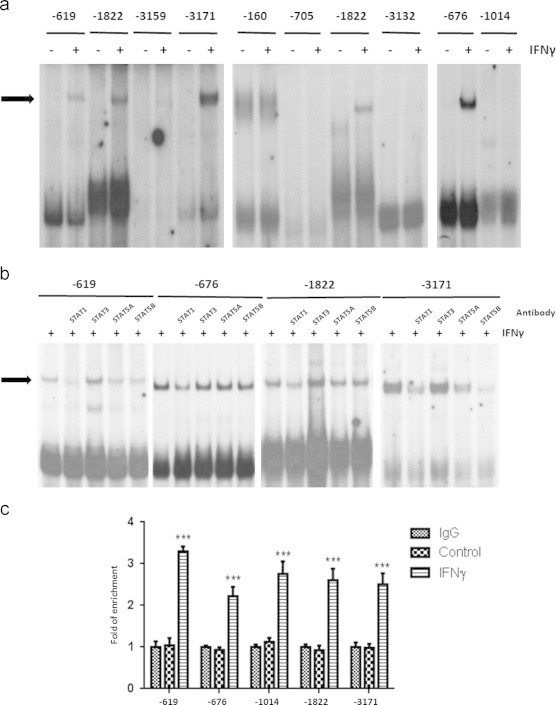
IFNγγ induces STAT1 binding to LCN2 promoter. A: Mature 3T3-L1 adipocytes were treated with 100 ng/ml IFNγγ for 20 min for the preparation of cytosolic and nuclear extracts. There was no binding in any cytosolic extracts (data not shown). 10 µg of nuclear extract was incubated with 50,000cpm/µl 32P-labeled double-stranded oligonucleotides of murine LCN2 promoter. The protein–DNA complexes were resolved by EMSA. The IFNγ γ responsive shift is indicated with an arrow. B: Nuclear extracts were prepared from mature adipocytes treated with IFNγ γ for 20 min. For supershift assay, the nuclear protein was pre-incubated with 1 µg indicated antibody for 1 h, and then incubated with 32P-labeled probe. Protein–DNA complexes were resolved by EMSA. C: 3T3-L1 adipocytes were treated or untreated with 100 ng/ml IFNγ γ for 30 min, and then cross-linked with formaldehyde. Chromatin extracts were prepared and subject to immunoprecipitation with IgG (Negative control) or the STAT1 antibodies indicated in the figure. IP products were analyzed by qPCR. Percentage of input was calculated and normalized to negative control. ***P<0.01. Each panel is representative experiment that was independently performed three times.
3.4. ERK signaling modulates the ability of TNFα and IFNγ to induce LCN2 expression without having significant effects on STAT1 and NF-κB nuclear translocation or DNA binding activity
Besides activating transcription factors like STAT1 and NF-κB, both IFNγ and TNFα acutely activate ERKs 1 and 2 (Figure 5A). Mature adipocytes were pretreated with UO126, a specific ERK inhibitor for 30 min and then nuclear translocation and tyrosine phosphorylation of STAT1 was examined after an IFNγ or TNFα treatment for 20 min. As shown in Figure 5A, the IFNγ induced nuclear translocation and tyrosine phosphorylation of STAT1 was unaffected by ERK inhibition. TNFα induced the nuclear translocation of p65 that was also unaffected by ERK inhibition. The efficacy of ERK inhibition is shown by using a phospho-specific antibody to assess ERK activation. Also, note that IFNγ induced a modest increase in the nuclear content of STAT5A, but did not affect the content of the nuclear protein DBC1. Although, ERK inhibition did not affect the ability of these pro-inflammatory cytokine to induce nuclear translocation of STAT1 and p65, it did have substantial effects on the ability of these cytokines to induce LCN2 expression. As shown in Figure 5B, the induction of LCN2 mRNA levels by IFNγ and TNFα was repressed by ERK inhibition. However, EMSA analysis revealed no alterations in binding to the NF-κB site in the LCN2 promoter in vitro and ChIP analysis suggested that NF-κB binding to this site was not significantly alerted in vivo (P=0.0538). We also examined the STAT1 binding to the LCN2 promoter under conditions where ERK was inhibited. As shown in Figure 5D, there was no difference in binding in vitro or in vivo for any of the STAT1 binding sites identified. To determine if ERK inhibition modulated LCN2 promoter activity in adipocytes, we cloned ~3.5 kb of the murine LCN2 promoter into a pGL4.27 vector expressing firefly luciferase. This vector was transiently transfected into 3T3-L1 adipocytes. A Renilla-TK vector was co-transfected to control for transfection efficiency. One day after transfection, the cells were treated with IFNγ or TNFα for 24 h in the presence or absence of the ERK inhibitor. A dual-luciferase reporter assay was performed to quantitate the expression of luciferase. The results clearly showed that the ~3.5 kb segment, immediately upstream of the transcription start site within the LCN2 promoter was sensitive to both pro-inflammatory cytokines. The promoter activity was highly similar to what we observed for the induction of LCN2 mRNA (refer to Figures 2 and 5). However, UO126 pretreatment abrogated the stimulation of luciferase expression by both IFNγ and TNFα indicating that the inhibition of ERKs impaired the transcription activation activity of STAT1 and NF-κB (Figure 6).
Figure 5.
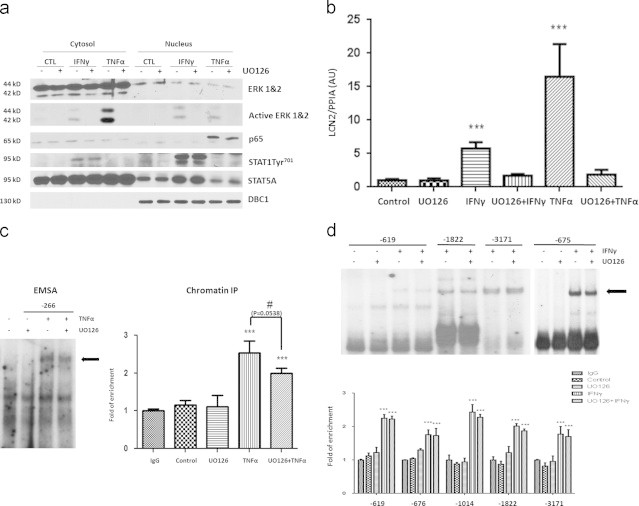
ERK inhibition attenuates the ability of IFNγγ and TNFαα to induce LCN2 without modulating the nuclear translocation or DNA binding activity of STAT1 and NF-κκB. A: Cytosolic and nuclear extracts were prepared from mature 3T3-L1 adipocytes treated or untreated with IFNγγ or TNFαα for 20 min in the presence or absence of 50 µM UO126. 100 µg protein of each sample was subject to Western blot analysis. B: Mature 3T3-L1 adipocytes were pretreated with 50 µM UO126 for 30 min, and then treated with IFNγγ or TNFαα for 16 h. Total RNA was isolated and analyzed with reverse transcription and qPCR. Cyclophilin A was used as endogenous control. ***P<0.01. C: (left panel): Nuclear extracts were separated from adipocytes untreated or treated with TNFαα for 20 min in the presence or absence of UO126. 10 µg of nuclear extract was incubated with 50,000 cpm/µl 32P-labeled double-stranded oligonucleotides of murine LCN2 promoter. Protein–DNA complexes were resolved by EMSA. C (right panel): 3T3-L1 adipocytes were untreated or exposed to TNFαα for 30 min in the presence or absence of UO126, and then cross-linked with formaldehyde. Chromatin extracts were prepared and subject to immunoprecipitation with IgG (Negative control) or p65 antibody. IP products were analyzed by qPCR. Percentage of input was calculated and normalized to negative control. ***P<0.01. D: (upper panel): Nuclear extracts were separated from untreated adipocytes or treated with IFNγγ for 20 min in the presence or absence of UO126. Protein–DNA complexes were resolved by EMSA as described above. (Lower panel): 3T3-L1 adipocytes were untreated or exposed to IFNγγ for 30 min (−/+) UO126, and then cross-linked with formaldehyde. Chromatin IP experiments were performed with STAT1 antibody for each of the LCN2 promoter sites indicated. ***P<0.01. Each panel of this figure is a representative experiment that was performed three times in independent batches of cells.
Figure 6.
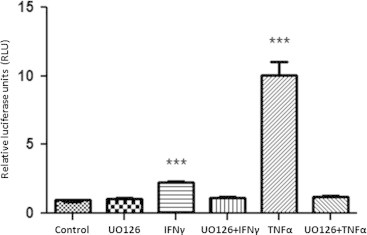
ERKs inhibition impairs the induction of LCN2 promoter by both IFNγ and TNFα in adipocytes. Mature 3T3-L1 adipocytes were transiently transfected with murine lipocalin-2 promoter (-3358 to 112)/luciferase plasmid. A TK/renilla vector was used as control for transfection efficiency. After 24 h post-transfection, adipocytes were pretreated with 50 µM UO126 for 30 min and then stimulated with IFNγ or TNFα for 24 h. Relative light units (RLU) were calculated by dividing firefly luciferase activity by renilla luciferase activity. ***P<0.01. Each condition was performed in triplicate. These are representative experiments independently performed on three different groups of adipocytes.
3.5. IFNγ and TNFα induce lipocalin-2 expression in human subcutaneous adipocytes
An in silico analysis of the human LCN2 promoter revealed five potential STAT1 binding sites at −856, −885, −1405, −1934, and −3610. As shown in Table 5, sequences of all these potential binding sites are largely conserved between mice and humans. Furthermore, the distribution of these sites in the human promoter is comparable with the STAT1 binding sites we characterized in the murine LCN2 promoter. We also identified one potential NF-κB binding site in the human LCN2 promoter at -176 and this is completely conserved between humans and mice (Table 5). Our in silico analysis of the human LCN2 promoter strongly suggests that STAT1 and NF-κB also mediate the induction of LCN2 expression in human adipocytes. In order to determine if the regulation we observed in murine 3T3-L1 adipocytes also occurred in human cells, we purchased human adipocytes. Human IFNγ and TNFα were used to treat human subcutaneous adipocytes for 24 h. As shown in Figure 7A and B, the expression of LCN2 was up-regulated by both IFNγ and TNFα in human adipocytes.
Table 5.
A comparison of STAT1 and NF-κκB binding sites in the murine and human lipocalin-2 promoters.
| Murine |
Human |
|||
|---|---|---|---|---|
| (ENSMUST00000050785) | (ENST00000277480) | |||
| STAT1 (TTCN2–4GAA) | −619 | TTCCAGGATAAT | −856 | TTCAATGGAAAA |
| −676 | TTCCTGTAAA | −885 | TTCCAGAACC | |
| −1014 | TTCAATTGAT | −1405 | TTCCTGGGAA | |
| −1822 | TTCTTTGTAC | −1934 | TTCCCGAGTA | |
| −3171 | TTCTGGAAGA | −3610 | TTCCTGAGATG | |
| NF-κκB (GGGNNNNNCC) | −266 | GGGAATGTCCC | −176 | GGGAATGTCCC |
Figure 7.
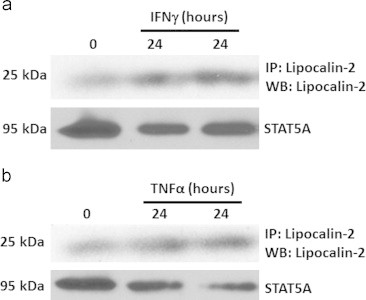
IFNγγ and TNFαα induce LCN2 expression in human adipocytes. Human subcutaneous adipocytes, purchased from Zen-Bio, were treated with 100 ng/ml IFNγγ or 0.5 nM TNFαα. Whole cell extracts were harvested after 24 h. Time 0 indicates no treatment. 300 µg protein was used to perform immunoprecipitation (IP) with a human lipocalin-2 antibody. IP products were analyzed by western blot with the same antibody. This experiment was repeated twice on two different batches of cells.
4. Discussion
The endocrine properties of adipocytes are one of its most critical functions [2]. Leptin and adiponectin are two hormones that are produced exclusively from adipocytes in mouse and man. Like LCN2, these hormones are also implicated in modulating insulin sensitivity and whole body energy balance [2]. Although it is known that LCN2 expression can be highly induced and secreted from adipocytes and LCN2 is significantly regulated in condition of mouse and human obesity, the mechanisms involved in this induction are poorly understood. Lipocalin-2 protein level are elevated in ob/ob mice and db/db mice [20]. In agreement with these animal experiments, human studies revealed that circulating LCN2 concentrations positively correlate with adiposity, triglyceride concentration, blood glucose level and insulin resistance [21,22]. Yet, LCN2 is negatively related to high-density lipoprotein cholesterol [22]. However, there is very little information on the mechanisms involved in the modulation of LCN2 expression. It has been reported that Interleukin-1 beta (IL-1β) induces LCN2 expression through NF-κB and JAK2 mediated signaling pathways [30]. However, these observations are solely based on the use of inhibitors and no binding sites or promoter activity was examined. Other studies indicate that expression of LCN2 is up-regulated by agents that are associated with insulin resistance, including lipopolysaccharide (LPS) [31], glucocorticoid [32], and insulin [33]. Insulin sensitizers, such as thiazolidinedione, down-regulate LCN2 expression [23]. Our studies provide the first mechanistic data on the identification and binding of two transcription factors (STAT1 and NF-κB subunit p65) to the binding sites of the LCN2 promoter in vitro and in vivo. These results also reveal a role of serine/threonine kinases ERKs 1 and 2 on the induction of LCN2 by pro-inflammatory cytokines that can be produced from immune cells in adipose tissue to inhibit insulin signaling and induce insulin resistance in adipocytes.
Our studies demonstrate that IFNγ and TNFα induce LCN2 expression in both murine and human adipocytes. We provide evidence that STAT1 plays a role in the effects of IFNγ, while TNFα induces LCN2 expression via NF-κB signaling pathways. Sequence analysis of the LCN2 promoter identified nine potential STAT binding sites and three potential NF-κB binding sites. Binding of these transcription factors was assessed by both EMSA and ChIP analysis. These studies revealed the binding activity of a NF-κB site and five STAT1 binding sites in the LCN2 promoter. Transfection experiments with a promoter construct confirmed that the region containing these binding sites in LCN2 promoter mediated the increase of gene expression after IFNγ and TNFα treatment. Moreover, inhibition of ERKs 1 and 2 activation attenuated the stimulatory effects of both cytokines. Our data suggest that ERK signaling is required for the maximal transactivation activity of STAT1 and NF-κB, but ERK inhibition did not have significant effect on nuclear localization or DNA binding activity of these transcription factors. We hypothesize that ERK has direct effects on the serine phosphorylation of p65 or STAT1 and future studies will address this question. Previous studies have demonstrated that serine phosphorylation of STAT1 is required for its maximum transactivation activity [34]. Also, several serine phosphorylation sites have been identified in NF-κB subunit p65 [35–39]. Although our preliminary studies suggest these transcription factors are serine phosphorylated by ERKs, we have not examined whether this phosphorylation mediates the ERKs dependent effects on the LCN2 expression. Collectively, our findings suggest that ERKs signaling pathways crosstalk with the STAT1 and NF-κB signaling pathways in adipocytes.
One drawback related to our studies is that the functions of LCN2 still need to be determined. Although several groups have studied the LCN2 null mice, the results of these studies are inconsistent. Previous research have shown important roles of LCN2 in the transportation of hydrophobic molecules, in limiting of bacterial growth [18] and modulating degradation of matrix turnover enzyme MMP-9 [15]. The versatile functions of LCN2 make it difficult to assess the primary reason that accounts for the different phenotypes of the LCN2 null mice. Some data shows induction of PPARγ and adiponectin by LCN2 [23] suggesting that adipokine may be beneficial. Yet, other studies indicate improved insulin action in LCN2 knockout cells [20], indicating that LCN2 is associated with metabolic dysfunction. Although it is clear that LCN2 affects adipocyte properties and participates in the regulation of insulin sensitivity, opposite effects of LCN2 have been reported. Therefore, our studies on the regulation of LCN2 expression have merit and allow us to speculate the inflammatory cytokines we have shown to induce LCN2 may play a role in metabolic dysfunction.
In summary, LCN2 expression and secretion is induced by IFNγ and TNFα. Both of these pro-inflammatory cytokines are likely pathological mediators of increased LCN2 expression that occurs in adipose tissue in conditions of insulin resistance in mouse and man. Our mechanistic studies reveal that STAT1, NF-κB and ERKs signaling pathways participate in the modulation of LCN2 expression in vitro and in vivo. Future studies will be needed to determine if these transcriptional factors are essential for the induction of LCN2.
Conflict of Interest
Neither author has any conflicts of interest.
Acknowledgments
PZ and JS designed and conducted the experiments. PZ wrote the manuscript and JS edited to produce the final version. We would like to thank Anik Boudreau for cell culture support and the rest of the Stephens lab for feedback at lab meetings. Dr. Jackie Stephens is the guarantor of this work and, as such, had full access to all the data in the study and takes responsibility for the integrity of the data and the accuracy of the data analysis.
Footnotes
Work supported by Grant R01DK052968-15 from the NIH to JMS.
References
- 1.Hotamisligil G.S. Molecular mechanisms of insulin resistance and the role of the adipocyte. International Journal of Obesity and Related Metabolic Disorders. 2000;24(Suppl. 4):S23–S27. doi: 10.1038/sj.ijo.0801497. [DOI] [PubMed] [Google Scholar]
- 2.Kershaw E.E., Flier J.S. Adipose tissue as an endocrine organ. Journal of Clinical Endocrinology and Metabolism. 2004;89:2548–2556. doi: 10.1210/jc.2004-0395. [DOI] [PubMed] [Google Scholar]
- 3.Rosen E.D., Spiegelman B.M. Adipocytes as regulators of energy balance and glucose homeostasis. Nature. 2006;444:847–853. doi: 10.1038/nature05483. [DOI] [PMC free article] [PubMed] [Google Scholar]
- 4.Weisberg S.P., McCann D., Desai M., Rosenbaum M., Leibel R.L., Ferrante A.W., Jr Obesity is associated with macrophage accumulation in adipose tissue. Journal of Clinical Investigation. 2003;112:1796–1808. doi: 10.1172/JCI19246. [DOI] [PMC free article] [PubMed] [Google Scholar]
- 5.Xu H., Barnes G.T., Yang Q., Tan G., Yang D., Chou C.J., Sole J., Nichols A., Ross J.S., Tartaglia L.A., Chen H. Chronic inflammation in fat plays a crucial role in the development of obesity-related insulin resistance. Journal of Clinical Investigation. 2003;112:1821–1830. doi: 10.1172/JCI19451. [DOI] [PMC free article] [PubMed] [Google Scholar]
- 6.Hotamisligil G.S., Shargill N.S., Spiegelman B.M. Adipose expression of tumor necrosis factor-alpha: direct role in obesity-linked insulin resistance. Science. 1993;259:87–91. doi: 10.1126/science.7678183. [DOI] [PubMed] [Google Scholar]
- 7.Rocha V.Z., Folco E.J., Sukhova G., Shimizu K., Gotsman I., Vernon A.H., Libby P. Interferon-gamma, a Th1 cytokine, regulates fat inflammation: a role for adaptive immunity in obesity. Circulation Research. 2008;103:467–476. doi: 10.1161/CIRCRESAHA.108.177105. [DOI] [PMC free article] [PubMed] [Google Scholar]
- 8.Hotamisligil G.S., Spiegelman B.M. Tumor necrosis factor alpha: a key component of the obesity-diabetes link. Diabetes. 1994;43:1271–1278. doi: 10.2337/diab.43.11.1271. [DOI] [PubMed] [Google Scholar]
- 9.Hotamisligil G.S., Peraldi P., Budavari A., Ellis R., White M.F., Spiegelman B.M. IRS-1-mediated inhibition of insulin receptor tyrosine kinase activity in TNF-alpha- and obesity-induced insulin resistance. Science. 1996;271:665–668. doi: 10.1126/science.271.5249.665. [DOI] [PubMed] [Google Scholar]
- 10.McGillicuddy F.C., Chiquoine E.H., Hinkle C.C., Kim R.J., Shah R., Roche H.M., Smyth E.M., Reilly M.P. Interferon gamma attenuates insulin signaling, lipid storage, and differentiation in human adipocytes via activation of the JAK/STAT pathway. Journal of Biological Chemistry. 2009;284:31936–31944. doi: 10.1074/jbc.M109.061655. [DOI] [PMC free article] [PubMed] [Google Scholar]
- 11.Hu J., Roy S.K., Shapiro P.S., Rodig S.R., Reddy S.P., Platanias L.C., Schreiber R.D., Kalvakolanu D.V. ERK1 and ERK2 activate CCAAAT/enhancer-binding protein-beta-dependent gene transcription in response to interferon-gamma. Journal of Biological Chemistry. 2001;276:287–297. doi: 10.1074/jbc.M004885200. [DOI] [PubMed] [Google Scholar]
- 12.Peraldi P., Xu M., Spiegelman B.M. Thiazolidinediones block tumor necrosis factor-alpha-induced inhibition of insulin signaling. Journal of Clinical Investigation. 1997;100:1863–1869. doi: 10.1172/JCI119715. [DOI] [PMC free article] [PubMed] [Google Scholar]
- 13.Vietor I., Schwenger P., Li W., Schlessinger J., Vilcek J. Tumor necrosis factor-induced activation and increased tyrosine phosphorylation of mitogen-activated protein (MAP) kinase in human fibroblasts. Journal of Biological Chemistry. 1993;268:18994–18999. [PubMed] [Google Scholar]
- 14.Cowan S.W., Newcomer M.E., Jones T.A. Crystallographic refinement of human serum retinol binding protein at 2A resolution. Proteins. 1990;8:44–61. doi: 10.1002/prot.340080108. [DOI] [PubMed] [Google Scholar]
- 15.Kjeldsen L., Johnsen A.H., Sengelov H., Borregaard N. Isolation and primary structure of NGAL, a novel protein associated with human neutrophil gelatinase. Journal of Biological Chemistry. 1993;268:10425–10432. [PubMed] [Google Scholar]
- 16.Nelson A.L., Barasch J.M., Bunte R.M., Weiser J.N. Bacterial colonization of nasal mucosa induces expression of siderocalin, an iron-sequestering component of innate immunity. Cellular Microbiology. 2005;7:1404–1417. doi: 10.1111/j.1462-5822.2005.00566.x. [DOI] [PubMed] [Google Scholar]
- 17.Flo T.H., Smith K.D., Sato S., Rodriguez D.J., Holmes M.A., Strong R.K., Akira S., Aderem A. Lipocalin 2 mediates an innate immune response to bacterial infection by sequestrating iron. Nature. 2004;432:917–921. doi: 10.1038/nature03104. [DOI] [PubMed] [Google Scholar]
- 18.Goetz D.H., Holmes M.A., Borregaard N., Bluhm M.E., Raymond K.N., Strong R.K. The neutrophil lipocalin NGAL is a bacteriostatic agent that interferes with siderophore-mediated iron acquisition. Molecular Cell. 2002;10:1033–1043. doi: 10.1016/s1097-2765(02)00708-6. [DOI] [PubMed] [Google Scholar]
- 19.Jessen B.A., Stevens G.J. Expression profiling during adipocyte differentiation of 3T3-L1 fibroblasts. Gene. 2002;299:95–100. doi: 10.1016/s0378-1119(02)01017-x. [DOI] [PubMed] [Google Scholar]
- 20.Yan Q.W., Yang Q., Mody N., Graham T.E., Hsu C.H., Xu Z., Houstis N.E., Kahn B.B., Rosen E.D. The adipokine lipocalin 2 is regulated by obesity and promotes insulin resistance. Diabetes. 2007;56:2533–2540. doi: 10.2337/db07-0007. [DOI] [PubMed] [Google Scholar]
- 21.Catalan V., Gomez-Ambrosi J., Rodriguez A., Ramirez B., Silva C., Rotellar F., Gil M.J., Cienfuegos J.A., Salvador J., Fruhbeck G. Increased adipose tissue expression of lipocalin-2 in obesity is related to inflammation and matrix metalloproteinase-2 and metalloproteinase-9 activities in humans. Journal of Molecular Medicine. 2009;87:803–813. doi: 10.1007/s00109-009-0486-8. [DOI] [PubMed] [Google Scholar]
- 22.Wang Y., Lam K.S., Kraegen E.W., Sweeney G., Zhang J., Tso A.W., Chow W.S., Wat N.M., Xu J.Y., Hoo R.L., Xu A. Lipocalin-2 is an inflammatory marker closely associated with obesity, insulin resistance, and hyperglycemia in humans. Clinical Chemistry. 2007;53:34–41. doi: 10.1373/clinchem.2006.075614. [DOI] [PubMed] [Google Scholar]
- 23.Zhang J., Wu Y., Zhang Y., Leroith D., Bernlohr D.A., Chen X. The role of lipocalin 2 in the regulation of inflammation in adipocytes and macrophages. Molecular Endocrinology. 2008;22:1416–1426. doi: 10.1210/me.2007-0420. [DOI] [PMC free article] [PubMed] [Google Scholar]
- 24.Guo H., Jin D., Zhang Y., Wright W., Bazuine M., Brockman D.A., Bernlohr D.A., Chen X. Lipocalin-2 deficiency impairs thermogenesis and potentiates diet-induced insulin resistance in mice. Diabetes. 2010;59:1376–1385. doi: 10.2337/db09-1735. [DOI] [PMC free article] [PubMed] [Google Scholar]
- 25.Law I.K., Xu A., Lam K.S., Berger T., Mak T.W., Vanhoutte P.M., Liu J.T., Sweeney G., Zhou M., Yang B., Wang Y. Lipocalin-2 deficiency attenuates insulin resistance associated with aging and obesity. Diabetes. 2010;59:872–882. doi: 10.2337/db09-1541. [DOI] [PMC free article] [PubMed] [Google Scholar]
- 26.Jun L.S., Siddall C.P., Rosen E.D. A minor role for lipocalin 2 in high-fat diet-induced glucose intolerance. American Journal of Physiology—Endocrinology and Metabolism. 2011;301:E825–E835. doi: 10.1152/ajpendo.00147.2011. [DOI] [PMC free article] [PubMed] [Google Scholar]
- 27.Nohara A., Okada S., Ohshima K., Pessin J.E., Mori M. Cyclin-dependent kinase-5 is a key molecule in tumor necrosis factor-alpha-induced insulin resistance. Journal of Biological Chemistry. 2011;286:33457–33465. doi: 10.1074/jbc.M111.231431. [DOI] [PMC free article] [PubMed] [Google Scholar]
- 28.Waite K.J., Floyd Z.E., Arbour-Reily P., Stephens J.M. Interferon-gamma-induced regulation of peroxisome proliferator-activated receptor gamma and STATs in adipocytes. Journal of Biological Chemistry. 2001;276:7062–7068. doi: 10.1074/jbc.M007894200. [DOI] [PubMed] [Google Scholar]
- 29.Zvonic S., Story D.J., Stephens J.M., Mynatt R.L. Growth hormone, but not insulin, activates STAT5 proteins in adipocytes in vitro and in vivo. Biochemical and Biophysical Research Communications. 2003;302:359–362. doi: 10.1016/s0006-291x(03)00179-7. [DOI] [PubMed] [Google Scholar]
- 30.Sommer G., Weise S., Kralisch S., Lossner U., Bluher M., Stumvoll M., Fasshauer M. Lipocalin-2 is induced by interleukin-1beta in murine adipocytes in vitro. Journal of Cellular Biochemistry. 2009;106:103–108. doi: 10.1002/jcb.21980. [DOI] [PubMed] [Google Scholar]
- 31.Zerega B., Cermelli S., Michelis B., Cancedda R., Cancedda F.D. Expression of NRL/NGAL (neu-related lipocalin/neutrophil gelatinase-associated lipocalin) during mammalian embryonic development and in inflammation. European Journal of Cell Biology. 2000;79:165–172. doi: 10.1078/s0171-9335(04)70019-9. [DOI] [PubMed] [Google Scholar]
- 32.Garay-Rojas E., Harper M., Hraba-Renevey S., Kress M. An apparent autocrine mechanism amplifies the dexamethasone- and retinoic acid-induced expression of mouse lipocalin-encoding gene 24p3. Gene. 1996;170:173–180. doi: 10.1016/0378-1119(95)00896-9. [DOI] [PubMed] [Google Scholar]
- 33.Tan B.K., Adya R., Shan X., Syed F., Lewandowski K.C., O’Hare J.P., Randeva H.S. Ex vivo and in vivo regulation of lipocalin-2, a novel adipokine, by insulin. Diabetes Care. 2009;32:129–131. doi: 10.2337/dc08-1236. [DOI] [PMC free article] [PubMed] [Google Scholar]
- 34.Wen Z., Zhong Z., Darnell J.E., Jr Maximal activation of transcription by Stat1 and Stat3 requires both tyrosine and serine phosphorylation. Cell. 1995;82:241–250. doi: 10.1016/0092-8674(95)90311-9. [DOI] [PubMed] [Google Scholar]
- 35.Hu J., Nakano H., Sakurai H., Colburn N.H. Insufficient p65 phosphorylation at S536 specifically contributes to the lack of NF-kappaB activation and transformation in resistant JB6 cells. Carcinogenesis. 2004;25:1991–2003. doi: 10.1093/carcin/bgh198. [DOI] [PubMed] [Google Scholar]
- 36.Mandrekar P., Jeliazkova V., Catalano D., Szabo G. Acute alcohol exposure exerts anti-inflammatory effects by inhibiting IkappaB kinase activity and p65 phosphorylation in human monocytes. Journal of Immunology. 2007;178:7686–7693. doi: 10.4049/jimmunol.178.12.7686. [DOI] [PubMed] [Google Scholar]
- 37.Vermeulen L., De W.G., Van D.P., Vanden Berghe W., Haegeman G. Transcriptional activation of the NF-kappaB p65 subunit by mitogen- and stress-activated protein kinase-1 (MSK1) EMBO Journal. 2003;22:1313–1324. doi: 10.1093/emboj/cdg139. [DOI] [PMC free article] [PubMed] [Google Scholar]
- 38.Mattioli I., Geng H., Sebald A., Hodel M., Bucher C., Kracht M., Schmitz M.L. Inducible phosphorylation of NF-kappa B p65 at serine 468 by T cell costimulation is mediated by IKK epsilon. Journal of Biological Chemistry. 2006;281:6175–6183. doi: 10.1074/jbc.M508045200. [DOI] [PubMed] [Google Scholar]
- 39.Mattioli I., Sebald A., Bucher C., Charles R.P., Nakano H., Doi T., Kracht M., Schmitz M.L. Transient and selective NF-kappa B p65 serine 536 phosphorylation induced by T cell costimulation is mediated by I kappa B kinase beta and controls the kinetics of p65 nuclear import. Journal of Immunology. 2004;172:6336–6344. doi: 10.4049/jimmunol.172.10.6336. [DOI] [PubMed] [Google Scholar]