

Abstract
We conducted a genome-wide association study for testicular germ cell tumor genotyping 298,782 SNPs in 979 cases and 4,947 controls from the UK and replicating associations in a further 664 cases and 3,456 controls. We identified three novel susceptibility loci, two of which include genes that are involved in telomere regulation. We identified two independent signals within the TERT-CLPTM1L locus on chromosome 5 which has been associated with multiple other cancers (rs4635969, OR=1.54 (95%CI 1.33-1.79), P=1.14×10⁻²³ and rs2736100, OR 1.33 (1.18-1.50) P=7.55 ×10⁻¹⁵). We also identified a locus on chromosome 12 (rs2900333, OR=1.27 (95%CI 1.12-1.44), P=6.16×10⁻¹⁰) that contains ATF7IP, a regulator of TERT expression. Finally we identified a locus on chromosome 9 (rs755383, OR=1.37 (95%CI 1.21-1.55), P=1.12×10⁻²³) containing the sex determination gene DMRT1, which has been linked with teratoma susceptibility in mice.
Testicular germ cell tumor (TGCT) is the most common malignancy in men aged 15-451. There are two major subgroups of TGCT: seminomas (50%) which resemble the primary germ cells from which they are derived and non-seminomas (40%), which display varying degrees of differentiation, from embryonal carcinoma through to teratoma. About 10% of tumors contain mixed histology2. Recognised risk factors for TGCT include previous germ cell tumor, a family history of TGCT, subfertility, testicular microlithiasis and abnormalities of testicular development such as undescended testis2-4.
The familial relative risk of TGCT is high; studies have estimated the risk to brothers and sons of TGCT cases to be increased 8-10 fold and 4-6 fold respectively3 Genome-wide genetic linkage analysis has not provided evidence for the location of a TGCT predisposition gene; many candidate association studies have been undertaken but to date have only unequivocally identified rare deletions on the Y chromosome which confer a modest increase in risk of TGCT5, 6.
Two TGCT genome-wide association scans identified associations with loci on chromosome 12q21 encompassing KITLG (OR=2.55 (95% CI 2.05-3.19), P=10−31), on chromosome 5q31 encompassing SPRY4 (OR=1.37 (95% CI 1.19-1.58), P=3×10⁻¹³) and on chromosome 6p21 encompassing BAK1 (OR=1.50 (95% CI 1.28-1.75), P=10−13)7, 8.
We undertook a genome-wide association analysis of TGCT, genotyping 1,056 cases on the Illumina HumanCNV370-duo Bead array, of which 730 were included in our first study7. The genotype frequencies were compared to those from 5,069 controls genotyped on the Illumina 1.2M array by the Wellcome Trust Case Control Consortium2. Data on 314,861 SNPs common to both arrays were included. Following standard quality control filters and exclusions, we analysed 979 TGCT cases and 4,947 controls at 298,782 SNPs (see Methods). Genotype frequencies in cases and controls were compared using a 1 degree of freedom Cochran-Armitage trend test (Table 1; for QQ plot see Supplementary Fig 1). Comparison of the observed and expected distributions showed evidence of only modest inflation in the test statistic, thereby rendering substantial hidden population stratification or differential genotype calling unlikely (λ=1.078, equivalent to λ1000= 1.045 for a study of 1,000 cases and 1,000 controls).
Table 1. Summary results for four SNPs for which associations were replicated.
| Locus1 | Chromosome and Position2 |
Stage | Cases (n) |
Controls (n) |
RAF3 controls |
Per allele OR4 (95% CI) |
Het OR5 (95% CI) |
Hom OR6 (95% CI) |
P-trend7 | |
|---|---|---|---|---|---|---|---|---|---|---|
| Per stage | Combined | |||||||||
|
rs2736100 G/T TERT |
5p15 1,339,516 |
GWAS | 978 | 4942 | 0.49 | 1.36 (1.23-1.49) |
1.52 (1.27-1.83) |
1.89 (1.55-2.31) |
2.80×10⁻¹⁰ | |
| Replication | 632 | 2823 | 0.49 | 1.33 (1.18-1.50) |
1.21 (0.97-1.52) |
1.75 (1.36-2.23) |
4.90×10−06 | 7.55 ×10⁻¹⁵ | ||
|
rs4635969 C/T TERT, CLPTM1L |
5p15 1,361,552 |
GWAS | 965 | 4945 | 0.2 | 1.65 (1.47-1.86) |
1.57 (1.35-1.81) |
2.64 (1.99-3.49) |
9.60×10⁻¹⁷ | |
| Replication | 645 | 3263 | 0.19 | 1.54 (1.33-1.79) |
1.63 (1.36-1.94) |
1.84 (1.24-2.73) |
1.40×10−08 | 1.14×10⁻²³ | ||
|
rs755383 C/T DMRT1 |
9p24 853,635 |
GWAS | 979 | 4945 | 0.63 | 1.57 (1.42-1.74) |
1.97 (1.49-2.61) |
2.97 (2.25-3.93) |
8.10×10⁻¹⁹ | |
| Replication | 641 | 3307 | 0.62 | 1.37 (1.21-1.55) |
1.46 (1.08-1.97) |
1.97 (1.46-2.66) |
5.70×10−07 | 1.12×10⁻²³ | ||
|
rs2900333 T/C ATF7IP |
12p13 14,545,134 |
GWAS | 977 | 4943 | 0.62 | 1.29 (1.17-1.43) |
1.22 (0.97-1.55) |
1.64 (1.30-2.07) |
7.60×10−07 | |
| Replication | 637 | 3168 | 0.62 | 1.27 (1.12-1.44) |
1.69 (1.24-2.30) |
1.89 (1.39-2.58) |
2.00×10−04 | 6.16×10⁻¹⁰ | ||
dbSNP rs number, non-risk/risk associated alleles, genes in LD block
Chromosome and build 36 position
RAF = Risk allele frequency
OR = odds ratio
OR in heterozygotes, relative to common homozygotes
OR in homozygotes, relative to common homozygotes
Cochran-Armitage test for trend
We identified 33 SNPs at six loci showing association at significance of P<10−6 (Supplementary Table 1). Twenty SNPs lay within the previously identified three loci at 5q31, 6p21 and 12q21, odds ratios for which were consistent with those previously published7. 13 further SNPs at three novel loci on chromosomes 5p15 (five SNPs), 9p24 (six SNPs), and 12p13 (two SNPs) showed association of P<10−6.
Following multiple logistic regression to test for independence of effects, four SNPs were selected for follow up: rs2736100 and rs4635969 at 5p15, rs755383 at 9p24 and rs2900333 at 12p13. These were genotyped in an additional 664 TGCT cases and 3,456 controls using Taqman (see Methods). Each of the four SNPs showed evidence of replication.
We identified two SNPs on 5p15, rs2736100 and rs4635969, associated with TGCT susceptibility. The effects of rs2736100 and rs4635969 are maintained when corrected for each other by logistic regression (OR=1.26 (1.17-1.36), P=8.71×10⁻⁹ and OR=1.46 (1.34-1.60), P=2.22×10⁻¹⁶ respectively). Furthermore correlation between rs2736100 and rs4635969 is poor (D′=0.019, r2=0 in HapMAp CEU samples, D′=0.41, r2=0.04 in our GWAS control data) and comparison of haplotype frequencies provided evidence of two haplotypes differing in frequency between cases and controls (Supplementary Table 2). Taken together, these data strongly suggest that rs2736100 and rs4635969 are independently associated with TGCT.
rs2736100 and rs4635969 lie within a 103kB region on 5p15 (1,306Kb-1,409Kb) that comprises a 41kB region of recombination overlying TERT (human telomerase reverse transcriptase) followed by a 62kB LD block overlying the 3′ end of TERT and CLPTM1L (cisplatin resistance related protein CRR9p). rs2736100 lies in intron 2 of TERT in the upstream recombination region whilst rs4635969 lies 5′ of CLPTM1L in the block of LD (see Fig 1).
Figure 1. Regional plots of the three new TGCT loci.
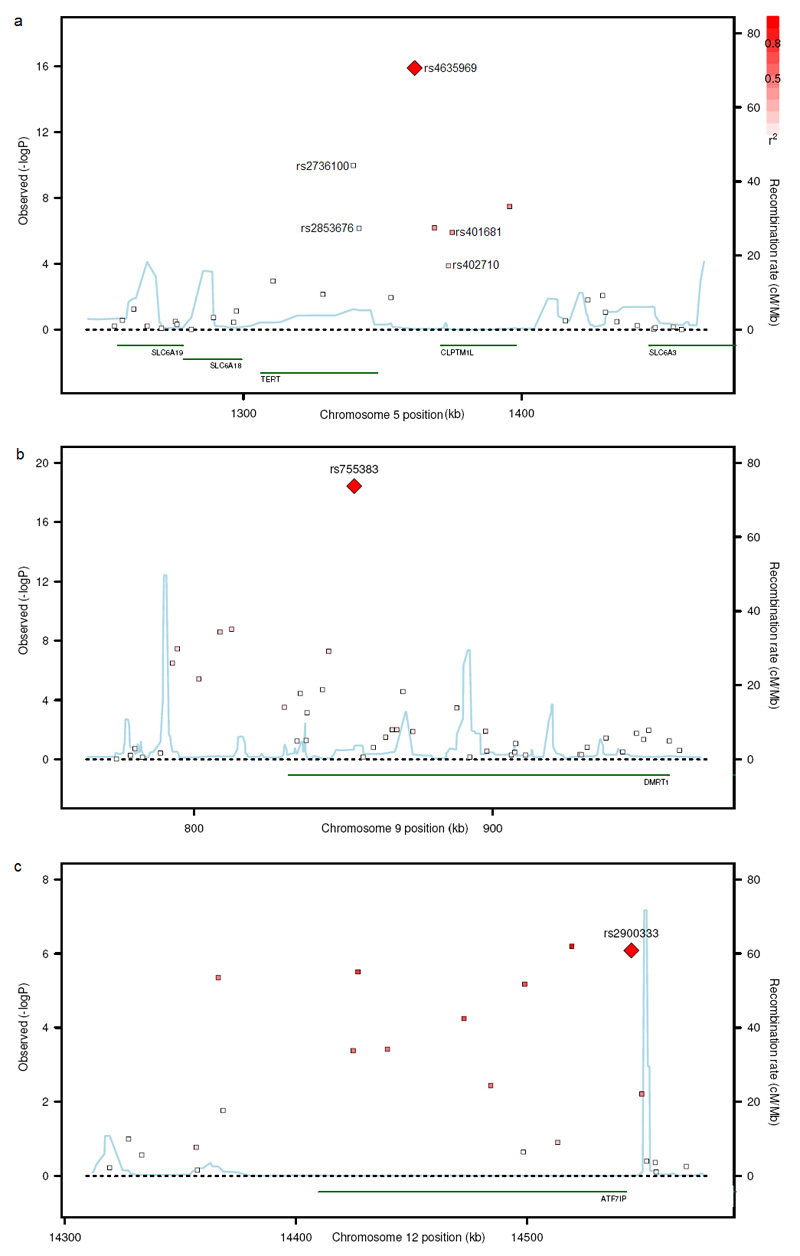
The genomic regions of association with TGCT on chromosome 5p15 (a), 9p24 (b) and 12p13 (c). Shown are the −log10 association P values of SNPs in 979 UK TGCT cases and 4947 UK controls. The intensity of red shading indicating the strength of LD with the index SNP. Also shown are the SNP build 36 coordinates in kilobases (kb), recombination rates in centimorgans (cM) per megabase (Mb) (in blue) and the genes in the region (in green).
The TERT-CLPTM1L locus on 5p15 is the third region to be associated with multiple cancers, the other two being on chromosomes 8q24 and 9p219-15. Associations of SNPs in the 5p15 upstream region of recombination have been reported in lung cancer (rs273610010, rs273609812), specifically adenocarcinoma of the lung (rs2736100)11, glioma (rs2736100, rs2853676)14, basal cell carcinoma and carcinomas of the urinary bladder and prostate (rs2736098)12. Associations of SNPs in the downstream LD block have been reported in basal cell carcinoma, cutaneous melanoma and carcinomas of the urinary bladder, cervix, prostate (rs401681)12, 13, lung (rs4016819, 12, rs40271010, rs463596911), and pancreas (rs401681, rs4635969)15.
Associations with TGCT of rs401681 (P=1.17×10⁻⁶) and rs402710 (P=1.38 ×10⁻⁴) were evident in our GWAS data. However, these SNPs are both correlated with rs4635969 and the associations at rs401681 and rs402710 disappeared with correction for rs4635969, suggesting a single signal driving the association in our data which is best represented by rs4635969 (Supplementary Table 3, 4 and 5). We also identified a strong association for rs2853676 (P=8.70×10⁻⁷); this association remained significant when corrected for either rs2736100 or rs4635969 but disappeared with simultaneous correction for both rs2736100 and rs4635969. Since neither rs2736100 nor rs4635969 alone can fully account for the association observed between TGCT and sequence variants in this region, it is plausible that a unique causal variant in LD with, and capturing the effects of both rs2736100[T] and rs4635969[T] may exist. However, no association more significant than that of rs4635969 was identified through imputation in our data of 3.96 million SNPs, so it is equally plausible that two separate signals exist (see Methods and Supplementary Table 6). In order to investigate these alternatives, further analyses of the 5p15 locus will be required in the various cancers in which it has been implicated.
There are two genes within the 5p15 locus through which the association might plausibly be mediated: CLPTM1L and TERT. CLPTM1L (cisplatin resistance related protein CRR9p) is expressed in a range of normal and malignant tissues and has been shown to sensitize ovarian cancer cells to cisplatin-induced apoptosis16. Malignant testicular germ cells are exquisitely sensitive to cisplatin, which has revolutionised the treatment of TGCT and represents one of the great successes of cancer chemotherapy17. Nevertheless, it would seem most likely that the 5p15 signals are mediated through the TERT gene, which encodes the catalytic subunit of the telomerase ribonucleoprotein complex. At each division of actively dividing cells there is loss of terminal sequences. Telomerase counterbalances this by extending the TTAGGG telomeric nucleotide repeats. Telomere shortening is associated with increased genome instability and neoplasia 18, 19. Furthermore TERT is reactivated in cancer cells, serving to extend the replicative lifespan of tumor cells beyond that of their normal counterparts20. Consistent with this, amplification of the 5p15 region has been reported in several cancer types21, 22.
Whilst TERT is expressed throughout the developing embryo, it is typically absent in normal benign adult somatic cells. Emergence of a link between TERT and TGCT is therefore particularly interesting, as testicular germ cells are unique in being the only normal adult tissue in which telomerase is highly expressed23. Moreover, it has been observed that undifferentiated TGCTs (seminomas) exhibit the pattern of high TERT expression, high telomerase activity and long telomeres seen in normal testicular germ cells, whilst well differentiated TGCTs such as teratomas show minimal TERT expression and no telomerase activity 23, 24. There is some reflection of this dichotomy in our data as the association of rs2736100 is stronger with seminomas (OR 1.48 (1.32-1.66) than non-seminomas (1.26(1.12-1.42), (P=0.04)) (see Methods and Supplementary Tables 7 and 8).
Telomerase regulation is also implicated in underlying the association of the locus on chromosome 12p13. Here rs2900333 lies in a 181kB LD block containing a single gene, ATF7IP (Homo sapiens activating transcription factor 7 interacting protein) which is also known as MCAF1 (MBD1-containing chromatin-associated factor 1). ATF7IP is a transcription factor that enables expression of TERT and its associated RNA component, encoded by TERC. Knockdown of ATF7IP in HeLa cells causes marked reduction in TERT and TERC expression and telomerase activity25. Furthermore, ATF7IP is frequently overexpressed in cancers25.
The third locus is located at 9p24 in an LD block of 76kB in which there is only one annotated protein-coding gene, DMRT1 (doublesex and mab-3 related transcription factor 1). There is considerable evidence linking this gene to testicular determination, differentiation and tumorigenesis, rendering it a highly plausible candidate through which the association may be mediated. The strongest evidence comes from mouse studies which demonstrated that DMRT1 deficiency is associated with testicular cancer: 90% of Dmrt1 −/− 129Sv mice developed teratomas compared to <1% of Dmrt1+/+ mice26. DMRT1 is a transcription factor with a highly conserved DNA-binding motif. Phylogenetic studies suggest that, despite gross differences in sex-determining mechanisms, DMRT1 represents an ancient conserved component common to many vertebrate sex-determining pathways27. The distinct cell-type-dependent, stage-dependent and sexually dimorphic expression profile of DMRT1 during embryogenesis is consistent with high DMRT1 expression being required for testicular differentiation whilst lower expression results in ovarian differentiation 27. DMRT1 has further been implicated in human sex differentiation as abnormal male gonadal development is associated with deletions of the 9p24.3 region that contains DMRT128, Furthermore, germ cell tumors arise in a significant proportion of these deletion cases29.
To date, eight TGCT predisposition SNPs at six loci have been identified. In this GWAS we have identified rs2736100 and rs4635969 at the TERT-CLPTM1L locus on 5p15, rs2900333 at the ATF7IP locus on 12p13 and rs755383 at the DMRT1 locus on 9p24, whilst in our previous GWAS we identified rs995030 and rs1508595 at the KITLG locus on 12q21, rs4624820 at the SPRY4 locus on 5q31 and rs210138 at the BAK1 locus on 6p217. The four new susceptibility alleles together account for 4% of the risk to brothers and 6% of the risk to sons of cases of TGCT, bringing the cumulative total of the eight susceptibility alleles identified to date to 11% and 16% respectively. No SNP showed evidence of departure from a log-additive (multiplicative) model, i.e. the OR to rare homozygotes did not differ significantly from the square of the OR to heterozygotes (see Table 1). Nor was there evidence of statistical interaction between any pair of these eight SNPs; for every combination of SNPs the combined risk was consistent with the product of the individual risks. Under this multiplicative model, those in the top 10% of genetic risk have a relative risk ~3-fold greater than the population risk whilst those classified as the bottom 10% of genetic risk are estimated to have a relative risk about one sixth the population risk.
Genome-wide association studies of TGCT have thus far led to the emergence of three key, distinct pathways, each of which is biologically plausible in its involvement in TGCT predisposition. KITLG, SPRY4 and BAK1 are all involved in the KIT pathway. KITLG (KIT ligand or Stem Cell Factor), is the ligand that activates the receptor tyrosine kinase KIT: somatic KIT mutations and amplifications are well recognised in germ cell tumors. SPRY4 acts in the mitogen activated protein kinase pathway, which is activated by the KITLG/KIT system, whilst BAK1 encodes a pro-apoptotic protein, expression of which is repressed by the KITLG/KIT system in testicular germ cells. TERT and ATF7IP relate to a second pathway of telomerase regulation: TERT encodes telomerase whilst ATF7IP regulates expression of TERT and its partner TERC. DMRT1 relates to a third pathway of sex-determination. Whilst the known functions of these genes render them highly plausible candidates through which the associations may be mediated, finer association mapping, expression analyses in testicular germ cells and functional analyses will be required to uncover the true causative variants and mechanisms of cancer predisposition.
The power to detect these new loci on chromosome 5p15 (rs2736100, rs46359699), 9p24 and 12p13 was 49%, 95%, 69% and 17% respectively. Thus, whilst it is unlikely that many common alleles of larger effects have been missed, multiple further loci of similar and weaker effects may exist which could explain more of the residual familial risk of testicular germ cell cancer.
Methods
Subjects
Detailed information on case-control sample sets are found in the Supplementary Note.
Genotyping
Genotyping of cases in the GWAS was performed on the Illumina HumanCNV370-duo Bead array. We utilised data on controls from the 1958BC and NBS which had been genotyped on the Illumina Infinium 1.2M array at the Wellcome Trust Sanger Institute. Genotypes for both arrays were called using the Illumnus algorithm (https://www.sanger.ac.uk/Software/analysis/illuminus/). We included genotypes for which Illumnus generated a posterior probability for the genotype call of >0.95. For this analysis we utilised data on 314,861 SNPs that were successfully genotyped on both arrays. Cluster plots were inspected manually for all SNPs considered for replication. Validation and replication of associations was undertaken using 5′exonuclease assay (Taqman™, Applied Biosystems) following manufacturer’s protocols and by combining cases with controls on 384-well plates, each of which included at least two negative controls and 1-2% duplicates (concordance 98.5%). We performed cross-platform validation, genotyping by Taqman 283 samples that had been run on the Illumina array (concordance 97.8 %).
Statistical Analysis
We applied the same basic filters as in our previous analysis7: we restricted analyses to individuals that were called on >95% of successfully genotyped SNPs, thus eliminating 16 cases and 41 controls. We computed identity-by-state (IBS) probabilities for all pairs in order to identify cryptic duplicates and close relatives (IBS>0.84). For each pair, the sample with the highest genotype call rate was retained: we thus eliminated 30 cases and 44 controls. Using a subset of 60,572 uncorrelated SNPs (r2<0.1), we estimated the average IBS between all participants together with the phase II HapMap samples (60 western European (CEU), 60 Nigerian (YRI), 90 Japanese(JPT) and 90 Han Chinese(CHB)). Using multi-dimensional scaling, we identified individuals with significant Asian or African ancestry: 9 cases and 23 controls with >10% non-Western-European ancestry were removed. Furthermore, in this analysis we applied the additional filter of excluding samples exhibiting abnormally high or low autosomal heterozygosity (+/− 4.5 SD from the mean; following examination of distribution plots): 22 cases and 14 controls were eliminated accordingly. Following these exclusions, 979 cases and 4,947 controls were available for the genome-wide analysis.
We filtered out all SNPs with a) a MAF<1%, b) a call rate of <95% in cases or controls or c) a minor frequency of 1-5% with a call rate of <99%. We also excluded SNPs whose genotyped frequency departed from Hardy-Weinberg equilibrium at P<10−12 in cases or P<.00001 in controls. We analysed data on chromosomes for which >90% of SNPs passed these filters, thus including 298,782 SNPS from 22 autosomal chromosomes. The sex chromosomes did not pass this filter and were excluded from the analysis.
For the replication, call rates were at least 97% per plate for each SNP; cluster plots were visually examined for each 384-well plate. Genotype distributions for each SNP were consistent with Hardy-Weinberg equilibrium (P>0.01).
Statistical methods
For the GWAS, we assessed associations between each SNP and disease using both the 1df allelic association test and the 1df Cochran-Armitage trend test. Inflation in the chi-squared statistic was assessed using the genomic control approach: we derived an inflation factor (λ) by dividing the median of the lowest 90% of the 1df statistics by the 45% percentile of a 1df chi-squared distribution (0.357). This cut-off was used to avoid inclusion of SNPs likely to be associated with risk. Since λ was small, we chose to present p-values uncorrected for λ as this made little difference to the significance levels and preserved consistency with the replication analysis.
1df tests of association were performed for the genome-wide and the replication analyses separately and for the combined data. For the principle association analysis, we have emphasized the OR estimates from the replication stage alone to minimize the effect of ‘winner’s curse’ (whereby in the sample series in which a significant association is first identified, the effect size tends to be biased away from the null). We assessed each SNP for dose-response by comparing 1df and 2df logistic regression models, adjusting for stage, using a likelihood ratio test (P<0.01) and examined the combined effects of multiple SNPs by evaluating the effect on the model of adding an interaction term, using a likelihood ratio test (P<0.01) and adjusting for stage.
Genetic risks were calculated by computing a weighted sum of risk alleles weighted by the estimated effect of the SNP, grouped into ranges (according to the deciles of risk in the controls) and compared to the general population risk (which was determined using a frequency-weighted average risk for all observed genotypes in controls) via unconditional logistic regression.
Modification of the odds ratios by covariate phenotype/risk factors was assessed using a case-only analysis of both GWAS and replication data, assessing the effect of age on SNP genotype in the cases using polytomous regression (Supplementary Tables 7,8 and 9). In the evaluation of family history as a risk factor, we compared 255 family history positive cases to 1376 isolated cases (having compared 220 family history positive cases to 1081 isolated cases in our previous analysis7). Imputation was performed via combination with 3.96 million SNPs genotyped in 90 HapMap CEU individuals (release 23); analyses were performed using two different imputation algorithms: PLINK (http://pngu.mgh.harvard.edu/~purcell/plink/) and MACH (http://www.sph.umich.edu/csg/yli/mach/tour/imputation.html). The CaTS - Power Calculator software was used to estimate the power to detect each of the associations found, assuming significance thresholds of P < 10−6 after the genome-wide analysis and P < 10−7 after replication (http://www.sph.umich.edu/csg/abecasis/CaTS/). LD matrices between SNPs reported in HapMap were based on Data Release 27/phaseII+III Feb09 on NCBI B36 assembly, dbSNP b126, viewed using Haploview software (v4.2) (http://www.brsoadinstitute.org/haploview/haploview) and plotted using SNAP (http://www.broadinstitute.org/mpg/snap/). LD blocks were evaluated using the HapMap recombination rate (cM/Mb) and defined using the Oxford recombination hotspots30.
All genomic references are based on NCBI Build 36. Analyses were performed using R (v2.6), Stata10 (State College, Texas, US) and PLINK (v1.06) software (http://pngu.mgh.harvard.edu/~purcell/plink/).
Supplementary Material
Acknowledgements
We would like to thank TGCT patients and the clinicians involved in their care for participation in this study. We would like to thank Mrs Darshna Dudakia, Mrs Julia Pugh, Ms Heather McDonald and Ms Julia Marke for patient recruitment and database entry for the TGCT collections. We acknowledge NHS funding to the NIHR Biomedical Research Centre. We acknowledge use of DNA from the British 1958 Birth Cohort DNA collection, funded by the Medical Research Council grant G0000934 and the Wellcome Trust grant 068545/Z/02. CT is an MRC Clinical Research Fellow. DFE is a Principal Research Fellow of Cancer Research UK and the study was supported by the Institute of Cancer Research, Cancer Research UK and the Wellcome Trust.
Reference List
- 1.Ferlay J, Bray F, Pisani P, Parkin DM. Cancer Incidence, Mortality and Prevalence Worldwide. IARCPress; Lyon: 2004. GLOBOCAN 2002. [IARC CancerBase No. 5. version 2.0] IARC CancerBase No. 5. Ref Type: Generic. [Google Scholar]
- 2.Horwich A, Shipley J, Huddart R. Testicular germ-cell cancer. Lancet. 2006;367:754–765. doi: 10.1016/S0140-6736(06)68305-0. [DOI] [PubMed] [Google Scholar]
- 3.Hemminki K, Li X. Familial risk in testicular cancer as a clue to a heritable and environmental aetiology. Br. J. Cancer. 2004;90:1765–1770. doi: 10.1038/sj.bjc.6601714. [DOI] [PMC free article] [PubMed] [Google Scholar]
- 4.Rashid HH, Cos LR, Weinberg E, Messing EM. Testicular microlithiasis: a review and its association with testicular cancer. Urol. Oncol. 2004;22:285–289. doi: 10.1016/S1078-1439(03)00177-7. [DOI] [PubMed] [Google Scholar]
- 5.Nathanson KL, et al. The Y deletion gr/gr and susceptibility to testicular germ cell tumor. Am. J. Hum. Genet. 2005;77:1034–1043. doi: 10.1086/498455. [DOI] [PMC free article] [PubMed] [Google Scholar]
- 6.Horvath A, et al. Functional phosphodiesterase 11A mutations may modify the risk of familial and bilateral testicular germ cell tumors. Cancer Res. 2009;69:5301–5306. doi: 10.1158/0008-5472.CAN-09-0884. [DOI] [PMC free article] [PubMed] [Google Scholar]
- 7.Rapley EA, et al. A genome-wide association study of testicular germ cell tumor. Nat. Genet. 2009;41:807–810. doi: 10.1038/ng.394. [DOI] [PMC free article] [PubMed] [Google Scholar]
- 8.Kanetsky PA, et al. Common variation in KITLG and at 5q31.3 predisposes to testicular germ cell cancer. Nat. Genet. 2009;41:811–815. doi: 10.1038/ng.393. [DOI] [PMC free article] [PubMed] [Google Scholar]
- 9.Wang Y, et al. Common 5p15.33 and 6p21.33 variants influence lung cancer risk. Nat. Genet. 2008;40:1407–1409. doi: 10.1038/ng.273. [DOI] [PMC free article] [PubMed] [Google Scholar]
- 10.McKay JD, et al. Lung cancer susceptibility locus at 5p15.33. Nat. Genet. 2008;40:1404–1406. doi: 10.1038/ng.254. [DOI] [PMC free article] [PubMed] [Google Scholar]
- 11.Landi MT, et al. A genome-wide association study of lung cancer identifies a region of chromosome 5p15 associated with risk for adenocarcinoma. Am. J. Hum. Genet. 2009;85:679–691. doi: 10.1016/j.ajhg.2009.09.012. [DOI] [PMC free article] [PubMed] [Google Scholar]
- 12.Rafnar T, et al. Sequence variants at the TERT-CLPTM1L locus associate with many cancer types. Nat. Genet. 2009;41:221–227. doi: 10.1038/ng.296. [DOI] [PMC free article] [PubMed] [Google Scholar]
- 13.Stacey SN, et al. New common variants affecting susceptibility to basal cell carcinoma. Nat. Genet. 2009;41:909–914. doi: 10.1038/ng.412. [DOI] [PMC free article] [PubMed] [Google Scholar]
- 14.Shete S, et al. Genome-wide association study identifies five susceptibility loci for glioma. Nat. Genet. 2009;41:899–904. doi: 10.1038/ng.407. [DOI] [PMC free article] [PubMed] [Google Scholar]
- 15.Petersen GM, et al. A genome-wide association study identifies pancreatic cancer susceptibility loci on chromosomes 13q22.1, 1q32.1 and 5p15.33. Nat. Genet. 2010 doi: 10.1038/ng.522. [DOI] [PMC free article] [PubMed] [Google Scholar]
- 16.Yamamoto K, Okamoto A, Isonishi S, Ochiai K, Ohtake Y. A novel gene, CRR9, which was up-regulated in CDDP-resistant ovarian tumor cell line, was associated with apoptosis. Biochem. Biophys. Res. Commun. 2001;280:1148–1154. doi: 10.1006/bbrc.2001.4250. [DOI] [PubMed] [Google Scholar]
- 17.Masters JR, Koberle B. Curing metastatic cancer: lessons from testicular germ-cell tumours. Nat. Rev. Cancer. 2003;3:517–525. doi: 10.1038/nrc1120. [DOI] [PubMed] [Google Scholar]
- 18.Feldser DM, Hackett JA, Greider CW. Telomere dysfunction and the initiation of genome instability. Nat. Rev. Cancer. 2003;3:623–627. doi: 10.1038/nrc1142. [DOI] [PubMed] [Google Scholar]
- 19.Hackett JA, Feldser DM, Greider CW. Telomere dysfunction increases mutation rate and genomic instability. Cell. 2001;106:275–286. doi: 10.1016/s0092-8674(01)00457-3. [DOI] [PubMed] [Google Scholar]
- 20.Fernandez-Garcia I, Ortiz-de-Solorzano C, Montuenga LM. Telomeres and telomerase in lung cancer. J. Thorac. Oncol. 2008;3:1085–1088. doi: 10.1097/JTO.0b013e3181886713. [DOI] [PubMed] [Google Scholar]
- 21.Kang JU, Koo SH, Kwon KC, Park JW, Kim JM. Gain at chromosomal region 5p15.33, containing TERT, is the most frequent genetic event in early stages of non-small cell lung cancer. Cancer Genet. Cytogenet. 2008;182:1–11. doi: 10.1016/j.cancergencyto.2007.12.004. [DOI] [PubMed] [Google Scholar]
- 22.Zhang A, et al. Genetic alterations in cervical carcinomas: frequent low-level amplifications of oncogenes are associated with human papillomavirus infection. Int. J. Cancer. 2002;101:427–433. doi: 10.1002/ijc.10627. [DOI] [PubMed] [Google Scholar]
- 23.Schrader M, et al. Quantification of human telomerase reverse transcriptase mRNA in testicular germ cell tumors by quantitative fluorescence real-time RT-PCR. Oncol. Rep. 2002;9:1097–1105. [PubMed] [Google Scholar]
- 24.Schrader M, et al. The differentiation status of primary gonadal germ cell tumors correlates inversely with telomerase activity and the expression level of the gene encoding the catalytic subunit of telomerase. BMC Cancer. 2002;2:32. doi: 10.1186/1471-2407-2-32. [DOI] [PMC free article] [PubMed] [Google Scholar]
- 25.Liu L, et al. MCAF1/AM is involved in Sp1-mediated maintenance of cancer-associated telomerase activity. J. Biol. Chem. 2009;284:5165–5174. doi: 10.1074/jbc.M807098200. [DOI] [PubMed] [Google Scholar]
- 26.Krentz AD, et al. The DM domain protein DMRT1 is a dose-sensitive regulator of fetal germ cell proliferation and pluripotency. Proc. Natl. Acad Sci. U. S. A. 2009 doi: 10.1073/pnas.0905431106. [DOI] [PMC free article] [PubMed] [Google Scholar]
- 27.Smith CA, McClive PJ, Western PS, Reed KJ, Sinclair AH. Conservation of a sex-determining gene. Nature. 1999;402:601–602. doi: 10.1038/45130. [DOI] [PubMed] [Google Scholar]
- 28.Barbaro M, et al. Characterization of deletions at 9p affecting the candidate regions for sex reversal and deletion 9p syndrome by MLPA. Eur. J. Hum. Genet. 2009;17:1439–1447. doi: 10.1038/ejhg.2009.70. [DOI] [PMC free article] [PubMed] [Google Scholar]
- 29.Livadas S, et al. Gonadoblastoma in a patient with del(9)(p22) and sex reversal: report of a case and review of the literature. Cancer Genet. Cytogenet. 2003;143:174–177. doi: 10.1016/s0165-4608(02)00849-x. [DOI] [PubMed] [Google Scholar]
- 30.Myers S, Bottolo L, Freeman C, McVean G, Donnelly P. A fine-scale map of recombination rates and hotspots across the human genome. Science. 2005;310:321–324. doi: 10.1126/science.1117196. [DOI] [PubMed] [Google Scholar]
Associated Data
This section collects any data citations, data availability statements, or supplementary materials included in this article.