Abstract
We report a dual-band normalization technique for in vivo quantification of the metabolic biomarker, protoporphyrin IX (PpIX), during brain tumor resection procedures. The accuracy of the approach was optimized in tissue simulating phantoms with varying absorption and scattering properties, validated with fluorimetric assessments on ex vivo brain tissue, and tested on human data acquired in vivo during fluorescence-guided surgery of brain tumors. The results demonstrate that the dual-band normalization technique allows PpIX concentrations to be accurately quantified by correction with reflectance data recorded and integrated within only two narrow wavelength intervals. The simplicity of the method lends itself to the enticing prospect that the method could be applicable to wide-field applications in quantitative fluorescence imaging and dosimetry in photodynamic therapy.
We have recently quantified absolute concentrations of the metabolic biomarker, protoporphyrin IX (PpIX), in intracranial tumors following systemic administration of the prodrug 5-aminolevulinic acid (ALA) using fluorescence and diffuse reflectance spectroscopy in vivo based on a fiber-optic point detection scheme. This technique appears to significantly improve the diagnostic accuracy of PpIX for detecting tumors during neurosurgical resection of various pathologies, including high- and low-grade gliomas [1], relative to qualitative assessments of visual fluorescence used in [2]. Studies have shown that the shape and magnitude of detected fluorescence spectra measured in vivo, for example, at the surface of tissue, are markedly altered by the optical absorption and scattering characteristics of the interrogated tissue [3]. As a result, the raw fluorescence signal produced by any molecular marker cannot be used alone to quantify concentrations accurately in vivo. Spectroscopic measurements have been corrected using empirical ratiometric approaches [4] or with more rigorous model-based methods where the tissue’s optical properties are explicitly determined (see, e.g., [5]).
Here, we report an investigation of an approach based on spectral constraints enforced semi-empirically (rather than being modeled), which simplifies the instrumentation since the reflectance signal only needs to be integrated over two different wavelength intervals without any model fitting. More importantly, however, the approach may also be particularly applicable to wide-field quantitative fluorescence imaging (as opposed to point measurements) because explicit light-transport modeling over the full field-of-view may not be necessary. In [1,5], we described the development and validation of a probe in which the full fluorescence spectrum is measured from the tissue surface along with the full diffuse reflectance spectrum. A spectrally constrained diffusion approximation was applied to determine the absorption and transport scattering spectra (μa and , respectively) from the reflectance data, and these values were used to correct the measured fluorescence spectrum to produce the true fluorescence signal. The local concentration of PpIX (CPpIX) was found by spectrally unmixing the contributions of different fluorophores to the corrected fluorescence spectrum (PpIX, PpIX photoproducts, and tissue autofluorescence). Preclinical optimization in tissue-simulating phantoms, validation in an in vivo glioma model, and testing in initial clinical studies in patients undergoing brain tumor resection have shown the feasibility and potential value of the quantitative information.
The details of the contact probe system have been described elsewhere [1,5]. Briefly, measurements are acquired with four adjacent optical fibers in contact with the tissue at the distal end of a 1.1 mm diameter intraoperative probe. Each fiber has a core diameter of 200 μm and the center-to-center separation between adjacent fibers is d = 260 μm. Two fibers are coupled to a broadband LED, delivering light from λ = 450 to 720 nm. Another fiber is coupled to a violet LED with center wavelength at λ = 405 nm. The fourth fiber connects to a miniature spectrometer (USB2000+, Ocean Optics Inc., Florida) with light detection between λ = 200 nm and 1100 nm at < ~ 1 nm spectral resolution. The PpIX absorption spectrum exhibits a strong absorption band (Q-band) around λ = 405 nm, so that fluorescence excitation is efficiently achieved using the violet light source fiber. The effective tissue sampling depth is < ~ 1 mm. White light reflectance (illumination fiber at d = 260 μm only) and fluorescence emission spectra (excitation fiber at d = 260 μm only) are sequentially measured using broadband and light excitation at λ = 405 nm, respectively.
In this study, values of fluorescence, Φ, were computed using the normalization
| (1) |
where ΦFluo is the raw measured fluorescence spectrum, and and are the spectrally integrated reflectance signals over the ranges λ = 465 to 485 nm and λ = 625 to 645 nm, respectively. The wavelength range for was chosen to be as close as possible to the fluorescence excitation band in order to correct for tissue attenuation of the excitation light. The second band samples the main PpIX fluorescence emission peak around λ = 635 nm. The assumptions underlying Eq. (1) are that most of the changes in fluorescence magnitude is due to tissue absorption at the excitation wavelength and that the impact of light diffusion in the emission band, where scattering dominates over absorption, can be corrected by further dividing or multiplying the raw fluorescence by an empirical power function of .
PpIX measurements during three sets of experiments were acquired to evaluate the accuracy of using Eq. (1) to estimate absolute concentrations: (1) in tissue-simulating phantoms with a range of optical properties consistent with human brain tissue, (2) in ex vivo animal brain tissue, and (3) in human tissue in vivo during resection procedures in brain tumor patients. For each measurement, a background spectrum was acquired and subtracted from the raw white light reflectance and fluorescence in order to account for the dark noise of the instrument. The resulting spectrum was corrected using Eq. (1) for values of the semi-empirical parameter, α, ranging from −2 to 2. The corrected spectra were unmixed to separate the contribution of the main fluorophore, namely PpIX, from its photoproducts and tissue autofluorescence. The resulting PpIX spectra were scaled by a calibration factor determined from the slope of the linear regression to known dye concentrations, in order to extract an estimate of the absolute PpIX concentration, CPpIX [1].
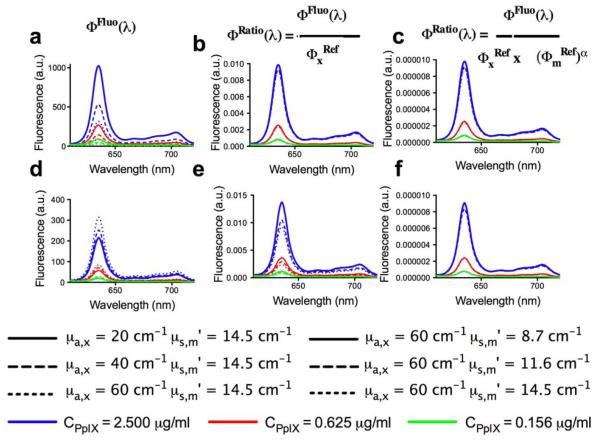
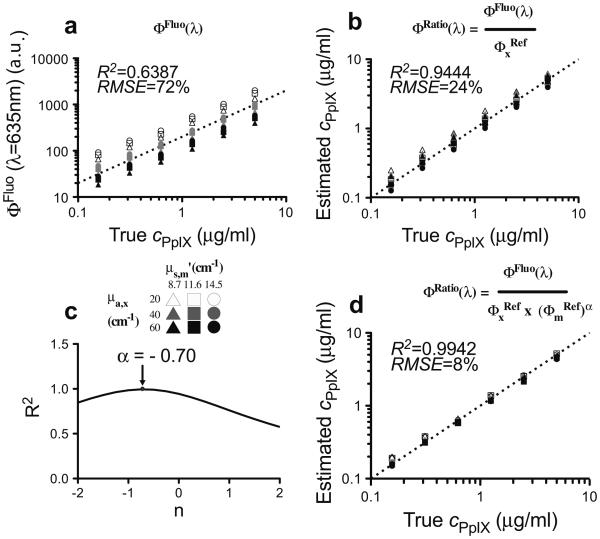
The phantoms were comprised of Intralipid (Fresenius Kabi, Uppsala, Sweden), which provided the tissue-like background scattering, yellow food coloring (McCormick, London, Ontario) as the absorber, and PpIX. Nine phantoms of differing optical properties were prepared with six concentrations of PpIX (0.156, 0.313, 0.625, 1.250, 2.500, and 5.000 μg/ml), yielding 54 combinations of absorption coefficient (μa), reduced scattering coefficient (), and fluorophore concentration. The absorption and reduced scattering at the excitation wavelength ranged from μa = 20 to 60 cm−1 and = 15 to 25 cm−1, respectively, and at the emission wavelength, they ranged from μa = 0.02 to 0.06 cm−1 and = 8.7 to 14.5 cm−1. Fluorescence and reflectance measurements were acquired from each phantom using the probe. Figure 1 shows the marked effects of varying absorption [Fig. 1(a)] and scattering [Fig. (1d)] on the measured fluorescence spectra, primarily in intensity magnitude. Dividing the measured spectrum by partially corrects for changes in absorption [Fig. 1(b)] and, to a lesser extent, for changes in scattering [Fig. 1(e)]. Normalization by ()α further corrects for changes in absorption [Fig. 1(c)] as well as scattering [Fig 1(f)], and yields quantitative fluorescence spectra that are largely independent of variations in the optical properties. The optimal tissue-specific (i.e., optimized for each organ system due to organ-specific differences in optical properties) empirical parameter, α, was determined experimentally using the tissue-simulating phantoms in order to achieve the highest accuracy in CPpIX. As in previous studies, spectral unmixing was applied to the corrected fluorescence spectrum using the known PpIX emission spectrum as input. A calibration factor derived from the linear regression of Φ(λ) against the true concentration was applied to the PpIX spectrum to determine CPpIX. Figure 2(a) shows the raw fluorescence intensity and the CPpIX estimate following correction only for the absorption effects at the excitation wavelength as a function of the true PpIX concentration. Significant improvement in the goodness-of-fit, from R2 = 0.639 [root mean square error (RMSE) = 72%] [Fig. 2(a)] for the detected fluorescence (ΦFluo) to R2 = 0.944 (RMSE 24%) [Fig. 2(b)], resulted from correction by the reflectance close to the excitation only (ΦFluo/). Correction by the product ()α provided the greatest improvement with R2 = 0.994 (RMSE 8%) when α = −0.7 [Figs. 2(c) and 2(d)]. It is important to note that in this study α < 0, in contrast to similar algorithms in the literature with α > 0 [4], highlighting the application-specific need for optimization of our technique.
Fig. 1.
(Color online) Raw and corrected emission spectra measured on the tissue-phantoms. Optical phantoms with three different PpIX concentrations and a range of absorption and scattering values were used: (a, b, c) varying absorption with constant scattering; (d, e, f) varying scattering with constant absorption. The value of α = −0.7 is used in (c) and (f).
Fig. 2.
Relationship between the true PpIX concentration in phantoms based on (a) raw fluorescence intensity (λ = 635 nm), and (b) estimated CPpIX levels derived following correction of the raw fluorescence by division with (integrated reflectance in the range λ = 465 to 485 nm) (ΦFluo/). (c) Empirical determination of the optimal α value for PpIX quantification. (d) Relationship between the estimated and actual PpIX concentration in phantoms following correction of the raw fluorescence by the product of for α = −0.7. R2, coefficient of determination; RMSE, root mean square error.
Equation (1) was then evaluated in terms of quantifying CPpIX in biological tissue. A dose of 100 mg/kg body weight of ALA (Sigma-Aldrich Inc., Missouri) was injected via the tail vein in five male mice, and the animals were subsequently sacrificed by cervical dislocation under anesthesia at 0.5, 1, 2, 3, and 4 h later, respectively. The brains were then removed intact and measurements made with the probe at three different locations for each sample. The probe data (fluorescence and reflectance) were used to compute Φ(λ) in Eq. (1) for α = −0.7, from which CPpIX was determined. For comparison, quantitative fluorimetric measurements of CPpIX were performed on ex vivo brain tissue samples using an established technique [5,6]. Statistical analysis (paired Student’s t-test) showed no significant difference between the fluorimetric measurements and Eq. (1) estimates (p = 0.33). These results represent an initial demonstration that absolute quantification of PpIX in tissue using Eq. (1) is feasible and accurate.
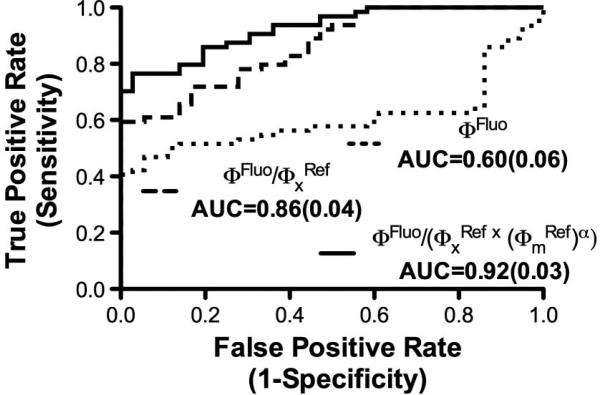
We have previously reported use of the probe in ALA-induced PpIX fluorescence-guided resection of human brain tumors [1]. Here, we revisit the same clinical data and retrospectively apply Eq. (1) to the measurements in patients with a diagnosis of glioma (N = 5), meningioma (N = 6), or metastatic (N = 3) brain tumor; multiple samples were used per patient: 64 tumor and 36 normal tissue samples. Receiver operating characteristic (ROC) curves were generated to assess the performance of Eq. (1) for detecting tumor tissue. Figure 3 shows ROC plots were estimates of CPpIX and the raw measured fluorescence (ΦFluo) intensity peak at λ = 635 nm are used as discriminatory variables for each tumor type. Statistically significant improvement in the performance of Φ(λ) from Eq. (1) was found with area under the curve (AUC) increasing to 0.92 [standard error (SE) = 0.03] from 0.60 (SE = 0.06) for the raw fluorescence signal.
Fig. 3.
ROC curves quantifying the performance of three different fluorescence correction methods for optical datasets acquired in vivo during 14 brain tumor resection procedures.
The use of ALA-induced PpIX fluorescence guidance during tumor resection is gaining momentum in the neurosurgical community, and increasing evidence exists that quantitative techniques [1] augment the visual assessment of fluorescence currently available to the surgeon. Here, we demonstrate that a dual-band normalization approach may also be feasible for determining PpIX concentrations quantitatively. The potential advantage of the technique is that it may be more amenable to a wide-field quantitative fluorescence imaging mode than the full-spectrum model-based method in [1,5], as a result of enhanced data collection, processing speed, and instrumentation complexity. The immediate limitation compared to the model-based approach is that it requires experimental determination of the empirical parameter, α, as well as a phantom derived calibration factor. Further studies will determine if other accuracy limitations for absolute fluorophore quantification exist when implemented in a wide-field imaging geometry in vivo.
Acknowledgments
This work was supported in part by National Institutes of Health (NIH) grants R01 NS052274 and K25 CA138578. DUSA Pharmaceuticals (Tarrytown, New York, USA) supplied the ALA. The authors would like to extend their gratitude to Brent T. Harris, who performed the pathology analysis of the clinical data.
References
- 1.Valdes PA, Leblond F, Kim A, Harris BT, Wilson BC, Fan X, Tosteson TD, Hartov A, Ji S, Erkmen K, Simmons NE, Paulsen KD, Roberts DW. J. Neurosurg. 2011;115:11. doi: 10.3171/2011.2.JNS101451. [DOI] [PMC free article] [PubMed] [Google Scholar]
- 2.Stummer W, Pichlmeier U, Meinel T, Wiestler OD, Zanella F, Reulen HJ. Lancet Oncol. 2006;7:392. doi: 10.1016/S1470-2045(06)70665-9. [DOI] [PubMed] [Google Scholar]
- 3.Richards-Kortum R, Sevick-Muraca E. Annu. Rev. Phys. Chem. 1996;47:555. doi: 10.1146/annurev.physchem.47.1.555. [DOI] [PubMed] [Google Scholar]
- 4.Bradley RS, Thorniley MS. J. R. Soc. Interface. 2006;3:1. doi: 10.1098/rsif.2005.0066. [DOI] [PMC free article] [PubMed] [Google Scholar]
- 5.Kim A, Khurana M, Moriyama Y, Wilson BC. J. Biomed. Opt. 2010;15:067006. doi: 10.1117/1.3523616. [DOI] [PMC free article] [PubMed] [Google Scholar]
- 6.Lilge L, O’Carroll C, Wilson BC. J. Photochem. Photobiol. B. 1997;39:229. doi: 10.1016/s1011-1344(97)00010-9. [DOI] [PubMed] [Google Scholar]


