

Abstract
Purpose
Numerous dietary factors elevate serum levels of insulin and insulin-like growth factor I (IGF-I), both potent prostate cancer mitogens. We tested whether varying dietary carbohydrate and fat, without energy restriction relative to comparison diets, would slow tumor growth and reduce serum insulin, IGF-I, and other molecular mediators of prostate cancer in a xenograft model.
Experimental Design
Individually caged male severe combined immunodeficient mice (n = 130) were randomly assigned to one of three diets (described as percent total calories): very high-fat/no-carbohydrate ketogenic diet (NCKD: 83% fat, 0% carbohydrate, 17% protein), low-fat/high-carbohydrate diet (LFD: 12% fat, 71% carbohydrate, 17% protein), or high-fat/moderate-carbohydrate diet (MCD: 40% fat, 43% carbohydrate, 17% protein). Mice were fed to maintain similar average body weights among groups. Following a preliminary feeding period, mice were injected with 1 × 10⁶ LNCaP cells (day 0) and sacrificed when tumors were ≥1,000 mm3.
Results
Two days before tumor injection, median NCKD body weight was 2.4 g (10%) and 2.1 g (8%) greater than the LFD and MCD groups, respectively (P < 0.0001). Diet was significantly associated with overall survival (log-rank P = 0.004). Relative to MCD, survival was significantly prolonged for the LFD (hazard ratio, 0.49; 95% confidence interval, 0.29–0.79; P = 0.004) and NCKD groups (hazard ratio, 0.59; 95% confidence interval, 0.37–0.93; P = 0.02). Median serum insulin, IGF-I, IGF-I/IGF binding protein-1 ratio, and IGF-I/IGF binding protein-3 ratio were significantly reduced in NCKD relative to MCD mice. Phospho-AKT/total AKT ratio and pathways associated with antiapoptosis, inflammation, insulin resistance, and obesity were also significantly reduced in NCKD relative to MCD tumors.
Conclusions
These results support further preclinical exploration of carbohydrate restriction in prostate cancer and possibly warrant pilot or feasibility testing in humans.
Insulin and insulin-like growth factor I (IGF-I) are potent mitogens for prostate cancer that exert pleiotropic effects including increase in proliferation, promotion of androgen independence, and prevention of apoptosis (1, 2). Epidemiologic studies support these observations by showing that elevated levels of serum insulin (3) and IGF-I (4) are associated with increased prostate cancer risk. Thus, strategies aimed at reducing serum levels of these hormones may be therapeutic and merit critical investigation.
Dietary carbohydrate restriction is one approach to reduce serum insulin and IGF-I levels (5–8). We previously tested whether a diet devoid of carbohydrates [i.e., a no-carbohydrate ketogenic diet (NCKD)] would extend survival in a prostate cancer xenograft model when compared with a high-fat/moderate-carbohydrate diet (MCD; previously named a Western diet; ref. 5). We also included a low-fat/high-carbohydrate diet (LFD) in our prior study to compare our intervention to the clinical standard of care for prostate cancer patients. Ultimately, we found that a NCKD slowed prostate tumor growth and prolonged overall survival relative to a MCD, and was at least equal to a LFD in these parameters. In particular, our study showed a NCKD reduced serum insulin and the IGF-I/IGF binding protein (IGFBP)-3 ratio, results predictive of increased survival. However, mice fed the NCKD lost weight before tumor injection, and thus whether prolonged survival was driven by energy restriction or carbohydrate restriction was unclear. Similar results have been reported by others, including a recent study investigating carbohydrate restriction in prostate cancer xenografts that revealed a positive association between carbohydrate intake and serum insulin levels (6). In that study, mice consuming a low-carbohydrate diet experienced slower tumor growth, although these mice consumed fewer calories and had lower average body weights than mice fed a high-carbohydrate/high-fat diet. Similarly, carbohydrate restriction in the context of overall calorie restriction also slows prostate cancer xenograft growth (8). Finally, carbohydrate restriction in a murine syngeneic model of brain cancer also reduces serum insulin and IGF-I levels and slows tumor growth although, again, in the setting of calorie restriction and/or weight loss (7).
To date, no study has shown whether carbohydrate restriction, without weight loss, reduces serum insulin and IGF-I levels and whether such changes slow tumor growth and extend overall survival relative to a MCD and/or a LFD. We therefore sought to test the generalizability and robustness of a NCKD to slow tumor growth in the absence of energy restriction in a prostate cancer xenograft model and to assess a broad array of molecular pathways that may mediate alterations of tumor growth as a function of varying carbohydrate intake.
Materials and Methods
Cell culture
LNCaP human prostate cancer cells were obtained from American Type Culture Collection. Cells were maintained in modified RPMI 1640 with 10% fetal bovine serum. Cells were incubated in 5% CO2 at 37°C and harvested by trypsinization at 70% to 80% confluence in log-phase growth on the day of tumor injection (day 0).
Animal studies
After obtaining approval from the Duke University Institutional Animal Care and Use Committee, 130 eight-week-old, male, Fox Chase severe combined immunodeficient (SCID) mice were obtained from Taconic Farms. Mice were housed individually to permit maintenance of precise feeding schedules. All diets were prepared by Test-Diet. No antioxidants were used to stabilize the fat content in any of the diets. Diets were stored at 4°C and fresh food was added to cages thrice weekly. Assessment of energy intake and feeding of all groups was done thrice weekly. Measurement of body weight and tumor volume was done twice per week. We previously observed that mice on a NCKD tend to overeat and gain weight when fed ad libitum relative to mice fed either a MCD or LFD. Similarly, isocaloric feeding for all three diet groups leads to weight loss in the NCKD group (5). Based on these observations, we performed an initial 8-wk pilot feeding study (without tumor injection) to determine the precise amount of excess calories NCKD-fed mice must consume to maintain body weights similar to ad libitum fed LFD mice. We observed that NCKD mice consuming 12.5% extra calories relative to ad libitum fed LFD mice exhibited similar body weights (data not shown). Such an excess calorie intake is less than the natural proclivity of these mice to overeat and thus forced feeding was not necessary.
For the xenograft experiment, 41/41/48 mice were randomized to LFD/MCD/NCKD groups, respectively. All mice were initially fed ad libitum for 8 d on their respective diets to ensure diet tolerability. After this time, LFD mice were fed ad libitum and the other groups were fed by a modified paired-feeding protocol to maintain isocaloric feeding conditions between the LFD and MCD groups and 12.5% extra calorie intake for the NCKD group relative to the LFD group. Such a protocol has been used in previous studies to implement precise feeding schedules (9). The overall macronutrient composition of each diet, expressed as a percentage total calories, was as follows (Table 1): LFD (kcal: 12% fat, 71% carbohydrate, 17% protein), MCD (kcal: 40% fat, 43% carbohydrate, 17% protein), and NCKD (kcal: 83% fat, 0% carbohydrate, 17% protein).
Table 1.
Ingredients of experimental diets
| LFD
|
MCD
|
NCKD
|
||||
|---|---|---|---|---|---|---|
| Grams | % of energy | Grams | % of energy | Grams | % of energy | |
| Fat—total | 61.2 | 12.0 | 204.0 | 40.0 | 422.5 | 82.8 |
| Corn oil | 3.0 | 0.6 | 9.8 | 2.0 | 20.1 | 4.0 |
| Milk fat | 29.1 | 5.7 | 97.1 | 19.0 | 201.2 | 39.4 |
| Lard | 29.1 | 5.7 | 97.1 | 19.0 | 201.2 | 39.4 |
| Protein | 197.1 | 17.2 | 197.1 | 17.2 | 197.1 | 17.2 |
| casein | 194.1 | 16.9 | 194.1 | 16.9 | 194.1 | 16.9 |
| DL-Methionine | 3.0 | 0.3 | 3.0 | 0.3 | 3.0 | 0.3 |
| Carbohydrate | 812.6 | 70.8 | 491.7 | 42.8 | 0.0 | 0.0 |
| Dextrin | 81.3 | 7.1 | 49.2 | 4.3 | 0.0 | 0.0 |
| Maltodextrin 10 | 162.5 | 14.2 | 98.3 | 8.6 | 0.0 | 0.0 |
| Sucrose | 568.8 | 49.5 | 344.2 | 29.9 | 0.0 | 0.0 |
| Cholesterol | 1.5 | 0.0 | 1.5 | 0.0 | 1.5 | 0.0 |
| AIN-76 mineral mix | 35.0 | 0.0 | 35.0 | 0.0 | 35.0 | 0.0 |
| AIN-76 vitamin mix | 10.0 | 0.0 | 10.0 | 0.0 | 10.0 | 0.0 |
| Cellulose | 50.0 | 0.0 | 50.0 | 0.0 | 50.0 | 0.0 |
| Calcium carbonate | 4.0 | 0.0 | 4.0 | 0.0 | 4.0 | 0.0 |
| Choline bitartrate | 2.0 | 0.0 | 2.0 | 0.0 | 2.0 | 0.0 |
| Total grams | 1,173.4 | 100.0 | 995.3 | 100.0 | 722.1 | 100.0 |
NOTE: Based on the amount of food needed to deliver 4,591.1 kcal of energy.
After 34 d of modified paired feeding, all mice were injected s.c. in the right flank with 1 × 10⁶ LNCaP tumor cells in 0.1 mL of Matrigel (Becton Dickinson). When tumors became palpable, tumor dimensions were measured with a digital caliper and tumor volume was calculated using a standard formula: width (mm) × height (mm) × length (mm) × 0.5236 (10). Fifteen days before and 13 d after tumor injection, all mice were bled via the facial vein to measure 4-h fasting glucose in whole blood using a handheld Ascensia Contour glucometer (Bayer Healthcare), and urine was obtained via gentle supra-pubic pressure to measure urinary ketosis (acetoacetate) using semiquantitative urine strips (Ketostix, Bayer Healthcare). When tumor volume was ≥1,000 mm3, mice were sacrificed by CO2 asphyxiation; serum was obtained via a cardiac puncture; and sections were taken from the liver, prostate, and kidney for either snap freezing or overnight fixation in 10% neutral-buffered formalin, embedded in paraffin, and stained with H&E. Serum samples were snap frozen at −80°C for further analysis. Immediately before sacrifice, all mice were fasted for at least 4 h and then assessed for urinary ketone and fasting glucose levels. Liver sections from the median surviving 11 mice per group were independently scored for fatty infiltration by a board-certified pathologist (S.V.P.) blinded to dietary assignment using a previously validated 0 to 4 scoring system, with severity of fatty infiltration increasing with higher score (11). All surviving mice were sacrificed 92 d after tumor injection, and mice with tumor volumes <1,000 mm3 were censored as alive at last follow-up. Subsequent to randomization, but before tumor injection, two mice died from dehydration (one LFD and one NCKD), two mice died during blood aspiration (one LFD and one NCKD), and one mouse died due to unexplained causes (one MCD). Overall, 125 mice were used for survival analyses.
Serum analysis
Serum from the median surviving 11 mice per group (total 33 mice) was assayed for hormone levels. The levels of fasting IGF-I, IGFBP-1, IGFBP-2, and IGFBP-3 were measured using a mouse-specific in-house ELISA described previously (12, 13). Fasting serum levels of insulin, receptor activator of nuclear factor-κB (NF-κB) ligand, leptin, adrenocorticorticotropic hormone, interleukin-6, and tumor necrosis factor-α were assayed using a murine multiplex ELISA kit from Millipore Life Sciences Research, Inc.
Tumor assays
AKT analysis
Tumor samples from the median five surviving mice per group were analyzed for intracellular content of the Ser473 phosphorylated form of AKT (phospho-AKT or p-AKT), total AKT (t-AKT), and β-actin as described previously (8). Briefly, LNCaP tumor lysates were prepared as follows: 1 mL of lysis buffer [2% Triton X-100, 300 mmol/L sodium chloride, 20 mmol/L Tris (pH 7.4), 2 mmol/L EDTA, 0.5 mmol/L sodium orthovanadate, 1% NP40, Protease inhibitor cocktail (Complete tablets, Roche Applied Sciences)] was added to thawed tissue samples (~10 mg). Samples were homogenized for 10 s on ice and centrifuged at 14,000 × g for 50 min at 4°C. Protein concentration in the supernatant fraction was determined and extracts were stored at −80°C. Protein bands were resolved by SDS-PAGE and immunoblots were developed with enhanced chemiluminescence plus reagent (Amersham Pharmacia). Antibodies to p-AKT, t-AKT, and β-actin were obtained from Cell Signaling Technology. Protein bands were quantified by densitometric analysis.
RNA isolation
RNA was extracted from 0.05 μg of tumor tissue from the median 11 surviving mice per group using the mirVana mRNA Isolation Kit (Ambion) and assessed for integrity (RNA 6000 Nano assay Kit, Agilent Technologies) and quantified (NanoDrop, Thermal Fisher Scientific). The targets for Affymetrix DNA microarray analysis were prepared according to the manufacturer’s instructions (Affymetrix). Biotin-labeled cRNA was produced by in vitro transcription, fragmented, and subsequently hybridized to the Affymetrix High Throughput Human Genome U133A array. All subsequent analyses were done in a MIAME (minimal information about a microarray experiment)-compliant fashion, as defined in the guidelines established by MGED.11 Two mice in the LFD and one mouse in the NCKD group had unusable RNA resulting in a total examination of 30 tumor samples.
Gene set enrichment analysis
Gene set enrichment analysis (GSEA, v2.0)12 was done for each xenograft sample based on prespecified diet phenotype and previously published methods (14). Gene sets were preprocessed to exclude gene sets with <10 and >500 genes, and 1,000 iterations were done per analysis with a signal-to-noise metric used to rank genes based on their differential expression across groups. As a hypothesis-generating experiment, gene sets with a nominal P < 0.05 were considered to be statistically significant (15).
Statistical analysis
Differences across diet groups were tested with the Kruskal-Wallis test for continuous variables and the χ2 test for categorical variables. Pairwise comparisons between groups were tested with the rank sum test or the χ2 test. Differences in survival among and between groups from time of tumor injection (day 0) to day of sacrifice were tested with the proportional hazards model and log-rank test. All statistical analyses were done using STATA 9.2 (Stata Corp.) with an α of 0.05. The α level was not adjusted for multiple comparisons.
Results
Calorie intake and body weight
Applying the results of our pilot feeding study, we fed mice on the NCKD an extra 12.5% calories relative to ad libitum fed mice on the LFD to maintain equal body weights among groups (Fig. 1A). However, after 12 days (day −30), NCKD mice became heavier than LFD mice (P < 0.03; Fig. 1B). Therefore, on day −24, modified paired feeding was adjusted to supply NCKD mice with only 10% extra calories relative to LFD mice. This feeding schedule was maintained throughout the remaining study period. At 2 days before tumor injection, median NCKD body weight was 2.4 g (10%) and 2.1 g (8%) greater than the LFD and MCD groups, respectively (P < 0.0001). After day 19, despite being fed 10% extra calories, NCKD mice lost weight such that by day 33 (3 days before first day of sacrifice), body weights were similar among groups (P = 0.26). After day 47, NCKD mice began to lose weight such that by day 54 there was a nonsignificant trend of NCKD mice being the lightest group (P = 0.09). However, this difference was not statistically significant and, by day 70, weights were equal among diet groups.
Fig. 1.

Mouse energy intake and body weights. One hundred thirty 8-wk-old male SCID mice were fed a LFD, MCD, or NCKD for 42 d and then injected s.c. in the flank with 1 × 10⁶ LNCaP tumor cells in 0.1 mL of Matrigel. Mice were weighed twice per week from the start of the experiment. Values are expressed as the median of each group. A, energy intake was measured for each mouse thrice per week by subtracting the weight of uneaten food from the weight of the food placed into the feeding receptacles at the start of each feeding period. B, mice were weighed twice per week from the start of the experiment. Values are expressed as the median of each group.
Glucose and ketone measurements
There were no significant differences in glucose levels among diet groups before tumor injection (day −15; P = 0.70) or after tumor injection (day 13; P = 0.14). Similarly, all paired comparisons showed no significant differences between groups. Median levels of nonfasting urinary ketones were significantly higher at day 19 in the NCKD group (median, 5 mg/dL) relative to LFD (median, 0 mg/dL) and MCD (median, 0 mg/dL) groups (P < 0.0001).
Tumor growth
After 92 days postinjection, overall tumor take was 94% with no significant differences among diet groups. Seven mice failed to develop tumors (three LFD, one MCD, and three NCKD). Time to tumor palpability (median, 20 days; P = 0.93) and tumor volumes at the time of initial palpability (P = 0.98) were similar across groups. By day 35, median tumor volumes for LFD/MCD/NCKD groups were 0 mm3/530 mm3/146 mm3, respectively (LFD versus MCD, P = 0.001; NCKD versus MCD, P = 0.04; Fig. 2A). Tumor volumes in the MCD group remained significantly larger than tumor volumes in the LFD and NCKD groups for the remainder of the study. Aside from day 39, when tumor volumes of the LFD group were significantly smaller than those of the NCKD group (P = 0.03), there were no significant differences in tumor volumes between the LFD and NCKD groups.
Fig. 2.

A, LNCaP xenograft tumor growth in SCID mice. Mice were injected s.c. on day 0 in the flank with 1 × 10⁶ LNCaP tumor cells in 0.1 mL of Matrigel. Once the tumors became palpable, tumor volume was measured twice per week. Values are expressed as the median of each group. Curves only extend up to the point at which ≥50% of the mice in the respective group had been sacrificed, and therefore median tumor volume is not meaningful. B, Kaplan-Meier survival plot of overall mouse survival by diet group on days 45 and 92.
Mouse survival
Diet group was significantly associated with overall survival (log-rank P = 0.004; Fig. 2B). Relative to the MCD group, survival was significantly prolonged for both the LFD (hazard ratio, 0.50; 95% confidence interval, 0.29–0.79; P = 0.005) and NCKD groups (hazard ratio, 0.59; 95% confidence interval, 0.37–0.93; P = 0.02). There was no significant difference in survival between the LFD and NCKD groups (P = 0.46). At the time of sacrifice, tumor volumes were similar across all groups (P = 0.74) and no gross metastases were identified in any mice. Given the nonsignificant weight loss in the NCKD group after day 45, we evaluated whether this accounted for overall differences in survival among groups at the conclusion of the study. Our analyses reveal that, had the study ended on day 45, diet would have remained significantly associated with overall survival (log-rank P = 0.002; Fig. 2B).
Serum insulin and IGF axis hormone levels
Overall, serum insulin levels differed significantly among diet groups (P = 0.002; Fig. 3A). The MCD group had the highest median insulin level, by 85% and 52% relative to the LFD and NCKD groups, respectively. Serum IGF-I levels also differed significantly among diet groups (P = 0.02; Fig. 3B), with the highest median levels in the LFD group by 25% and 67% relative to the MCD and NCKD groups, respectively. Although median serum levels of IGFBP-3 did not differ significantly among groups (P = 0.06; Fig. 3C), the IGF-I/IGFBP-3 ratio, a measure of “free” or bioactive IGF-I, was significantly different among groups (P = 0.02; Fig. 3D). The NCKD group had the lowest median IGF-I/IGFBP-3 ratio, which was nearly 25% lower than either the LFD or MCD group. Serum IGFBP-1 levels also differed significantly among groups (P = 0.004; Fig. 4A), with the NKCD group having the highest median levels by 16- and 4-fold relative to the LFD and MCD groups, respectively. In addition, the IGF-I/IGFBP-1 ratio, a measure of IGF-I activity under fasting conditions, differed significantly among groups (P = 0.004), with the LFD group having the highest median value by 17-fold (P = 0.01) and 3-fold (P = 0.004) relative to the NCKD and MCD groups, respectively (Fig. 4B). There was a trend, which did not reach statistical significance, for the NCKD group to have a lower IGF-I/IGFBP-1 ratio than the MCD group (P = 0.08). Similarly, serum IGFBP-2 levels differed significantly among groups (P = 0.004; Fig. 4C), with the highest median levels in the NCKD group by 25% and 14% relative to the LFD and MCD groups, respectively. A summary of all graphical data in Figs. 3 and 4 is provided in Table 2. There were no significant differences among groups in serum levels of receptor activator of NF-κB ligand, leptin, adrenocorticorticotropic hormone, interleukin-6, and tumor necrosis factor-α (data not shown).
Fig. 3.

Box-plot expression of fasting serum hormone concentrations at the time of sacrifice across all dietary groups. A, insulin; B, IGF-I; C, IGFBP-3; D, ratio of IGF-I/IGFBP-3. Upper and lower box borders represent 25th and 75th percentile values, respectively. Horizontal line within the box represents the median value. Upper and lower whiskers correspond to 95th and 5th percentile values, respectively.
Fig. 4.

Box-plot expression of fasting serum hormone concentrations at the time of sacrifice across all dietary groups. A, IGFBP-1; B, ratio of IGF-I/IGFBP-1; C, IGFBP-2. Upper and lower box borders represent 25th and 75th percentile values, respectively. Horizontal line within the box represents the median value. Upper and lower whiskers correspond to 95th and 5th percentile values, respectively.
Table 2.
Insulin and IGF axis hormones
| LFD | MCD | NCKD | P | |
|---|---|---|---|---|
| Insulin (pg/mL) | 515 [273;635] | 948 [739;1,337] | 623 [531;771] | 0.002 |
| IGF-I (ng/mL) | 507 [431;563] | 412 [330;506] | 301 [260;413] | 0.02 |
| IGFBP-3 (ng/mL) | 1,131 [1,083;1,427] | 1,010 [779;1,166] | 948 [764;1,342] | 0.06 |
| IGF-I/BP-3 ratio | 0.38 [0.36;0.47] | 0.42 [0.35;0.47] | 0.29 [0.28;0.40] | 0.02 |
| IGFBP-1 (ng/mL) | 6.3 [4.1;13.0] | 23.0 [13.0;32.5] | 103.0 [6.7;170.0] | 0.004 |
| IGF-I/BP-1 ratio | 63.5 [42.5;107.6] | 18.8 [12.7;23.5] | 3.7 [1.8;66.6] | 0.004 |
| IGFBP-2 (mg/mL) | 199 [157;235] | 218 [180;258] | 254 [249;352] | 0.004 |
NOTE: Row parameters correspond to fasting serum values at time of sacrifice for the median 11 surviving mice per diet group. Values in each cell are expressed as median and bracketed interquartile range. Columns 1 to 3 represent diet groups (LFD: low-fat/high-carbohydrate diet; MCD: high-fat/moderate carbohydrate diet; NCKD: very high-fat/no-carbohydrate diet). Column 4 represents P values for three-way comparisons (Kruskal-Wallis tests) among diet groups for each row parameter.
Tumor analysis
Western blot analysis of tumor extracts revealed significant differences in the p-AKT/t-AKT ratio (P = 0.04). In two-way comparisons, NCKD mice had significantly lower p-AKT/t-AKT levels than MCD mice (P = 0.009), but similar to LFD mice (P = 0.60). There was a trend, which did not reach statistical significance, for LFD mice to have lower p-AKT/t-AKT levels than MCD mice (P = 0.08). Data from pooled tumor extracts (n = 5 per group) are shown in Fig. 5 for illustrative purposes. Across all groups, a higher IGF-I/IGFBP-3 ratio was significantly correlated with higher p-AKT/t-AKT expression (Spearman r = 0.60, P = 0.03). There was no significant correlation between p-AKT/t-AKT expression and insulin (r = 0.40, P = 0.17), IGF-I (r = 0.37, P = 0.21), IGFBP-1 (r = −0.20, P = 0.51), IGFBP-2 (r = −0.02, P = 0.94), IGFBP-3 (r = 0.10, P = 0.73), or IGF-I/IGFBP-1 (r = 0.19, P = 0.53).
Fig. 5.
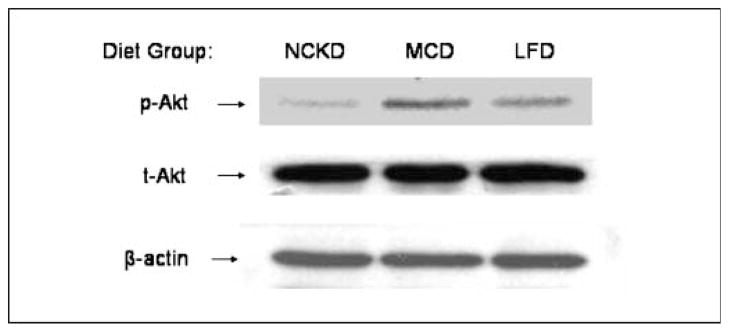
Western blot analysis of p-AKT, t-AKT, and β-actin in pooled tumor lysates for each diet group (n = 5 per group). Total AKT levels reflect phosphorylated and unphosphorylated forms, whereas p-AKT reflects levels of the Ser473 phosphoform. β-Actin was used as an internal control for protein loading and transfer.
Gene expression analysis
Gene set enrichment analysis revealed a diverse group of pathways significantly enriched across different diets (Supplementary Data). A comparison between the MCD and NCKD groups revealed that 26 gene sets were significantly enriched in the MCD group, and 67 in the NCKD group. Eleven gene sets were significantly enriched in the MCD group relative to the LFD group, and 74 pathways were enriched in the LFD group. Comparison of the LFD and NCKD groups revealed 35 pathways significantly enriched in the LFD group, and 14 in the NCKD group. Pathway analysis revealed greater activation of inflammatory pathways with greater carbohydrate intake. In addition, gene pathways implicated in obesity, insulin resistance, and inflammation were significantly enriched in the MCD group relative to the NCKD group, whereas pathways implicated in the mitogen-activated protein (MAP) kinase cascade and NF-κB activation were enriched in the MCD group relative to the LFD group.
Hepatic steatosis
Given the concerns that very high intake of fat associated with a NCKD may result in fatty infiltration of the liver, we assessed for histologic evidence of fatty liver among the median 11 surviving mice from all groups. Overall, diet was significantly associated with extent of hepatic steatosis, with mice consuming the NCKD (median score = 1.5) having the least amount of fatty infiltration by a median score of 1.5 points lower than mice consuming either the LFD or MCD (P = 0.0006).
Discussion
Prior studies found that carbohydrate restriction slows prostate tumor growth in murine xenograft models relative to high-fat/high-carbohydrate diets (5–8). Moreover, carbohydrate restriction resulted in marked reductions in serum insulin and/or IGF-I, potentially mediating tumor growth delay. However, all previous studies were done in the context of calorie restriction and/or weight loss, and thus whether results were due to either overall energy restriction or specifically carbohydrate restriction remained unclear. We therefore sought to test carbohydrate restriction without energy restriction to clarify whether carbohydrate restriction alone results in tumor growth delay. Furthermore, our study addressed the concern that carbohydrate-restricted diets contain excessive fat, which may stimulate tumor growth (9, 10, 16). This concern was particularly relevant to our formulation of a NCKD because it was largely composed of saturated fats from milk and lard for an overall caloric composition of 83% from fat. Our study also provided the opportunity to further elucidate the molecular mechanisms through which variations in dietary carbohydrate may influence prostate tumor growth.
We compared the effects of NCKD, LFD, and MCD on the growth of the commonly used prostate cancer cell line LNCaP. This cell line offers several advantages when testing the role of a NCKD on prostate tumor growth. First, LNCaP is a commonly used model of hormone-responsive prostate cancer, potentially broadening the applicability of our results to previous and future studies. Second, LNCaP exhibits stimulated growth in response to increased dietary fat consumption and thus is a reasonable model to test whether the effects of carbohydrate restriction outweigh the effects of high fat intake on tumor growth (16). In addition, LNCaP undergoes increased cell proliferation in vitro in response to insulin (17) and IGF-I (2), further supporting the use of this cell line as an appropriate model to examine whether alterations of IGF axis hormones mediated by diet can modulate prostate tumor growth.
Before conducting the present study, we conducted a pilot feeding study (without tumor injection) to determine the calorie intake level necessary to maintain similar body weights among diet groups. Previous observations revealed that NCKD mice consumed more calories than LFD-fed mice in ad libitum settings (5), consistent with our pilot study that revealed that NCKD mice required 12.5% more calories relative to LFD mice to maintain similar body weights. Despite using this information to guide our feeding protocol, we nonetheless observed that the NCKD group remained consistently heavier than the other two groups, even after reducing the daily calorie supplement early in the study from 12.5% to 10%. Prior studies using isocaloric feeding reported weight loss for mice on carbohydrate-restricted diets relative to comparison diets (5, 6). As such, this weight loss in previous studies may have biased findings in favor of carbohydrate restriction. Conversely, in the current study, weight gain among NCKD mice may have biased the findings against the NCKD. Overall, our experience highlights the complexities of replicating animal feeding behaviors, which may be dependent on genetic and/or environmental factors difficult to control in successive experiments. This is particularly challenging when testing more than two diets because the potential for intergroup variation is greater than in studies involving only two groups (6, 7).
Diet group was significantly associated with overall survival, with both the LFD and NCKD groups experiencing significantly longer survival than the MCD group. The survival benefit in the NCKD group was accompanied by favorable changes in both serum levels of key IGF axis hormones and in IGF axis signaling within the tumor as measured by the downstream marker p-AKT. This suggests that reduced IGF axis signaling may underscore the observed survival benefit of a NCKD. Although survival was similarly prolonged in the LFD group, there were fewer significant changes in serum IGF axis hormones and less reduction in p-AKT levels in this diet group, suggesting the LFD may have growth inhibitory effects that are less strongly mediated by IGF signaling.
Our results are consistent with prior studies that examined carbohydrate-restricted diets in the context of energy restriction. In particular, our finding that carbohydrate restriction is associated with the lowest serum levels of IGF-I is consistent with previous investigations (5–8). However, in contrast to previous studies (6–8), we further clarified this finding by measuring serum levels of IGFBP-1 and IGFBP–3 to assess the fraction of free or bioactive hormone reflected by the values of IGF-I/IGFBP-1 and IGF-I/IGFBP-3 ratios. Ultimately, we found the NCKD led to significant reductions in the IGF-I/IGFBP-3 ratio relative to the MCD. We also observed that IGFBP-1 was significantly higher in the NKCD group relative to both the LFD and MCD groups. In addition, the IGF-I/IGFBP-1 ratio, a marker of fasting IGF axis activity that has not previously been measured in studies of carbohydrate restriction, was lowest in the NCKD group. We also observed that the NCKD led to the highest serum levels of IGFBP-2, which may further reduce circulating free IGF-I. Together, these findings provide the strongest evidence to date that a NCKD is associated with beneficial changes across multiple parameters of the IGF axis to slow prostate tumor growth.
Consistent with the observed IGF axis measurements, AKT signaling in tumor tissue revealed favorable changes for the NCKD, in line with previous results (6). In particular, both intracellular levels of p-AKT and percent activated AKT, as measured by the p-AKT/t-AKT ratio, were lowest in the NKCD group relative to the MCD and LFD groups. When analyzing these findings in the context of IGF axis hormones, we observed a novel correlation between the serum IGF-I/IGFBP-3 ratio and tumor p-AKT/t-AKT expression. This result has not previously been reported in the context of xenograft studies of carbohydrate restriction and may further underscore the importance of IGF-I to AKT signaling and overall tumor growth in dietary strategies modulating carbohydrate intake.
In the current study, serum insulin levels were lowest for the LFD group and were significantly lower in both the LFD and NCKD groups relative to the MCD group. However, serum IGF-I was highest in the LFD group, which approached statistical significance relative to the MCD group (P = 0.07) and was significantly higher than the NCKD group (P = 0.01). Thus, the benefits of a LFD on the IGF axis seems to be less pronounced in the current study compared with clearer benefits observed previously (5, 9).
Our prior study comparing these same three diets (5) suggested that a NCKD prolonged survival relative to a LFD, although this did not reach statistical significance (hazard ratio, 0.71; P = 0.24). Therefore, we powered the current study to detect a 29% prolongation of survival, which required 50% more mice than our prior study. Ultimately, we observed no significant difference in survival between the LFD and NCKD groups although the NCKD was associated with several metabolic changes suggestive of more favorable outcomes than the LFD. Of note, NCKD mice were significantly heavier than LFD mice during the majority of the experiment. Given that lower body weight may slow tumor growth (8, 18), this may have biased our results against the NCKD, potentially explaining the lack of difference in tumor growth and/or survival between the LFD and NCKD groups. Alternatively, it is possible that dietary fat may stimulate LNCaP xenograft growth to a greater degree than other cell lines, partially negating the superior benefits of the NCKD on IGF-I signaling. Ultimately, we found no evidence that a LFD, the current recommended diet for cancer patients, was superior to a NCKD. However, it should be noted that the LFD had a higher level of simple carbohydrates in the form of sucrose than what is recommended in humans (19). However, a similar LFD with high sucrose content was used in prior preclinical studies and led to slower tumor growth and delayed development of androgen resistance relative to a MCD (9, 10). Ultimately, whether similar results would be obtained by alternative formulations of carbohydrate composition in a LFD remains unknown.
To further explore the complex molecular mechanisms through which dietary carbohydrate variation may affect cancer growth, we performed gene expression analysis of tumor tissue. Our expression analysis showed that pathways related to insulin resistance, obesity, and anti-apoptosis were up-regulated in tumors from MCD mice relative to tumors from NCKD and LFD mice. In particular, NF-κB and MAP kinase pathways were up-regulated in MCD tumors. Although NF-κB is normally expressed at low levels in LNCaP cells (19), increased NF-κB levels would promote anti-apoptotic pathways (19). In addition, higher serum insulin levels may stimulate tumor growth by activating MAP kinase pathways (20). Further increases in MAP kinase signaling by elevated serum IGF-I may synergize with insulin signaling through the MAP kinase pathway to further promote tumor growth (21) in the MCD group relative to the NCKD and LFD groups.
Assessment of liver histology revealed that the NCKD group had the least fatty infiltration. Similar benefits from carbohydrate restriction were previously observed in patients with nonalcoholic fatty liver disease (22). In that study, four of five patients showed histologic improvements in fatty infiltration, inflammation, and fibrosis after 6 months of dietary carbohydrate restriction. Further benefits for these patients included marked weight loss and favorable changes in high-density lipoprotein, low-density lipoprotein, and triglycerides, trends indicating reduced cardiovascular risk. Indeed, numerous clinical trials show that carbohydrate restriction leads to sustained weight loss for up to 1 year with beneficial changes in serum lipoproteins such as high-density lipoprotein, total cholesterol, and triglycerides, suggesting that carbohydrate-restricted diets may have cardiac benefits (23–28). These benefits are important given that cardiovascular morbidity is a major cause of mortality among prostate cancer patients (29).
One primary limitation of the present study was that mice were randomized before tumor injection, whereas previous investigations randomized mice after tumor injection or palpability (6–8). Typically, lifestyle modifications, including dietary changes, are used after cancer diagnosis. We used the current model to maximize the time mice consumed their respective diets to show proof of concept before conducting a postinjection study. A second limitation is that a diet devoid of carbohydrates may not be feasible in a clinical setting. Alternatively, further research may determine an upper limit of carbohydrate intake that preserves tumor inhibitory effects. In addition, our formulation of a NCKD may pose practical challenges given its high saturated fat content primarily from milk and lard. Although we purposefully formulated the NCKD in this manner to test whether benefits of carbohydrate restriction were sufficiently robust to be observed with a diet composed mostly of saturated fat, future studies should be aimed at testing NCKDs composed of mixtures of other types of fats (e.g., mono- and poly-unsaturates) that may extend survival beyond that observed in this study. Finally, we cannot be certain that removing dietary carbohydrate via a NCKD was responsible for the tumor growth delay observed in our study. For example, it is possible that fat intake may have a biphasic effect on tumor growth and that extremely high fat intake may slow growth. Alternatively, the high fat content of the NCKD may have facilitated uptake of fat-soluble vitamins, which themselves exert anti-tumor effects. Moreover, it is possible that changes in serum levels of androgen and/or prostate-specific antigen in response to fat intake may account for at least some of the differential effects on growth kinetics of tumors. However, previous studies have argued against such an effect (9, 10). Similarly, whereas it remains possible that alterations in serum levels of angiogenic factors may have played a role in our observations, the gene expression data did not reveal such changes between diet groups. Lastly, it is possible that ketone bodies themselves are toxic to tumors. Thus, whereas we clearly show significant changes in the IGF axis associated with a NCKD, other mechanisms unrelated to dietary carbohydrate intake per se may have contributed to tumor growth delay.
Overall, our current findings extend observations from previous preclinical studies to show that varying dietary carbohydrate intake is associated with benefits independent from those of energy restriction. As such, it remains plausible that clinical studies may reveal that a carbohydrate-restricted diet coupled with significant weight loss may result in additive benefits to further slow tumor growth than either carbohydrate or energy restriction alone, as revealed in preclinical studies to date.
Conclusion
This study shows a NCKD, without energy restriction, slowed tumor growth and significantly prolonged survival relative to a MCD. In addition, survival in the NCKD group was similar to the LFD group despite greater average body weight in the NCKD group. Furthermore, the NCKD resulted in favorable changes in serum IGF axis proteins, p-AKT/t-AKT expression, and reduced expression of inflammatory pathway genes. Despite its very high fat content, the NCKD was well tolerated and did not cause toxicity. These results provide further support for pursuing clinical trials to test whether dietary carbohydrate restriction slows prostate cancer growth.
Supplementary Material
Acknowledgments
Grant support: Department of Veterans Affairs; Division of Urology, Department of Surgery, Duke University; the Department of Defense Prostate Cancer Research Program; the American Urological Association/Foundation Astellas Rising Star in Urology Award; and the Robert C. Atkins Foundation. Views and opinions of and endorsements by the author(s) do not reflect those of the U.S. Army or the Department of Defense.
Footnotes
Note: Supplementary data for this article are available at Cancer Prevention Research Online (http://cancerprevres.aacrjournals.org/).
Disclosure of Potential Conflicts of Interest
No potential conflicts of interest were disclosed.
References
- 1.McKeehan WL, Adams PS, Rosser MP. Direct mitogenic effects of insulin, epidermal growth factor, glucocorticoid, cholera toxin, unknown pituitary factors and possibly prolactin, but not androgen, on normal rat prostate epithelial cells in serum-free, primary cell culture. Cancer Res. 1984;44:1998–2010. [PubMed] [Google Scholar]
- 2.Iwamura M, Sluss PM, Casamento JB, Cockett AT. Insulin-like growth factor I: action and receptor characterization in human prostate cancer cell lines. Prostate. 1993;22:243–52. doi: 10.1002/pros.2990220307. [DOI] [PubMed] [Google Scholar]
- 3.Hsing AW, Chua S, Jr, Gao YT, et al. Prostate cancer risk and serum levels of insulin and leptin: a population-based study. J Natl Cancer Inst. 2001;93:783–9. doi: 10.1093/jnci/93.10.783. [DOI] [PubMed] [Google Scholar]
- 4.Chan JM, Stampfer MJ, Giovannucci E, et al. Plasma IGF-1 and prostate cancer risk: a prospective study. Science. 1998;279:563–6. doi: 10.1126/science.279.5350.563. [DOI] [PubMed] [Google Scholar]
- 5.Freedland SJ, Mavropoulos JC, Wang A, et al. Carbohydrate restriction, prostate cancer growth, and the insulin-like growth factor axis. Prostate. 2008;68:11–9. doi: 10.1002/pros.20683. [DOI] [PMC free article] [PubMed] [Google Scholar]
- 6.Venkateswaran V, Haddad AQ, Fleshner NE, et al. Association of diet-induced hyperinsulinemia with accelerated growth of prostate cancer (LNCaP) xenografts. J Natl Cancer Inst. 2007;99:1793–800. doi: 10.1093/jnci/djm231. [DOI] [PubMed] [Google Scholar]
- 7.Seyfried TN, Sanderson TM, El-Abbadi MM, McGowan R, Mukherjee P. Role of glucose and ketone bodies in the metabolic control of experimental brain cancer. Br J Cancer. 2003;89:1375–82. doi: 10.1038/sj.bjc.6601269. [DOI] [PMC free article] [PubMed] [Google Scholar]
- 8.Mukherjee P, Sotnikov AV, Mangian HJ, Zhou JR, Visek WJ, Clinton SK. Energy intake and prostate tumor growth, angiogenesis, and vascular endothelial growth factor expression. J Natl Cancer Inst. 1999;91:512–23. doi: 10.1093/jnci/91.6.512. [DOI] [PubMed] [Google Scholar]
- 9.Ngo TH, Barnard RJ, Cohen P, et al. Effect of isocaloric low-fat diet on human LAPC-4 prostate cancer xenografts in severe combined immunodeficient mice and the insulin-like growth factor axis. Clin Cancer Res. 2003;9:2734–43. [PubMed] [Google Scholar]
- 10.Ngo TH, Barnard RJ, Anton T, et al. Effect of isocaloric low-fat diet on prostate cancer xenograft progression to androgen independence. Cancer Res. 2004;64:1252–4. doi: 10.1158/0008-5472.can-03-3830. [DOI] [PubMed] [Google Scholar]
- 11.Brunt EM, Janney CG, Di Bisceglie AM, Neuschwander-Tetri BA, Bacon BR. Nonalcoholic steatohepatitis. A proposal for grading and staging the histological lesions. Am J Gastroenterol. 1999;94:2467–74. doi: 10.1111/j.1572-0241.1999.01377.x. [DOI] [PubMed] [Google Scholar]
- 12.Yakar S, Bouxsein ML, Canalis E, et al. The ternary IGF complex influences postnatal bone acquisition and the skeletal response to intermittent parathyroid hormone. J Endocrinol. 2006;189:289–99. doi: 10.1677/joe.1.06657. [DOI] [PubMed] [Google Scholar]
- 13.Watson CS, Bialek P, Anzo M, Khosravi J, Yee SP, Han VK. Elevated circulating insulin-like growth factor binding protein-1 is sufficient to cause fetal growth restriction. Endocrinology. 2006;147:1175–86. doi: 10.1210/en.2005-0606. [DOI] [PubMed] [Google Scholar]
- 14.Subramanian A, Tamayo P, Mootha VK, et al. Gene set enrichment analysis: a knowledge-based approach for interpreting genome-wide expression profiles. Proc Natl Acad Sci U S A. 2005;102:15545–50. doi: 10.1073/pnas.0506580102. [DOI] [PMC free article] [PubMed] [Google Scholar]
- 15.Majumder PK, Febbo PG, Bikoff R, et al. mTOR inhibition reverses Akt-dependent prostate intra-epithelial neoplasia through regulation of apoptotic and HIF-1-dependent pathways. Nat Med. 2004;10:594–601. doi: 10.1038/nm1052. [DOI] [PubMed] [Google Scholar]
- 16.Wang Y, Corr JG, Thaler HT, Tao Y, Fair WR, Heston WD. Decreased growth of established human prostate LNCaP tumors in nude mice fed a low-fat diet. J Natl Cancer Inst. 1995;87:1456–62. doi: 10.1093/jnci/87.19.1456. [DOI] [PubMed] [Google Scholar]
- 17.Hedlund TE, Miller GJ. A serum-free defined medium capable of supporting growth of four established human prostatic carcinoma cell lines. Prostate. 1994;24:221–8. doi: 10.1002/pros.2990240502. [DOI] [PubMed] [Google Scholar]
- 18.Boileau TW, Liao Z, Kim S, Lemeshow S, Erdman JW, Jr, Clinton SK. Prostate carcinogenesis in N-methyl-N-nitrosourea (NMU)-testosterone-treated rats fed tomato powder, lycopene, or energy-restricted diets. J Natl Cancer Inst. 2003;95:1578–86. doi: 10.1093/jnci/djg081. [DOI] [PubMed] [Google Scholar]
- 19.Doyle C, Kushi LH, Byers T, et al. The 2006 Nutrition, Physical Activity and Cancer Survivorship Advisory Committee. Nutrition and physical activity during and after cancer treatment: an American Cancer Society guide for informed choices. CA Cancer J Clin. 2006;56:323–53. doi: 10.3322/canjclin.56.6.323. [DOI] [PubMed] [Google Scholar]
- 20.Palayoor ST, Youmell MY, Calderwood SK, Coleman CN, Price BD. Constitutive activation of IκB kinase α and NF-κB in prostate cancer cells is inhibited by ibuprofen. Oncogene. 1999;18:7389–94. doi: 10.1038/sj.onc.1203160. [DOI] [PubMed] [Google Scholar]
- 21.Sachdev D, Yee D. Disrupting insulin-like growth factor signaling as a potential cancer therapy. Mol Cancer Ther. 2007;6:1–12. doi: 10.1158/1535-7163.MCT-06-0080. [DOI] [PubMed] [Google Scholar]
- 22.Tendler D, Lin S, Yancy WS, Jr, et al. The effect of a low-carbohydrate, ketogenic diet on nonalcoholic fatty liver disease: a pilot study. Dig Dis Sci. 2007;52:589–93. doi: 10.1007/s10620-006-9433-5. [DOI] [PubMed] [Google Scholar]
- 23.Foster GD, Wyatt HR, Hill JO, et al. A randomized trial of a low-carbohydrate diet for obesity. N Eng J Med. 2003;348:2082–90. doi: 10.1056/NEJMoa022207. [DOI] [PubMed] [Google Scholar]
- 24.Stern L, Iqbal N, Seshadri P, et al. The effects of low-carbohydrate versus conventional weight loss diets in severely obese adults: one-year follow-up of a randomized trial. Ann Intern Med. 2004;140:778–85. doi: 10.7326/0003-4819-140-10-200405180-00007. [DOI] [PubMed] [Google Scholar]
- 25.Brehm BJ, Seeley RJ, Daniels SR, D’Alessio DA. A randomized trial comparing a very low carbohydrate diet and a calorie-restricted low fat diet on body weight and cardiovascular risk factors in healthy women. J Clin Endocrinol Metab. 2003;88:1617–23. doi: 10.1210/jc.2002-021480. [DOI] [PubMed] [Google Scholar]
- 26.Meckling KA, O’Sullivan C, Saari D. Comparison of a low-fat diet to a low-carbohydrate diet on weight loss, body composition, and risk factors for diabetes and cardiovascular disease in free-living, overweight men and women. J Clin Endocrinol Metab. 2004;89:2717–23. doi: 10.1210/jc.2003-031606. [DOI] [PubMed] [Google Scholar]
- 27.Sondike SB, Cooperman N, Jacobson MS. Effects of a low-carbohydrate diet on weight loss and cardiovascular risk factors in overweight adolescents. J Pediatr. 2003;142:252–8. doi: 10.1067/mpd.2003.4. [DOI] [PubMed] [Google Scholar]
- 28.Yancy WS, Jr, Olsen MK, Guyton JR, Bakst RP, Westman EC. A low-carbohydrate, ketogenic diet versus a low-fat diet to treat obesity and hyperlipidemia: a randomized, controlled trial. Ann Intern Med. 2004;104:769–77. doi: 10.7326/0003-4819-140-10-200405180-00006. [DOI] [PubMed] [Google Scholar]
- 29.Jemal A, Siegel R, Ward E, Taylor M, Xu J, Thun M. Cancer statistics, 2007. CA Cancer J Clin. 2007;57:43–66. doi: 10.3322/canjclin.57.1.43. [DOI] [PubMed] [Google Scholar]
Associated Data
This section collects any data citations, data availability statements, or supplementary materials included in this article.