Abstract
Microwave imaging is based on the electrical property (permittivity and conductivity) differences in materials. Microwave imaging for biomedical applications is particularly interesting, mainly due to the fact that available range of dielectric properties for different tissues can provide important functional information about their health. Under the assumption that a 3D scattering problem can be reasonably represented as a simplified 2D model, one can take advantage of the simplicity and lower computational cost of 2D models to characterize such 3D phenomenon. Nonetheless, by eliminating excessive model simplifications, 3D microwave imaging provides potentially more valuable information over 2Dtechniques, and as a result, more accurate dielectric property maps may be obtained. In this paper, we present some advances we have made in three–dimensional image reconstruction, and show the results from a 3D breast phantom experiment using our clinical microwave imaging system at Dartmouth Hitchcock Medical Center (DHMC), NH.
I. Introduction
Microwave imaging is based on recovering dielectric properties (permittivity and conductivity) of materials. Over last two decades, microwave imaging has attracted increasing interests in biomedical applications (in particular, for breast cancer screening and therapy monitoring), mainly due to the significant dielectric property contrast between normal and malignant breast tissue [1, 2]. Compared to other conventional imaging modalities, such as X–ray mammography, microwave imaging is attractive in several important aspects, namely its non–ionizing and non–compressive nature, in addition to relatively low–cost associated with the hardware system.
During microwave data acquisition, electromagnetic fields propagate through, and scatter from the tissue in a three–dimensional (3D) fashion. However, in order to reduce the computational complexity and to speed up the image reconstruction process, it is often assumed that the behavior of electromagnetic waves in 3D space can be represented as a simplified 2D model. While it benefits from less intensive computational demands, such assumption, including the field confinement to only the transverse magnetic (TM) mode, can lead into increased level of artifacts in the recovered dielectric properties. Moreover, since only in–plane data is collected in 2D imaging, if the region of interest is small enough to fall between two consecutive imaging slices, the 2D reconstruction algorithm may not detect the target accurately. Therefore, in order to improve the accuracy and quality of reconstructed images, a viable 3D microwave image reconstruction scheme is desired.
We have recently developed a graphical user interface (GUI) for reconstructing 3D microwave images using parallel computing techniques in MATLAB. In this paper, we review the main steps in the image reconstruction procedure, along with a brief description of our clinical microwave imaging system at Dartmouth Hitchcock Medical Center (DHMC). Finally we show the results from a 3D breast–shaped phantom experiment followed by the discussion and conclusion sections.
II. Methods
A. Image Reconstruction Scheme
In our microwave imaging reconstruction algorithm, the main problem is to determine the distribution of the constitutive parameters within the imaging domain. The dielectric properties are represented by the complex wave number squared and can be written as
| (1) |
where r⃗ is the 3D position vector (x,y,z) in Cartesian coordinates in the imaging domain, ω is the angular frequency, j is the imaginary unit, µ0 is the free–space permeability, ε is the permittivity, and σ is the conductivity. In our finite element time domain (FDTD) algorithm, calculation of the forward solution is based on the 3D form of Maxwell’s equations [3], whereas the reconstruction process is based on a Gauss–Newton iterative approach using a log transformation of the least squares minimization problem with the following objective function [4, 5]:
| (2) |
where Γm and Γc are the log magnitudes and Φm and Φc are the phases of the measured and computed field values, respectively [4, 6, 7], λ is the weighting coefficient, also known as Tikhonov regularization parameter, and L is a positive definite, dimensionless regularization matrix. is a prior estimate of k2 and ‖·‖2 is the vector two–norm. In the current study, the choice of λ is derived empirically. Setting the regularization matrix L to identity (i.e. applying the same weight to the values at all reconstruction parameter mesh nodes within the imaging domain), and assuming that the prior estimate of k2 is that of the previous iteration (i.e. ), the objective function Ω in equation (2) can be minimized and solved for the iterative property update,
| (3) |
where is the vector k2 at iteration η and is updated as
| (4) |
J is the Jacobian matrix, which consists of derivatives of the log magnitude and phase of the computed field values with respect to the property value at each of the N reconstruction parameter mesh nodes. In order to reduce the computational time, the adjoint method is used to calculate the elements of the Jacobian matrix in equation (3). More information about the adjoint methods for Gauss–Newton parameter estimation can be found in [8, 9].
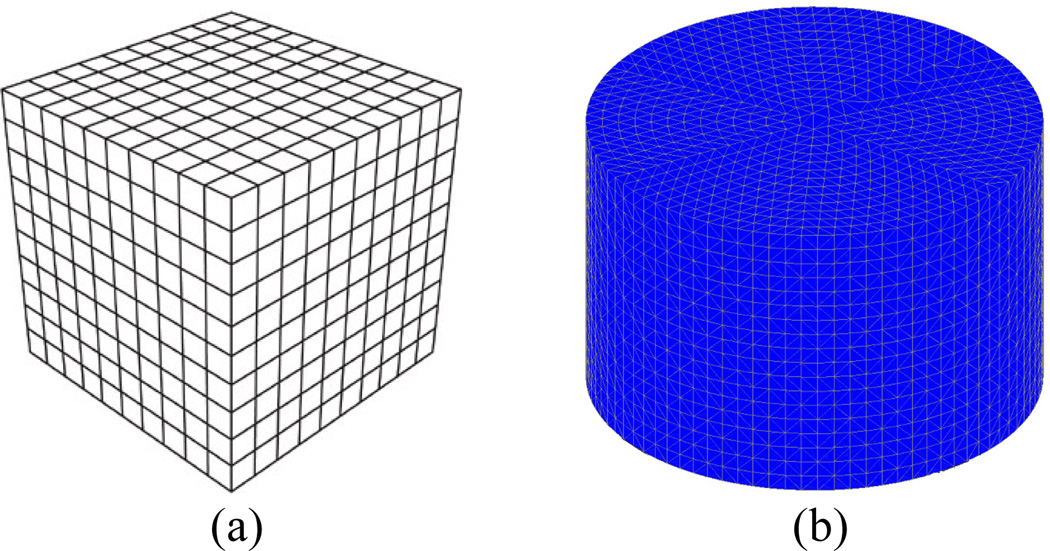
In addition, we use a dual–mesh approach where the forward solution is computed on a uniform 3D rectangular cuboid FDTD grid (figure 1–a), while the dielectric property distributions are reconstructed on a cylindrical tetrahedral–element mesh (figure 1–b) placed concentrically within the antenna array. The dual–mesh scheme avoids so–called “inverse crime”, while it is also a simple and effective way to control the size of the forward and inverse problems independently [10].
Figure 1.
(a) 3D FDTD grid used for forward solution, (b) cylindrical tetrahedral element mesh used for reconstruction
B. Computational Acceleration for Image Reconstruction
MATLAB is a high–performance language for technical computing which integrates computation, visualization, and programming in an easy–to–use environment. MATLAB Graphical User Interface (GUI) is also a powerful tool exploiting advanced computational and graphical functions of MATLAB. However, for computationally complex problems such as our 3D microwave image reconstruction, MATLAB is inherently less efficient than other prominent programming languages, such as FORTRAN, C, or C++. Nonetheless, MATLAB enables us to evaluate our codes using “performance profiling” and take advantage of MEX–files to improve speed of computationally intensive portions of our program. Finally, MATLAB offers the Parallel Computing Toolbox to parallelize high–level constructs, such as for–loops, using multi–core processors or computer clusters. Parallel computing is very appealing in 3D microwave image reconstruction, especially to solve the forward model, where the electromagnetic field has to be calculated for each source (in our case, for each transmitter), as well as calculating the Jacobian matrix. The forward problem is certainly the most time consuming portion of the image reconstruction algorithm, but since it can be solved for each source independently, we can parallelize and calculate the field corresponding to each antenna simultaneously. In an optimal case, the forward model for all sources can be calculated concurrently by using as many core–processors/cluster–nodes as number of sources. In the current study we are using 32 AMD Opteron 2384 (2.7 GHz) processors with 32 Gb RAM and 250 Gb hard disk.
C. Clinical Microwave Imaging System
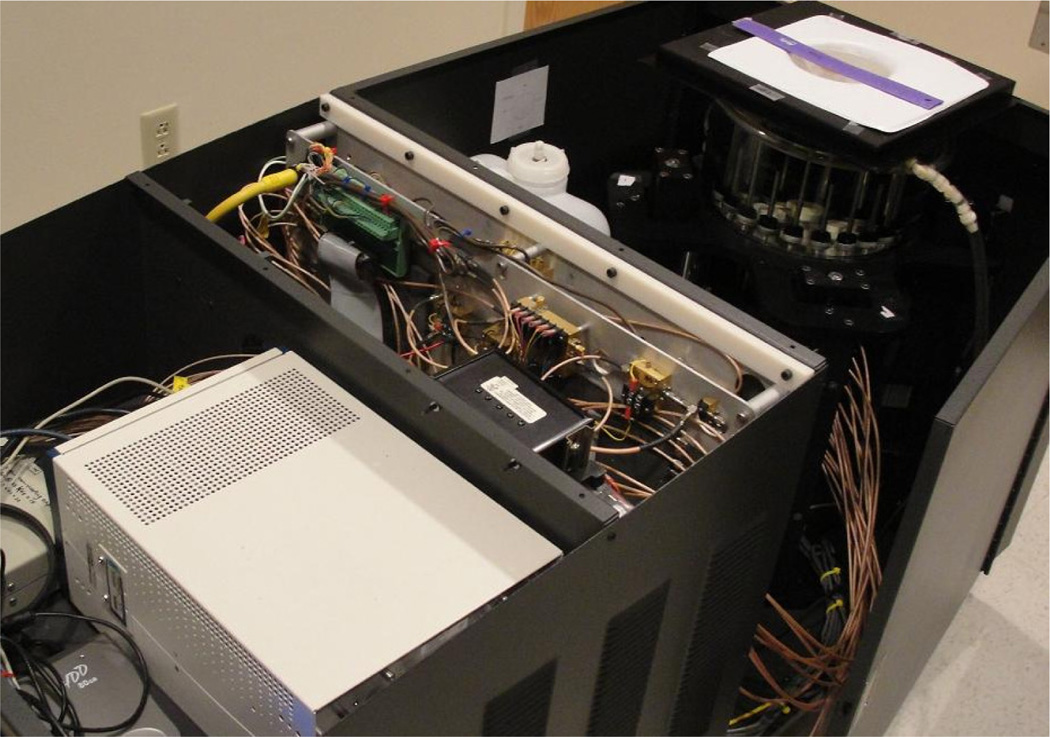
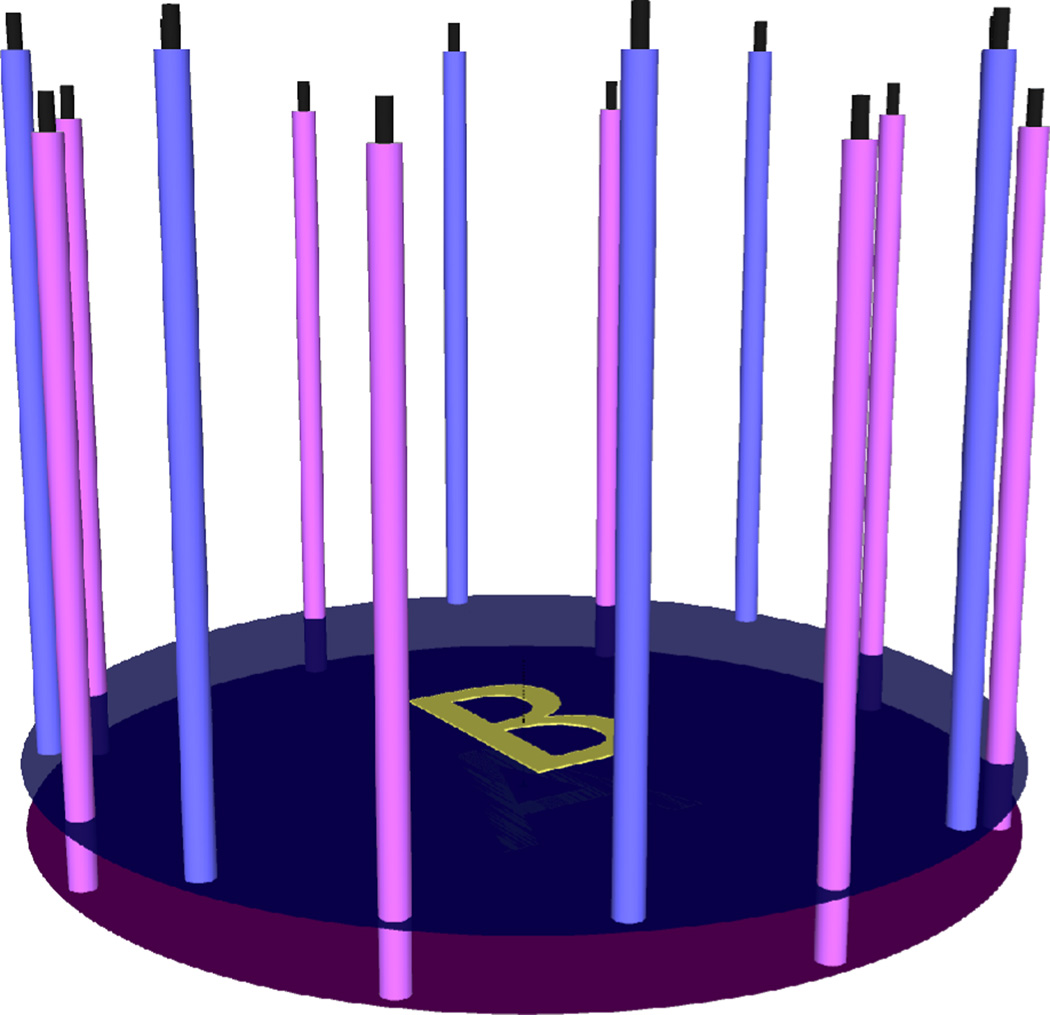
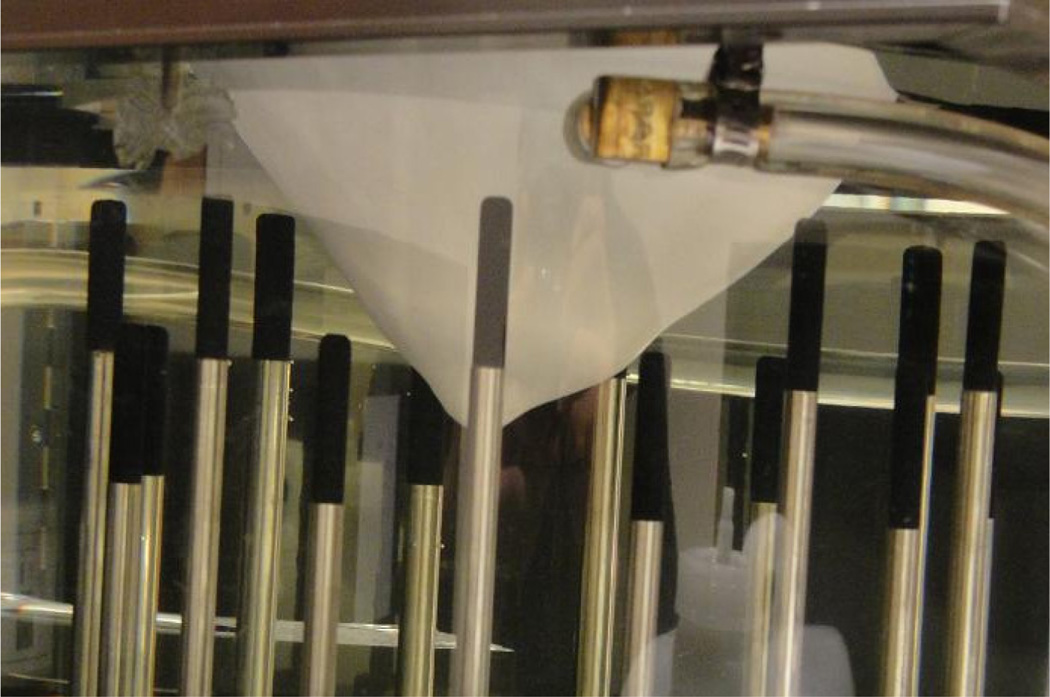
Figure 2 shows a photograph of our clinical microwave imaging system located at the Advanced Imaging Center at Dartmouth Hitchcock Medical Center (DHMC). The imaging array consists of 16 monopole antennas positioned on a 15.2 cm diameter circle. They are placed on one of the two independently–moving plates, A or B, as shown in Figure 3. This configuration enables us to collect both in–plane (i.e. when all antennas are at the same height) and cross–plane (i.e. when antennas are at different heights) data. The operating frequency ranges from 500 MHz to 3.0 GHz. At any given antenna position, while one antenna transmits the signal, the other 15 act as receivers. Therefore, if NP different antenna positions are used during data acquisition, a total of NP × 240 (NP combinations × 16 transmitters × 15 receivers) measurements of the electromagnetic field are obtained at each frequency. All or selected portion of the measured data can be used in the image reconstruction process.
Figure 2.
Microwave imaging system located at the Advanced Imaging Center at Dartmouth Hitchcock Medical Center (DHMC)
Figure 3.
Antenna configuration: 16 monopole antennas positioned on a 15.2 cm diameter circle. Each antenna is placed on one of the two independently–moving plates A or B.
III. Results
In the current study, we evaluate the 3D reconstructed microwave images using both in–plane and cross–plane data relative to 2D reconstructed images with only in–plane data in a breast–shaped phantom experiment.
A. Phantom Experiment Configuration
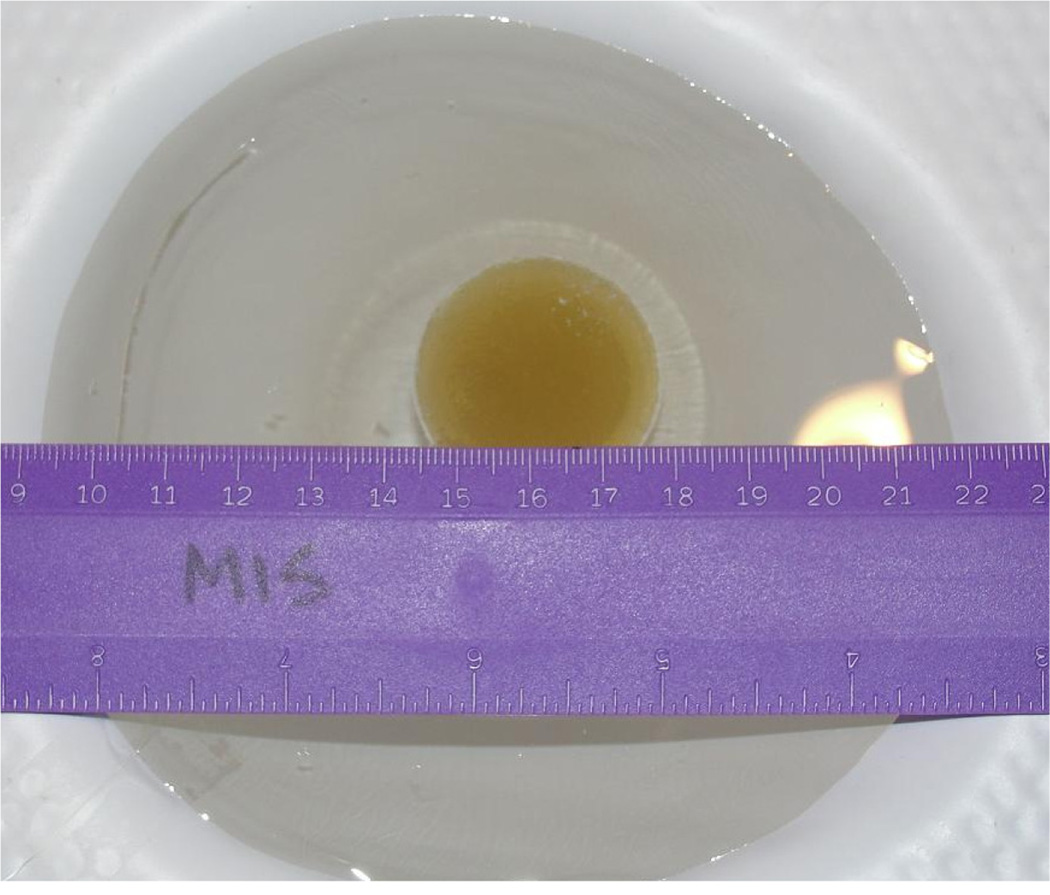
In order to conduct a real breast–shaped phantom experiment, MR scans of a real breast was used to create a breast mold, which was then used to make the rapid–prototyped plastic breast model in figure 4. The breast model was filled with an 88:12 mixture of glycerin: water (to mimic the dielectric properties of a scattered breast) and was submerged in a matching liquid (in a prone position), composed of an 80:20 mixture of glycerin and water. A spherical target inclusion made from a saline gel was suspended in the breast phantom, as shown in figure 5. The exact dielectric properties of the coupling medium, breast model, and the target inclusion at 1300 MHz are reported in Table 1.
Figure 4.
Rapid–prototyped plastic breast model
Figure 5.
The spherical saline gel target inclusion suspended in the plastic breast model
Table 1.
The exact dielectric properties of the coupling medium, breast model, and the target inclusion at 1300 MHz
| Background Medium |
Breast | Target Inclusion |
|
|---|---|---|---|
| Permittivity | 22.3 | 15.1 | 68 |
| Conductivity | 1.32 | 1.01 | 1.80 |
In the present phantom experiment, 3D microwave data was acquired at multiple planes. More specifically, antennas on plates A and B in figure 3 transmitted and received the signal at 9 equally–spaced (1 cm) vertical positions, and as a result, 9 × 9 × 240 measurements were collected in total at each frequency. In order to evaluate the 2D versus 3D microwave imaging, selective data was used to reconstruct images both in 2D and 3D. In 2D reconstruction, only in–plane data (with all 16 antennas at the same height) containing 9 × 240 measurements was used, whereas in 3D reconstruction, both in–plane and cross–plane data from 3 consecutive planes (except for the first and last one where there are only 2 consecutive planes), with a total number of ((9 × 3) − 2) × 240 measurements, were used.
B. Phantom Experiment Results
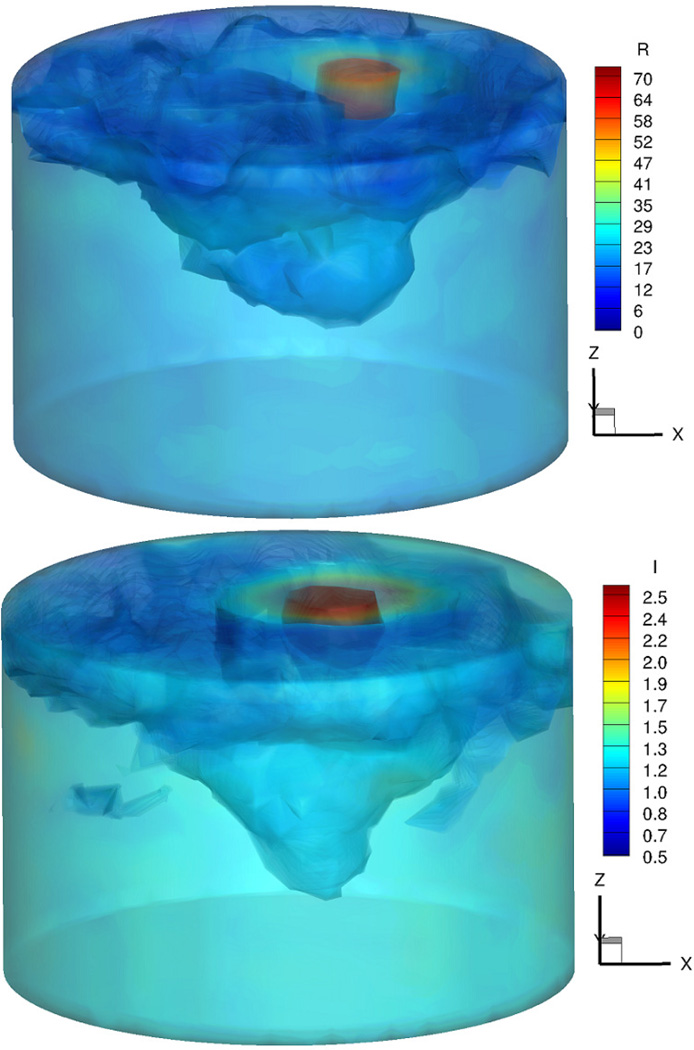
Figure 6 shows the 3D iso–surface of the reconstructed permittivity (top) and conductivity (bottom) images at 1300 MHz.
Figure 6.
3D iso–surface of the reconstructed permittivity (top) and conductivity (bottom) images at 1300 MHz
The target inclusion as well as the breast region is clearly detected in both permittivity and conductivity images. Moreover, they are very accurate, not only in terms of the location, but also in terms of the recovered dielectric properties. In order to compare the 3D reconstructed images with those reconstructed in 2D, 9 slices from the 3D volume in figure 6 were extracted and are shown in figure 7. Similarly, figure 8 shows the 2D reconstructed dielectric properties at 9 equally–spaced (1 cm) vertical positions. In both figurs, the images in the top row correspond to permittivity, whereas those in the bottom row represent the recovered conductivity values.
Figure 7.
Extracted slices from the 3D reconstructed images in figure 6: Permittivity (top row) and conductivity (bottom row).
Figure 8.
2D reconstructed dielectric properties: Permittivity (top row) and conductivity (bottom row).
Similar to the 3D reconstructed images in figure 7, the breast as well as the target inclusion is successfully detected in 2D images in figure 8. Nonetheless, the level of artifacts, especially in the background region, is significantly increased in the 2D reconstructed images. This effect is even more pronounced in the corresponding conductivity images. Since the diameter of the spherical target inclusion was about 3 cm, it only appears in the first 3 planes from the top of the breast model (z = 4, 3, and 2 cm) in figure 7 and 8. In addition, as the reconstructed planes move toward the nipple (i.e. z decreases), the outline of the breast model becomes smaller and finally vanishes at about z = −2 cm.
IV. Conclusions
We have evaluated 2D and 3D microwave imaging in a breast–shaped phantom experiment. The results indicate that despite the increased computational complexity, 3D microwave imaging can significantly improve the accuracy and quality of 2D reconstructed images. This improvement is partly due to the increased number of measurements in 3D data acquisition process, and also due to the fact that the propagation of the electromagnetic field through the tissue is a 3–dimensional phenomenon. With a viable 3D image reconstruction algorithm, we are able to take advantage of 3D microwave imaging and reconstruct more accurate images in a reasonable time frame.
Acknowledgments
This work was supported in part by the NIH/NCI under Grant R33 CA102938-04.
Contributor Information
Amir H. Golnabi, Thayer School of Engineering at Dartmouth College, NH 03755 USA (phone: 603-646-2685; Amir.H.Golnabi@Dartmouth.edu).
Paul M. Meaney, Thayer School of Engineering at Dartmouth College, NH 03755 USA (Paul.Meaney@Dartmouth.edu).
Neil R. Epstein, Thayer School of Engineering at Dartmouth College, NH 03755 USA (Neil.R.Epstein@Dartmouth.edu).
Keith D. Paulsen, Thayer School of Engineering at Dartmouth College, NH 03755 USA (Keith.Paulsen@Dartmouth.edu).
References
- 1.Chaudhary SS, Mishra RK, Swarup A, Thomas JM. Dielectric properties of normal & malignant human breast tissues at radiowave & microwave frequencies. Indian J Biochem Biophys. 1984 Feb;vol. 21(no. 1):76–79. [PubMed] [Google Scholar]
- 2.Joines WT, Zhang Y, Li C, Jirtle RL. The measured electrical properties of normal and malignant human tissues from 50 to 900 MHz. Med Phys. 1994 Apr;vol. 21(no. 4):547–550. doi: 10.1118/1.597312. [DOI] [PubMed] [Google Scholar]
- 3.Taflove A, Hagness SC. Computational electrodynamics: the finite–difference time–domain method. Boston: Artech House; 2005. [Google Scholar]
- 4.Meaney PM, Fang Q, Rubaek T, Demidenko E, Paulsen KD. Log transformation benefits parameter estimation in microwave tomographic imaging. Med Phys. 2007 Jun;vol. 34(no. 6):2014–2023. doi: 10.1118/1.2737264. [DOI] [PubMed] [Google Scholar]
- 5.Meaney PM, Paulsen KD, Pogue BW, Miga MI. Microwave image reconstruction utilizing log–magnitude and unwrapped phase to improve high–contrast object recovery. Ieee T Med Imaging. 2001 Feb;vol. 20(no. 2):104–116. doi: 10.1109/42.913177. [DOI] [PubMed] [Google Scholar]
- 6.Fang Q. Book Computational methods for microwave medical imaging vol. PhD. City: Dartmouth College; 2004. Computational methods for microwave medical imaging. Series Computational methods for microwave medical imaging Editor ed.^eds. [Google Scholar]
- 7.Kelley CT. Iterative methods for linear and nonlinear equations. Philadelphia: Society for Industrial and Applied Mathematics; 1995. [Google Scholar]
- 8.Liauh CT, Hills RG, Roemer RB. Comparison of the adjoint and influence coefficient methods for solving the inverse hyperthermia problem. J Biomech Eng. 1993 Feb;vol. 115(no. 1):63–71. doi: 10.1115/1.2895472. [DOI] [PubMed] [Google Scholar]
- 9.Fang Q, Meaney PM, Paulsen KD. Viable Three–Dimensional Medical Microwave Tomography: Theory and Numerical Experiments. IEEE Trans Antennas Propag. 2010 Feb 1;vol. 58(no. 2):449–458. doi: 10.1109/TAP.2009.2037691. [DOI] [PMC free article] [PubMed] [Google Scholar]
- 10.Paulsen KD, Meaney PM, Moskowitz MJ, Sullivan JR. A dual mesh scheme for finite element based reconstruction algorithms. IEEE Trans Med Imaging. 1995;vol. 14(no. 3):504–514. doi: 10.1109/42.414616. [DOI] [PubMed] [Google Scholar]


