Abstract
The role of regulatory T cells (Tregs) is well documented in immune homeostasis and protection against autoimmune disease. Forkhead box protein 3 (FOXP3) has been shown be essential for the development and function of Treg. Due to the lack of tools for FOXP3 detection in certain species, understanding the role of Treg in a variety of ruminant diseases has been hampered. In this study, we developed monoclonal antibodies (mAbs) against bovine FOXP3 using recombinant bovine FOXP3 lacking the forkhead domain as an immunogen. The specificity of the mAbs was confirmed by immunoblot and mass spectrometry. Expression of FOXP3 was induced in bovine PBMCs after 6 d of exposure to staphylococcal enterotoxin type C1 (SEC1) in vitro. Similar to findings in mice and humans, expression of FOXP3 was restricted to CD4+ CD25+ T cells. Transcriptional analysis of bovine TCR variable regions of the β chain (boVβ) showed that transcription of boVβ sequences reactive with SEC1 increased for 6 d, and then boVβ sequences non-reactive with SEC1 rapidly increased in the cultures. This indicates that induction of FOXP3+ CD4+ CD25+ Tregs by SEC1 is not Vβ restricted. The FOXP3 mAbs developed in this study will be useful in the further investigation of the role of Treg in staphylococcal pathogenesis in bovine mastitis and other ruminant diseases.
Keywords: Superantigen, TCR Vβ, Treg, bovine FOXP3, staphylococcal
1. Introduction
Immunological tolerance, resulting from combined peripheral and central mechanisms helps prevent responses to self-antigens and maintains immune homeostasis. Centrally-derived tolerance occurs in the thymus and involves clonal deletion of self-reactive thymocytes by negative selection (Nossal, 1994). Peripheral tolerance is achieved by activation induced cell death, anergy, and suppression (Green et al., 2003; Jenkins and Schwartz, 1987; von Boehmer, 2005). Recently, considerable progress has been made towards understanding suppressive mechanisms mediated by a T cell subset designated regulatory T cells (Treg) (Sakaguchi, 2000; Shevach, 2002). Numerous murine and human studies have demonstrated that defects in Treg function are associated with the occurrence of various immune dysfunctions including autoimmune diseases, allergies, arthritis, and graft rejection (Sakaguchi, 2004; Sakaguchi et al., 1982). CD4+ CD25+Treg are characterized by the constitutive expression of CD25 as well as a transcriptional factor, forkhead box protein 3 (FOXP3), a member of the family of transcriptional factors (Fontenot and Rudensky, 2005). The importance of FOXP3 in the development and function of Treg is highlighted by studies showing that mutations in foxp3 results in autoimmune disorders (Bennett et al., 2001; Brunkow et al., 2001). Also, additional studies have shown the introduction of foxp3 into naïve CD4+ CD25− T cells with a retroviral vector changes the naïve cells into Treg (Hori et al., 2003). Although studies in humans demonstrated that expression of FOXP3 is not confined to CD4+CD25+ T cells (Morgan et al., 2005), FOXP3 is generally accepted as a critical marker for Treg due to its functional properties as described above.
Staphylococcal enterotoxins (SEs) are prototypic microbial superantigens (SAgs) and are expressed by a high percentage of bovine mastitis Staphylococcus aureus isolates (Smyth et al., 2005). Evidence from studies in other animals suggests that Treg are induced by exposure to SAgs (Sundstedt et al., 1997; Zheng et al., 2002). Recently, we assessed the effects of exposing bovine PBMCs to a physiologically relevant dose of SE type C1 (SEC1) for 10 d (Seo et al., 2007). The toxin initially caused proliferation of CD4+ and CD8+ T cells at similar rates. However, evidence suggested that, in prolonged cultures, most T cell proliferation occurred independently of the bovine TCR Vβ (boVβ) sequences. Expression of CD25 and cytotoxic T lymphocyte antigen-4 (CTLA-4) genes increased concurrently with a decrease in expression of IL-2. An up-regulation of IL-10 and TGF-β gene transcription occurred in the CD4+CD25+ T cell subpopulation. This population of CD4+ T cells suppressed the proliferation of naïve PBMCs in response to heat-killed-fixed S. aureus via a mechanism that depended upon IL-10 and TGF-β. The results indicated that SEC1 induces development of Treg cells in bovines. However, complete verification that these cells were Treg cells was not possible because no mAbs were available to demonstrate the presence of the FOXP3 protein. Therefore the goal of this study was to develop and characterize one or more mAbs for this purpose.
2. Materials and Methods
2.1. Preparation of recombinant bovine FOXP3 protein
cDNA was generated by reverse transcription of mRNA from SEC1-stimulated PBMC as described below and used as a template for PCR amplification of the bovine FOXP3 gene. A DNA fragment encoding full-length recombinant bovine FOXP3 (FOXP3-R) was amplified using primer set, FOXP3A (Table 1). A DNA fragment encoding FOXP3-R lacking the forkhead domain (FOXP3-RΔ) was amplified using primer set FOXP3B (Table 1). Amplified DNA fragments were digested with NdeI and BamHI restriction enzymes and ligated into corresponding sites in pET-15b (Novagen, San Diego, CA). Recombinant proteins were expressed in E. coli BL21 (DE3) (pLysS) (Novagen) and purified using the His Bind Purification Kit (Novagen) as suggested by the manufacturer.
Table 1.
Primers used in this study.
| Gene product |
GenBank accession no. |
Forward primer | Reverse primer |
|---|---|---|---|
| FOXP3A | DQ322170 | GCGCCATATGCCCAACCCAAGGCCA | GCGCGGATCCGGCATGTCCAGGGCTGGT |
| FOXP3B | DQ322170 | GCGCCATATGCCCAACCCAAGGCCA | GCGCGGATCCTTACATGTTGTGGAACTTGAA |
| BTB13 | D90132 | TCGAGATGAGTTGGAACATTTCC | CTGGCACAGAAGTACACAGATGTCT |
| BTB18 | D90130 | GCTGAACTTGAGCTCCTTGGA | ACAGAGGGTCGAGTGATCTTTCTT |
| BTB35 | D90127 | CGGCTGCTCCATTTCTCAAT | CTTCTTCTTTCTGGAGACGCTGTA |
| BTB93 | D90124 | TCGTCTCTCAAAAGCCAAGCA | CGACCTGACACTCGATCATCA |
| β-actin | AY141970 | GGCCGAGCGGAAATCG | GCCATCTCCTGCTCGAAGTC |
2.2. mAb production
BALB/c mice were immunized subcutaneously with 100 µg of purified FOXP3-RΔ protein emulsified in complete Freund's adjuvant, then twice (15 d intervals) with antigen in incomplete Freund's adjuvant, followed by a third intravenous boost 10 d later. Levels of FOXP3-RΔ-reactive antibody were determined by ELISA (Kwong et al., 2002). Spleens were harvested 3 d later. Approximately 108 spleen cells were fused with 4.5× 107 X63-Ag8.653 myeloma cells (Kearney et al., 1979); (Hamilton and Davis, 1995) and cultured in24-well plates. After culturing for 8 d, single-cell clones were selected and then supernatants were tested for antibodies to FOXP3-R protein by ELISA. Three clones showing highest ELISA results were selected, cloned by limiting dilution, used to generate ascites, and analyzed in this study.
2.3. PBMC cultures, SEC1 stimulation, and preparation of whole cell lysates
Blood was obtained from adult Holstein-Frisian steers by venipuncture. PBMCs were isolated by density gradient centrifugation using Ficoll-Hypaque (Pharmacia Biotechnology, Uppsala, Sweden) and cultured for up to 10 d in the presence of SEC1 (5 ng/ml) as described previously (Seo et al., 2007). Whole cell lysates from SEC1-stimulated PBMCs were prepared using lysis buffer [7 M urea (Bio-Rad laboratories, Hercules, CA), 2 M thiourea (Bio-Rad laboratories), 2% ASB-14 (Sigma, St. Louis, MO), 0.5% Triton X-100 (Sigma), 2 mM tributylphosphine (Bio-Rad), and 0.1% bromophenol blue], followed by protein inhibitor cocktail for 5 min on ice and nuclease treatment (GE Healthcare) for 15 min at room temperature. Whole cell lysates lysates were clarified by centrifugation (45,000 g; 30 min), then supernatants were analyzed by SDS-PAGE and immunoblots.
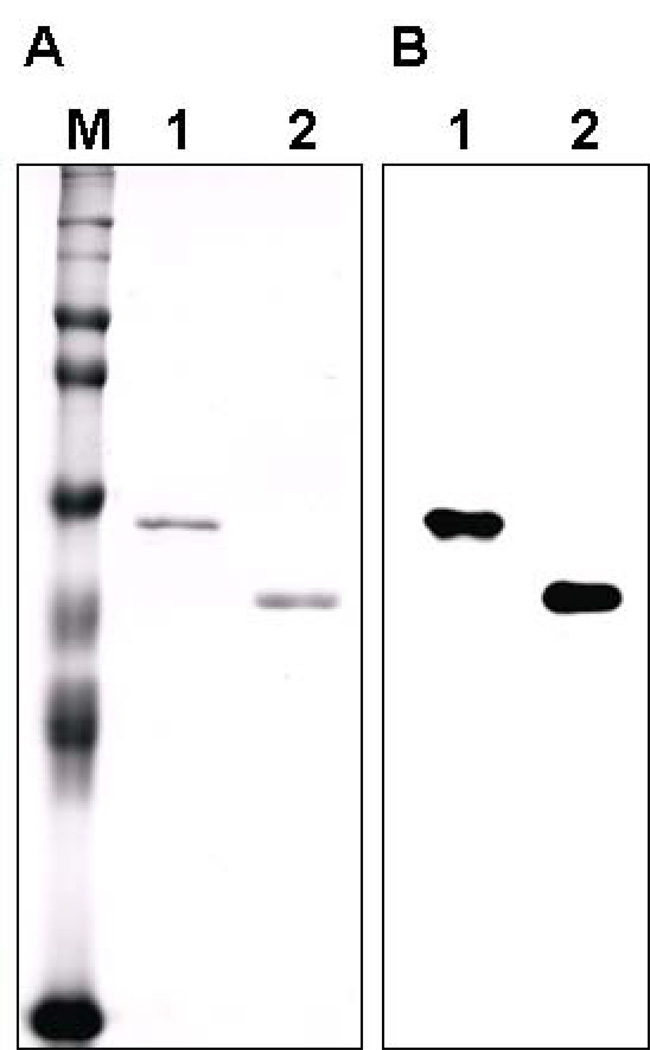
FOXP3-R and FOXP3-RΔ proteins (Fig. 1A) and cell lysates from SEC1-stimulated PBMC cultures (Fig. 2A) were separated by SDS-PAGE (10.5% acrylamide) in duplicate. Proteins in one gel were stained with Coomassie blue G-250 and those in the other were transferred to PVDF membranes for immunoblotting. After blocking with 2% skim milk in Tween-Tris buffered saline [TTBS: 20 mM Tris-HCl (pH 7.4), 150 mM NaCl, 0.05 % Tween 20] (2 h), membranes were incubated with a mAb to FOXP3-RΔ (see above; 1:500,000) in TTBS (2 h). Membranes were washed and incubated with peroxidase-conjugated anti-mouse IgG (1:5000; GE Healthcare) in TTBS (1 h). Chemiluminescence detection was conducted with a kit (Pierce, Rockford, IL). To ensure that equal amount of protein samples were loaded, membrane was stripped, re-probed with rabbit-anti-bovine β actin, and visualized as described above using peroxidase-conjugated anti-rabbit IgG (1:5000; GE Healthcare) in TTBS (1 h).
Fig. 1.
SDS-PAGE of recombinant bovine FOXP3 proteins and immunoblot analysis using Fox20A mAb. Recombinant full length of bovine FOXP3 (FOXP3-R) and recombinant bovine FOXP3 lacking forkhead domain (FOXP3-RΔ) proteins were purified, resolved by SDS-PAGE and stained with Coomassie Blue (A) or transferred to membranes and probed with FOX20A mAb(B). Lane M, prestained markers (Invitrogen); Lane1, FOXP3-R; Lane2, FOXP3-RΔ.
Fig. 2.
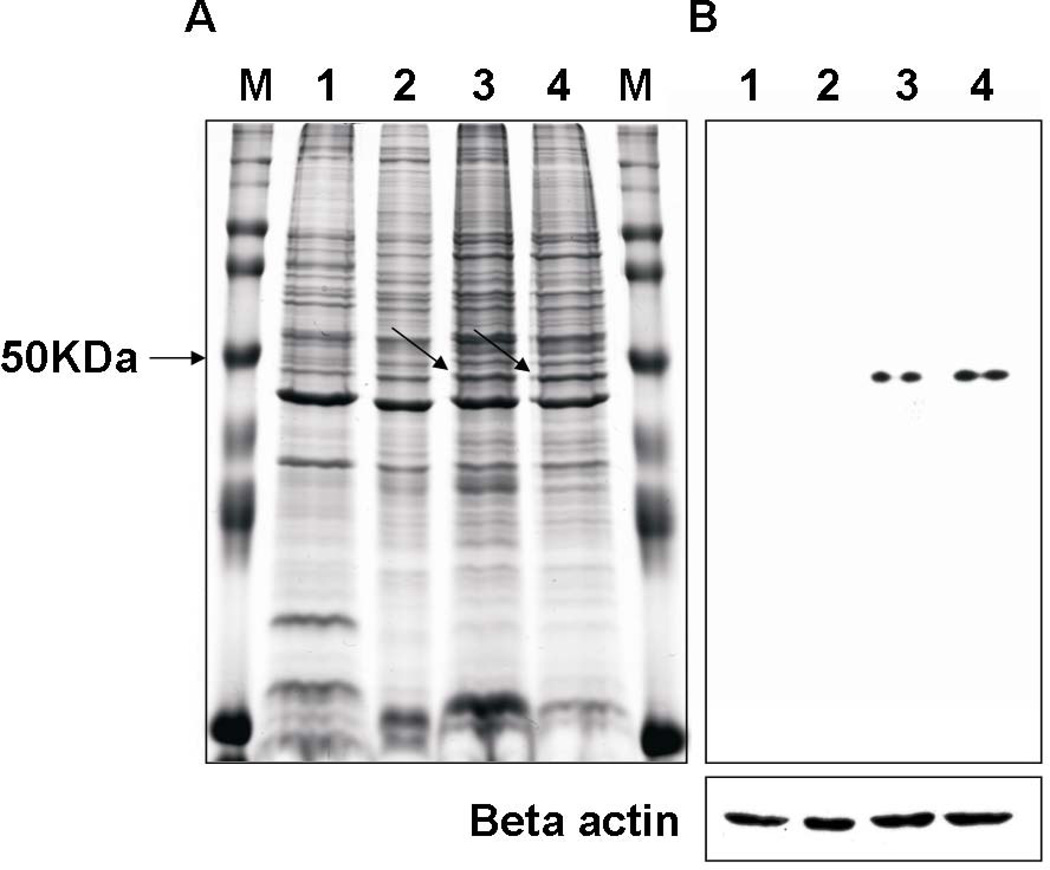
SDS-PAGE and immunoblot analysis of cell lysates from SEC1-stimulated bovine PBMCs. Bovine PBMCs were exposed to SEC1 (5 ng/ml) for up to 8 d. PBMCs were harvested at 2, 4, 6, or 8 d of culture. Cell lysates were resolved by SDS-PAGE and stained with Coomassie Blue (A) or transferred to membranes and probed with FOX20A mAb (B). panel A, arrows indicate location of bands corresponding to the bands detected in immunoblots (panel B). Lane M, prestained markers (Invitrogen); Lane1, 2, 3, and 4 represent lysates from days 2, 4, 6, and 8, respectively. To ensure equal sample loading, membranes were stripped and reprobed with an anti-beta actin mAb (Beta actin panel).
In some experiments, PBMC lysates were analyzed by 2-dimensional gel electrophoresis (2-DE). Two IPG strips (Immobiline™ Drystrip gels, pH 3–11 non-linear, GE Healthcare) were rehydrated with PBMC lysate supplemented with 2% IPG-buffer (GE Healthcare) for 24 h. Isoelectric focusing (1st dimension) was performed using a Multiphor II unit (GE Healthcare) in three running phases: phase 1; 300 V/0.01 h, phase 2; 3500 V/1.50 h, and phase 3; 3500 V/4.50 h. SDS-PAGE (2nd dimension) was conducted in 12.5% acrylamide gels. One gel was stained with Coomassie blue G 250 (Bio-Rad, Hercules, CA) and used for mass spectrometry (MS) (see below). The other was used for immuno-blotting as described above.
2.4. Mass spectrometry (MS) analysis
Spots from Coomassie-stained 2-DE gels were excised and digested with trypsin (Worthington, Lakewood, NJ) (Shevchenko et al., 2002). Resulting peptides were analyzed by matrix-assisted laser desorption ionization (MALDI) and nanoelectronspray LC-MS/MS using a Nanoacquity Ultra Performance Liquid Chromatograph (Waters, Milford, MA). Peptide sequencing data were generated using a Quadrupole-TOF Premier mass spectrometer equipped with a Nano-ESI source (Waters). Spectra were analyzed by the Mascot search engine using the Swiss protein database (David N. Perkins, 1999).
2.5. Flow cytometry
PBMCs were incubated (4 °C, 30 min) with CD4 (ILA11A, IgG2a) and CD25 (CACT116A, IgG1) mAbs, acquired from Washington State Monoclonal Antibody center, then washed with PBS, and incubated (4 °C; 30 min) in the dark with phycoerythrin-conjugated goat-anti-mouse IgG2a and allophycocyanin-conjugated anti-mouse-IgG1 (Invitrogen). After fixation in 2 % PBS buffered formaldehyde, cells were permeablized with Fix/Perm buffer (eBioscience, San Diego, CA), incubated with an anti-FOXP3-RΔ mAb (FOX20A; see below), washed, and incubated with fluorescein-conjugated goat-anti mouse-IgG2b (Invitrogen). Data were acquired with a FACSAria (BD Immunocytometry Systems, San Jose, CA) and analyzed with FlowJo software (Tristar, Eugene, OR)
2.6. Quantitative real time PCR (QRT-PCR)
RNA was extracted from 5 × 10⁶ SEC1-stimulated PBMCs using Trizol reagent (Life Technologies, Gaithersburg, MD). First-strand cDNA was generated from RNA (1 µg) using Superscript II reverse transcriptase (Life Technologies) and oligo dT primers (Life Technologies, Gaithersburg, MD) as recommended by the manufacturer. QRT-PCR primers (Table 1) for bBoVβ sequences were designed based on published sequences (Tanaka et al., 1990). QRT-PCR was performed using the SYBR Green I dye master mix and an ABI Prism 7500 Real Time PCR System (PE Applied Biosystems, Foster City, CA). The threshold cycle (CT) was calculated using Sequence Detector Systems software version 1.2.2 (PE Applied Biosystems) and data were normalized by calculating ΔCT [CT of target - CT of the internal control (β-actin gene)]. Normalized ΔCT data were used for relative quantification by calculating ΔΔCT [ΔCT of SEC1-stimulated PBMC - ΔCT of unstimulated PBMC] to compare normalized ΔCT data from SEC1 stimulated PBMC with data from unstimulated cells (Day 0).
3. Results
3.1. mAbs generated against FOXP3-RΔ detect native FOXP3 induced by SEC1
Since the forkhead domain is conserved throughout the forkhead box family (Hori and Sakaguchi, 2004), FOXP3-RΔ was produced (Fig. 1A) and used for mAb production. Three clones (FOX5A, IgG1; FOX9A, IgM, FOX20A, IgG2b), each showing strong reactivity with FOXP3-R, were obtained and tested for their reactivity. Since all of them exhibited similar reactivity, only representative results acquired with (FOX20A, IgG2b) are shown in this report. To test reactivity of mAbs to bovine FOXP3, FOXP3-R and FOXP3-RΔ proteins were separated by SDS-PAGE and stained with Coomassie blue G250 (Fig. 1A) or analyzed by immunoblot (Fig 1B). As shown in Fig. 1B, Fox20A mAb reacted with both FOXP3-R and FOXP3-RΔ in immunoblot which corresponded to the recombinant proteins Coomassie blue-stained gel. To ensure that the Fox20A mAb did not react with His tag, immunoblot using his-tagged CTLA-4 protein was performed and did not show any reactivity (data not shown).
Previously we showed that SEC1 induces expression of the foxp3 gene and other Treg markers (Seo et al., 2007). However, the lack of bovine FOXP3 mAbs precluded our ability to verify that the SEC1-stimulated CD4+CD25+ T cells were phenotypically identical Treg in other species. To test whether the conditions used in that study induce expression FOXP3, bovine PBMCs were exposed to SEC1 up to 8 d and cell lysates were analyzed immunoblot using FOX20A mAb. As shown in Fig. 2B, a single band was detected by immunoblots from samples prepared after 6 d of SEC1 exposure. The protein identified corresponded to a molecular mass of 47 KDa in Coomassie blue-stained gels (Fig. 2A), consistent with the predicted size of bovine FOXP3 (Seo et al., 2007).
3.2 Verification of FOXP3 expression by 2-DE and MS
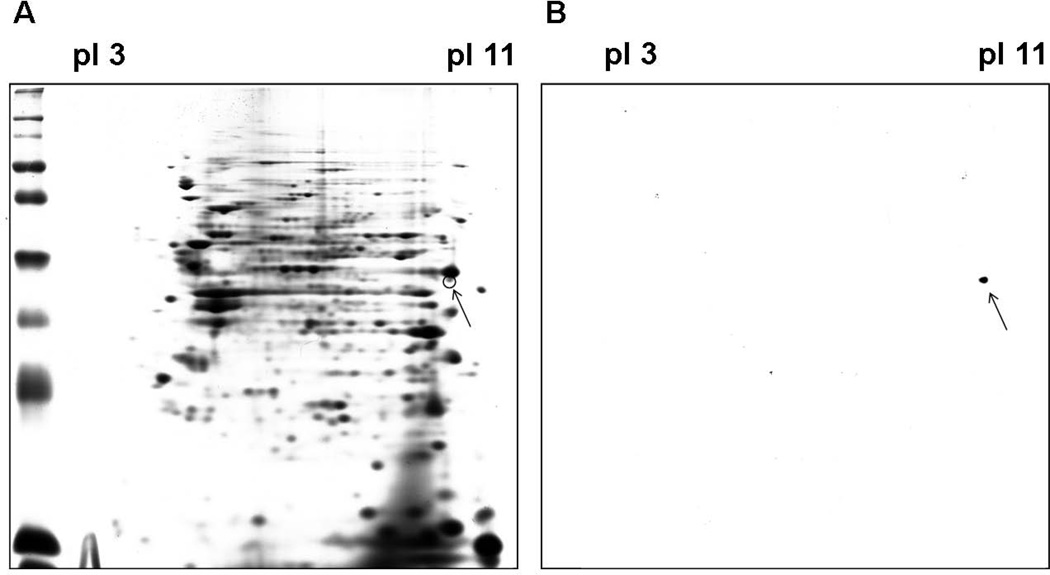
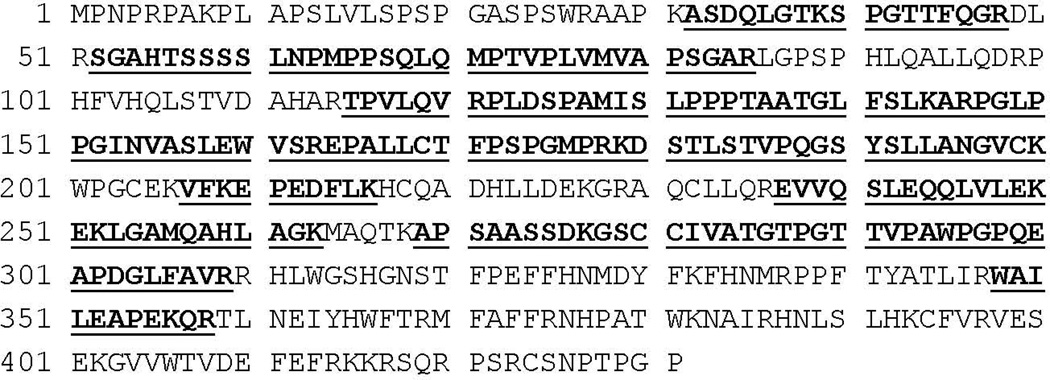
To verify the identity of the protein reacting with the Fox20A mAb in Fig. 2, PBMC lysates stimulated with SEC1 for 8 d were further analyzed by immunoblot in 2-DE, followed by MS. As shown in figure 3B, one immunoreactive dot (pI~10, molecular mass~48 KDa) was observed. This region was excised from a Coomassie blue-stained gel (Fig. 3A) and analyzed by MS. The eleven sequences obtained by MS matched sequences predicted by bioinformatic analysis of bovine FOXP3 (Fig. 4) generating a MALDI score 1032, confirming that FOX20A recognizes native bovine FOXP3.
Fig. 3.
Two-DE and immunoblot analysis of SEC1-stimulated bovine PBMCs. Cell lysates from bovine PBMCs cultured with SEC1 for 8 d were resolved by 2-DE in duplicate. One gel was stained with Coomassie Blue (A) and the other was transferred to a PVDF membrane and probed with the FOXP20A mAb (B). Arrows indicate the corresponding spot in both gels.
Fig. 4.
Mass spectrometry analysis of 2-DE spot identified Fox20A mAb. A protein spot in Coomassie stained 2-DE gel, corresponding to the spot identified in immunoblots using the Fox20A mAb, was excised, digested with trysin, and analyzed by mass spectrometry. The complete deduced amino acid sequence of bovine FOXP3 based on mRNA sequence we reported in previous studies is indicated (UniProtKB/TrEMBL access number: Q2LEZ0). Peptides detected by MS analysis which matched bovine FOXP3 are indicated in bold and by underlining.
3.3. Expression of bovine FOXP3 in SEC1-stimulated bovine CD4+ CD25+ T cells
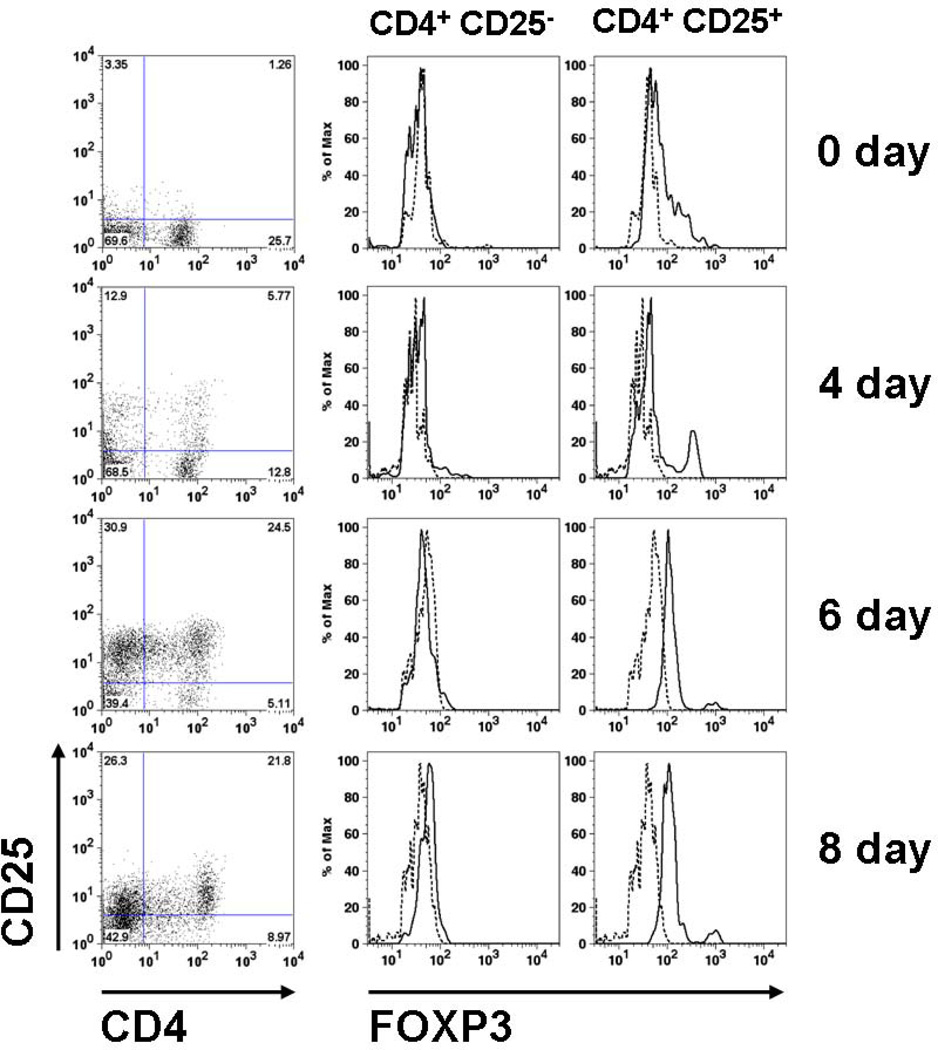
To investigate expression of bovine FOXP3 in SEC1-stimulated CD4+ T cell subpopulations, SEC1-stimilated PBMCs were probed with mAbs for CD4, CD25, and FOXP3 and analyzed by FC. Consistent with our previous transcriptional analysis showing upregulation of foxp3 in SEC1-stimulated CD4+ T cell subpopulations, expression of FOXP3 was restricted to CD4+ CD25+ T cells, similar to that observed in rodents (Hori al., 2003). As in other species, naïve CD4+ CD25+ T cells (day 0) also expressed FOXP3 and appeared to represent naturally occurring bovine Treg (Fig. 5). Expression of FOXP3 in SEC1-stimulated CD4+ CD25+ T cells gradually increased in frequency after 6 d of stimulation with SEC1, while that of CD4+ CD25− T cells remained negative (Fig. 5).
Fig. 5.
Flow cytometric analysis of FOXP3 expression. Bovine PBMCs stimulated with SEC1 up to 8 d were analyzed by triple labeling for CD4, CD25, and FOXP3. Dot plots showed expression of CD4 and/or CD25 following exposure to SEC1. CD4+ CD25− (upper left corner) or CD4+ CD25+ T cells (upper right corner) were gated to monitor the expression of FOXP3 in these subpopulations. The histogram shows expression of FOXP3 gated in CD4+ CD25− or CD4+ CD25+ T cells (Dotted lines: isotype control; solid lines: results using Fox20A mAb). Data shown are from a single representative experiment which was conducted three times.
3.4. Relation between SAg boVβ specificity and FOXP3 expression
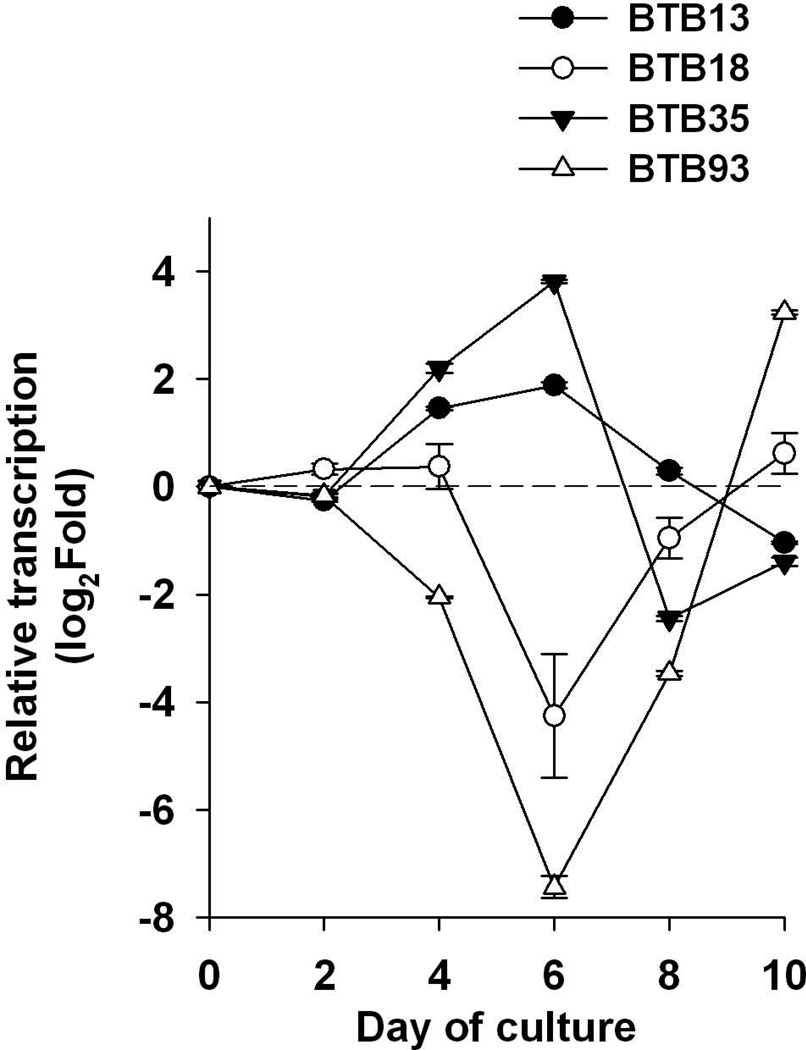
We previously demonstrated that the proliferative response to SEC1 during the first 4 d of exposure restricted to T cells expressing certain boVβ sequences, designated boVβ-BTB13 and boVβ-BTB35 (Deringer et al., 1997). Our more recent studies suggested that proliferation beyond 4 d is boVβ-independent (Seo et al., 2007). This prompted us to investigate whether expression of FOXP3 late in cultures is also associated with boVβ-independent proliferation. As shown in Fig. 6, transcription of SEC1-reactive boVβ T cells expressing boVβ -BTB13 and boVβ-BTB35 gradually increased until 6d and then decreased thereafter. contrast, SEC1-nonreactive boVβ (boVβ -BTB18 and boVβ -BTB93) gradually decreased until 6d, and then rapidly increased.
Fig. 6.
Transcription of bovine T cell boVβs in SEC1-stimulated bovine PBMCs. Bovine PBMCs were exposed to SEC1 for up to 10 d and transcriptional changes in bovine T cell boVβs genes were examined at different time points by QRT-PCR. Relative transcription at each time point was compared to data acquired before exposure to SEC1. Results represent the means ± SEM of data from three separate experiments (n=9).
4. Discussion
Although studies in several ruminant diseases such as Mycobacterium bovis and M. paratuberculosis (Madura Larsen et al., 2007; Weiss et al., 2006) suggested the presence of Treg, based on T cell cytokine profiles (IL-10+, TGF-β+), verification that these cells were bona fide bovine Treg cells was not been confirmed due to the lack of markers associated with Treg such as FOXP3, the glucocorticoid induced TNF receptor (GITR), and/or CTLA-4 Recently, we reported bovine cells resembling Treg were induced by a low dose of SEC1, based on transcriptional elevation of foxp3, ctla4, il10, and tgfb genes and suppressive activity of CD4+CD25+ T cells present in 10 d cultures of SEC1-stimulated PBMC. This activity was at least partially mediated by IL-10 and TGF-β (Seo et al., 2007). Since the evidence for existence of bovine Treg was indirect, this study was designed to develop FOXP3 mAbs by immunizing with FOXP3-RΔ. The reactivity of mAbs generated was confirmed by immunoblot, followed by MS. Further experiments provided additional evidence for the induction of bovine Treg by SEC1 in a manner independent of boVβ.
Initial studies in transgenic mice showed that naturally occurring CD4+ CD25+ Treg develop as a consequence of high affinity MHC-self peptide interactions (Jordan et al., 2001). These observations were made under a limited TCR repertoire background and could not explain how these cells were able to escape from negative selection in the thymus during T cell maturation.
Although not fully understood, several reports have demonstrated the importance of T cell stimuli, as well as TGF-β and IL-10 in the development of Treg. Evidence suggests that Treg can be induced by suboptimal stimulation and/or co-stimulation with CD28/B7-1 (Bour-Jordan et al., 2004; Chatenoud et al., 1994; Sun et al., 2006; Vieira et al., 2004). Regarding SAgs, Zheng et al. demonstrated that the stimulation of naïve CD25− T cells with a low dose of SEB and TGF-β upregulates CD25, FOXP3, and CTLA-4 and induces suppressive activity (Zheng et al., 2002). Sundstedt et al. demonstrated repeated challenge with SEA induces the development of an IL-10-producing Tr1, which suppresses IFN-γ and TNF production (Sundstedt et al., 1997). Other investigators observed that conversion of naïve CD25− T cells into Treg was induced through suboptimal activation of dendritic cells with a low concentration of antigen (Kretschmer et al., 2005). Similar to suboptimal antigenic stimulation, Tregs in this study, were induced by a low dose of SEC1 (5 ng/ml) sufficient to cause only 50% maximum T cell proliferation.
Our previous studies showed that virtually all CD4+ T cells proliferated by 8 following stimulation with SEC1 (Seo et al., 2007). As shown here, transcriptional analysis demonstrated that proliferation was boVβ dependent until ~6 d. Thereafter, and simultaneous with bovine FOXP3 expression, proliferation became boVβ-independent. Since mAbs specific for boVβ sequences are not yet available, it is not possible to conclusively establish whether CD4+ T cell proliferation after 6 d is attributable primarily to cells bearing non-reactive boVβs, to activation induced cell death of CD4+ T cells bearing reactive boVβ sequences, or both. However, the results suggest that CD4+ T cells bearing non-reactive boVβ sequences actively proliferate in cultures maintained longer than 6 d and that it is these cells that develop into FOXP3+ CD4+ CD25+ Treg.
The FOXP3 mAbs developed in this study will be useful in the further characterization of Tregs and study of their role in bovine mastitis and other ruminant diseases.
Acknowledgments
This work was supported by the National Institutes of Health Grant P20 RR15587, P20 RR016454, and U54AI57141 and the Idaho Agricultural Experiment Station.
Footnotes
Publisher's Disclaimer: This is a PDF file of an unedited manuscript that has been accepted for publication. As a service to our customers we are providing this early version of the manuscript. The manuscript will undergo copyediting, typesetting, and review of the resulting proof before it is published in its final citable form. Please note that during the production process errors may be discovered which could affect the content, and all legal disclaimers that apply to the journal pertain.
References
- Bennett CL, Christie J, Ramsdell F, Brunkow ME, Ferguson PJ, Whitesell L, Kelly TE, Saulsbury FT, Chance PF, Ochs HD. The immune dysregulation, polyendocrinopathy, enteropathy, X-linked syndrome (IPEX) is caused by mutations of FOXP3. Nat. Genet. 2001;27:20–21. doi: 10.1038/83713. [DOI] [PubMed] [Google Scholar]
- Bour-Jordan H, Salomon BL, Thompson HL, Szot GL, Bernhard MR, Bluestone JA. Costimulation controls diabetes by altering the balance of pathogenic and regulatory T cells. J. Clin. Invest. 2004;114:979–987. doi: 10.1172/JCI20483. [DOI] [PMC free article] [PubMed] [Google Scholar]
- Brunkow ME, Jeffery EW, Hjerrild KA, Paeper B, Clark LB, Yasayko SA, Wilkinson JE, Galas D, Ziegler SF, Ramsdell F. Disruption of a new forkhead/winged-helix protein, scurfin, results in the fatal lymphoproliferative disorder of the scurfy mouse. Nat. Genet. 2001;27:68–73. doi: 10.1038/83784. [DOI] [PubMed] [Google Scholar]
- Chatenoud L, Thervet E, Primo J, Bach JF. Anti-CD3 antibody induces long-term remission of overt autoimmunity in nonobese diabetic mice. Proc. Natl. Acad. Sci. USA. 1994;91:123–127. doi: 10.1073/pnas.91.1.123. [DOI] [PMC free article] [PubMed] [Google Scholar]
- David N, Perkins DJCPDMCJSC. Probability-based protein identification by searching sequence databases using mass spectrometry data. Electrophoresis. 1999;20:3551–3567. doi: 10.1002/(SICI)1522-2683(19991201)20:18<3551::AID-ELPS3551>3.0.CO;2-2. [DOI] [PubMed] [Google Scholar]
- Deringer JR, Ely RJ, Monday SR, Stauffacher CV, Bohach GA. Vbeta-dependent stimulation of bovine and human T cells by host-specific staphylococcal enterotoxins. Infect. Immun. 1997;65:4048–4054. doi: 10.1128/iai.65.10.4048-4054.1997. [DOI] [PMC free article] [PubMed] [Google Scholar]
- Fontenot JD, Rudensky AY. A well adapted regulatory contrivance: regulatory T cell development and the forkhead family transcription factor Foxp3. Nat. Immunol. 2005;6:331–337. doi: 10.1038/ni1179. [DOI] [PubMed] [Google Scholar]
- Green DR, Droin N, Pinkoski M. Activation-induced cell death in T cells. Immunol. Rev. 2003;193:70–81. doi: 10.1034/j.1600-065x.2003.00051.x. [DOI] [PubMed] [Google Scholar]
- Hamilton MJ, Davis WC. Culture conditions that optimize out growth of hybridomas. Vol 45. The Humana Press Inc; 1995. pp. 17–28. [DOI] [PubMed] [Google Scholar]
- Hori S, Nomura T, Sakaguchi S. Control of regulatory T cell development by the transcription factor Foxp3. Science. 2003;299:1057–1061. [PubMed] [Google Scholar]
- Hori S, Sakaguchi S. Foxp3: a critical regulator of the development and function of regulatory T cells. Microbes Infect. 2004;6:745–751. doi: 10.1016/j.micinf.2004.02.020. [DOI] [PubMed] [Google Scholar]
- Jenkins MK, Schwartz RH. Antigen presentation by chemically modified splenocytes induces antigen-specific T cell unresponsiveness in vitro and in vivo. J. Exp. Med. 1987;165:302–319. doi: 10.1084/jem.165.2.302. [DOI] [PMC free article] [PubMed] [Google Scholar]
- Jordan MS, Boesteanu A, Reed AJ, Petrone AL, Holenbeck AE, Lerman MA, Naji A, Caton AJ. Thymic selection of CD4+CD25+ regulatory T cells induced by an agonist self-peptide. Nat. Immunol. 2001;2:301–306. doi: 10.1038/86302. [DOI] [PubMed] [Google Scholar]
- Kearney JF, Radbruch A, Liesegang B, Rajewsky K. A new mouse myeloma cell line that has lost immunoglobulin expression but permits the construction of antibody-secreting hybrid cell lines. J. Immunol. 1979;123:1548–1550. [PubMed] [Google Scholar]
- Kretschmer K, Apostolou I, Hawiger D, Khazaie K, Nussenzweig MC, von Boehmer H. Inducing and expanding regulatory T cell populations by foreign antigen. Nat. Immunol. 2005;6:1219–1227. doi: 10.1038/ni1265. [DOI] [PubMed] [Google Scholar]
- Kwong LS, Hope JC, Thom ML, Sopp P, Duggan S, Bembridge GP, Howard CJ. Development of an ELISA for bovine IL-10. Vet. Immunol. Immunopathol. 2002;85:213–223. doi: 10.1016/s0165-2427(02)00007-7. [DOI] [PubMed] [Google Scholar]
- Madura Larsen J, Benn CS, Fillie Y, van der Kleij D, Aaby P, Yazdanbakhsh M. BCG stimulated dendritic cells induce an interleukin-10 producing T-cell population with no T helper 1 or T helper 2 bias in vitro. Immunology. 2007;121:276–282. doi: 10.1111/j.1365-2567.2007.02575.x. [DOI] [PMC free article] [PubMed] [Google Scholar]
- Nossal GJ. Negative selection of lymphocytes. Cell. 1994;76:229–239. doi: 10.1016/0092-8674(94)90331-x. [DOI] [PubMed] [Google Scholar]
- Sakaguchi S. Regulatory T cells: key controllers of immunologic self-tolerance. Cell. 2000;101:455–458. doi: 10.1016/s0092-8674(00)80856-9. [DOI] [PubMed] [Google Scholar]
- Sakaguchi S. Naturally arising CD4+ regulatory t cells for immunologic self-tolerance and negative control of immune responses. Annu. Rev. Immunol. 2004;22:531–562. doi: 10.1146/annurev.immunol.21.120601.141122. [DOI] [PubMed] [Google Scholar]
- Sakaguchi S, Takahashi T, Nishizuka Y. Study on cellular events in post-thymectomy autoimmune oophoritis in mice. II. Requirement of Lyt-1 cells in normal female mice for the prevention of oophoritis. J. Exp. Med. 1982;156:1577–1586. doi: 10.1084/jem.156.6.1577. [DOI] [PMC free article] [PubMed] [Google Scholar]
- Seo KS, Lee SU, Park YH, Davis WC, Fox LK, Bohach GA. Long-term staphylococcal enterotoxin C1 exposure induces soluble factor-mediated immunosuppression by bovine CD4+ and CD8+ T cells. Infect. Immun. 2007;75:260–269. doi: 10.1128/IAI.01358-06. [DOI] [PMC free article] [PubMed] [Google Scholar]
- Shevach EM. CD4+ CD25+ suppressor T cells: more questions than answers. Nat. Rev. Immunol. 2002;2:389–400. doi: 10.1038/nri821. [DOI] [PubMed] [Google Scholar]
- Shevchenko A, Chernushevic I, Shevchenko A, Wilm M, Mann M. "De novo" sequencing of peptides recovered from in-gel digested proteins by nanoelectrospray tandem mass spectrometry. Mol. Biotechnol. 2002;20:107–118. doi: 10.1385/mb:20:1:107. [DOI] [PubMed] [Google Scholar]
- Smyth DS, Hartigan PJ, Meaney WJ, Fitzgerald JR, Deobald CF, Bohach GA, Smyth CJ. Superantigen genes encoded by the egc cluster and SaPIbov are predominant among Staphylococcus aureus isolates from cows, goats, sheep, rabbits and poultry. J. Med. Microbiol. 2005;54:401–411. doi: 10.1099/jmm.0.45863-0. [DOI] [PubMed] [Google Scholar]
- Sun JB, Raghavan S, Sjoling A, Lundin S, Holmgren J. Oral tolerance induction with antigen conjugated to cholera toxin B subunit generates both Foxp3+CD25+ and Foxp3-CD25-CD4+ regulatory T cells. J. Immunol. 2006;177:7634–7644. doi: 10.4049/jimmunol.177.11.7634. [DOI] [PubMed] [Google Scholar]
- Sundstedt A, Hoiden I, Rosendahl A, Kalland T, van Rooijen N, Dohlsten M. Immunoregulatory role of IL-10 during superantigen-induced hyporesponsiveness in vivo. J. Immunol. 1997;158:180–186. [PubMed] [Google Scholar]
- Tanaka A, Ishiguro N, Shinagawa M. Sequence and diversity of bovine T-cell receptor beta-chain genes. Immunogenetics. 1990;32:263–271. doi: 10.1007/BF00187097. [DOI] [PubMed] [Google Scholar]
- Vieira PL, Christensen JR, Minaee S, O'Neill EJ, Barrat FJ, Boonstra A, Barthlott T, Stockinger B, Wraith DC, O'Garra A. IL-10-secreting regulatory T cells do not express Foxp3 but have comparable regulatory function to naturally occurring CD4+CD25+ regulatory T cells. J. Immunol. 2004;172:5986–5993. doi: 10.4049/jimmunol.172.10.5986. [DOI] [PubMed] [Google Scholar]
- von Boehmer H. Mechanisms of suppression by suppressor T cells. Nat. Immunol. 2005;6:338–344. doi: 10.1038/ni1180. [DOI] [PubMed] [Google Scholar]
- Weiss DJ, Evanson OA, Souza CD. Mucosal immune response in cattle with subclinical Johne's disease. Vet. Pathol. 2006;43:127–135. doi: 10.1354/vp.43-2-127. [DOI] [PubMed] [Google Scholar]
- Zheng SG, Gray JD, Ohtsuka K, Yamagiwa S, Horwitz DA. Generation ex vivo of TGF-beta-producing regulatory T cells from CD4+CD25-precursors. J. Immunol. 2002;169:4183–4189. doi: 10.4049/jimmunol.169.8.4183. [DOI] [PubMed] [Google Scholar]


