Abstract
Magnetic resonance (MR) guided optical breast imaging is a promising modality to improve the specificity of breast imaging, because it provides high-resolution quantitative maps of total hemoglobin, oxygen saturation, water content, and optical scattering. These properties have been shown to distinguish malignant from benign lesions. However, the optical detection hardware required for deep tissue imaging has poor spectral sensitivity which limits accurate water quantification; this reduces the accuracy of hemoglobin quantification. We present a methodology to improve optical quantification by utilizing the ability of Dixon MR imaging to quantitatively estimate water and fat; this technique effectively reduces optical crosstalk between water and oxyhemoglobin. The techniques described in this paper reduce hemoglobin quantification error by as much as 38%, as shown in a numerical phantom, and an experimental phantom. Error is reduced by as much 20% when imperfect MR water quantification is given. These techniques may also increase contrast between diseased and normal tissue, as shown in breast tissue in vivo. It is also shown that using these techniques may permit fewer wavelengths to be used with similar quantitative accuracy, enabling higher temporal resolution. In addition, it is shown that these techniques can improve the ability of MRI to quantify water in the presence of bias in the Dixon water/fat separation.
Index Terms: Breast cancer, diffuse optics, image reconstruction, magnetic resonance (MR)
I. Introduction
MAGNETIC resonance (MR) guided diffuse optical breast imaging generates spatial maps of tissue oxyhemoglobin (HbO), deoxyhemoglobin (Hb), water fraction, lipid fraction, and optical scattering amplitude (ScA) and scattering power (ScP) [1]–[3], at a higher resolution than standalone optical imaging [4], [5]. From these quantities, the more clinically relevant values of total hemoglobin (HbT = HbO + Hb) and oxygen saturation fraction (HbO/HbT) can be calculated, which have been shown in standalone optical imaging to exhibit high contrast between normal and diseased tissue [6]–[8], as well as between malignant and benign lesions [9]–[11].
Optical imaging determines tissue contents (chromophores) by reconstructing for the absorption and scatter properties at multiple wavelengths and fitting for tissue contents using their spectral signatures, known a priori. Light in the near infrared (NIR) is highly attenuated in thick tissue, and may decrease by seven orders of magnitude through the breast. This large dynamic range often necessitates imaging with photomuliplier tube (PMT) detectors (gain of 107 in this study). However, the current state-of-the-art PMTs for detection of near infrared light have nonuniform spectral sensitivity, and are ill-suited to measure wavelengths greater than about 850 nm, due to their use of multialkali photocathodes, which have reduced sensitivity in the NIR spectrum.
The omission of wavelengths greater than 850 nm leads to errors in water quantification [12] because the water spectrum is similar to oxyhemoglobin across the sensitivity range of the PMTs, as shown in Fig. 1 [13]. Previous studies have shown the limitations of poor spectral sampling within optical imaging. Franceschini et al. [14] determined that with two wavelengths in the NIR (715 and 825 nm), oxygenation was overestimated by 15% in typical brain tissue. This error increased as tissue properties were modified to match known tumor tissue estimates. Cerussi et al. [15] found that water errors caused by imaging with three wavelengths of 672, 806, and 849 nm could induce errors as high as 60% and 10% in total hemoglobin and oxygenation, respectively, in a diseased breast in vivo compared to imaging using the broadband NIR spectrum.
Fig. 1.
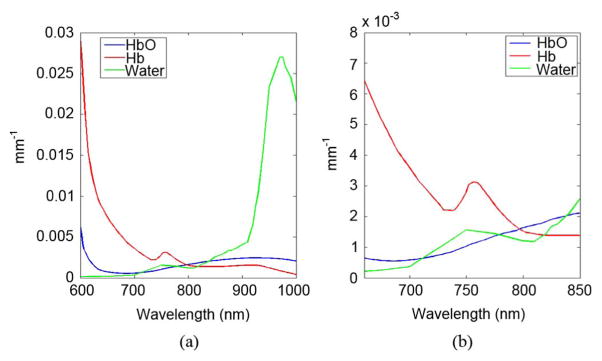
(a) Tissue absorption spectra for typical breast tissue optical properties of 20 μM HbO, 20 μM Hb, and 60% water. (b) Tissue absorption spectra in the sensitivity region of the PMTs. Note the spectral similarity between oxyhemoglobin (HbO) and water.
To correct for water quantification errors and the associated crosstalk between it and hemoglobin, investigators have assumed water values [16], [17], or calculated the water content from scattering power [17]. These techniques are suboptimal because water concentration in the breast varies both spatially and quantitatively between individuals, and scatter power measurements are sensitive to structural tissue property changes that may be independent of water concentration.
An effective way to remove water/hemoglobin crosstalk is to determine water concentration using another modality that is more accurate. Towards this goal, this paper investigates the use of Dixon MR water/fat separation [18] as prior information for the optical reconstruction to provide water quantification. MR water/fat separation has been proposed previously by Li et al. [19] to structurally guide the optical reconstruction. Other methods to incorporate the MR anatomical information into the optical reconstruction have used T1-weighted gadolinium contrast enhanced images [20]. The spatial prior has been either incorporated as a cost-term in the reconstruction objective function [19], [21], [22], or as an absolute structural bound [23], [24]. This study expands on the utility of MR within optical breast imaging by presenting a means to use the MR for quantitative guidance of the reconstruction, through the use of quantitative water priors.
II. Methods
A. MR-Guided Optical Image Formation
MR-guided optical imaging creates images of tissue components by sampling tissue absorption and scattering properties at several wavelengths in the near infrared range. The system instrumentation to perform optical imaging has been described previously [5]. Briefly, 16 13-m-long optical fiber bundles which operate in transmit or receive mode are coupled to the breast tissue through a custom-designed optical fiber holder. NIR light is frequency modulated at 100 MHz and transmitted through the tissue sequentially through each fiber bundle. The amplitude attenuation and phase shift of light emitted from the tissue are measured with PMTs attached to the distal end of the remaining 15 fibers. These data are input into a light propagation model to determine the optical absorption and scattering coefficients for tissue at each wavelength.
Hemoglobin species, water, and lipid content can be computed from optical absorption by solving a linear system that maps the tissue optical absorption coefficients at multiple wavelengths to tissue content concentrations, given by
| (1) |
where μa are the absorption coefficients in tissue which are dependent on wavelength λ, and ɛ are well-known molar extinction coefficients which quantify the optical absorption of tissue components with respect to concentration for each wavelength in the set of measured wavelengths. Hemoglobin optical absorption depends on the concentration of red blood cells in the blood plasma (i.e., the hematocrit) and the concentration of blood in the tissue. Water and lipid absorption is determined by the relative percentages of these components compared to pure (100%) water and lipid. The reduced optical scattering coefficient is represented by . It can be decomposed into scattering amplitude and scattering power by fitting at multiple wavelengths to the form
| (2) |
This is done with a least squares method (lsqlin, MATLAB, Mathworks Natick, MA). Scattering depends on tissue microstructure [25]; the analysis of scattering is beyond the scope of this work.
Light propagation through the breast can be modeled with the lossy diffusion equation [26], which is solved numerically via the finite element method [27], [28]. Images of the tissue properties are formed using a model-based reconstruction approach, utilizing the generalized least squares framework [29]. This optimization problem minimizes the difference between modeled data and experimental data, with a constraint on contrast that is physiologically relevant. The objective function is
| (3) |
where μ is the tissue property vector for N discrete tissue voxels
δ is the difference between the photon propagation model Φm and the experimental measurements Φd, and Wd and Wμ are weighting functions based on the data noise and chromophore concentrations, respectively. Wd is determined from a system noise characterization, and Wμ incorporates several factors based on typical tissue contrasts [3]. [9]. edge-preserving filters [30]. and the water/fat weighting proposed herein. This parameter estimation problem is nonlinear and must be solved iteratively to achieve high quantitative accuracy. Equation (3) is linearized for iterative solving as follows:
| (4) |
where the model data, G(μ), can be approximated with a first-order Taylor series
| (5) |
Here, J (the partial derivative of G with respect to μ) is known as the Jacobian sensitivity matrix, as has been formulated previously [31], [32]
| (6) |
where Φ are the simulated M measurements of amplitude and phase (M = 240 with this instrument) calculated from the current estimate of the optical properties, and N is the number of unknowns (e.g., nodes in a finite element mesh).
The optimization procedure begins by calculating an initial guess, μprior, for each parameter by fitting the data to a light propagation model for a homogeneous volume to determine the average tissue properties [33]. In this study, fat is ignored because its contribution to the optical absorption spectra between 660 and 850 nm is negligible. The initial guess of the tissue property vector, μprior is therefore
| (7) |
Next, the heterogeneous tissue properties are determined by calculating an update to the parameters. The update equation is
| (8) |
where i is the iteration number.
To improve chromophore quantification and accuracy, interior tissue boundaries, determined by MR, can be incorporated into the image reconstruction [5]. The various methods to incorporate this a priori information have been described elsewhere [34]. Here, a region-based reconstruction scheme is used to determine average optical properties in each MR-defined region (adipose tissue, fibroglandular tissue, and suspect lesions) [23].
B. Separating Water and Fat With MR
There are several different approaches to separate water and fat signals in the MR. These methods are based on the proton chemical shift, where differences in the local electronic environment of lipids and water cause differences in the resonant frequency of protons that are exposed to an external magnetic field. The Dixon-type sequences, originally developed by Dixon [18] and Glover et al. [35], sample the magnetic signal at multiple echo times and enable the decomposition of the total signal into water signal and lipid signal. Since the signal in H1 MRI is dominated by the proton density of these two constituents, images of water and fat percentage can be calculated simply by taking the ratio of either component to the total signal [36]. These methods are the most quantitatively accurate water/fat sequences because they are less sensitive to magnetic field inhomogeneities compared to other methods.
In this study the IDEAL (Iterative Decomposition of water and fat with Echo Asymmetry and Least-squares estimation) sequence was used, which improves the signal-to-noise ratio (SNR) of the Dixon sequence by sampling at echo times which minimize the effects of noise [37]. IDEAL imaging improves on Dixon imaging by enabling the choice of echo times which maximize SNR. This sequence has been shown to have extremely high lipid quantification accuracy in the liver [38] and ex vivo swine samples [39]. Bernard et al. [40] found a 3.7% mean difference in lipid quantification between IDEAL and MR spectroscopy, the “gold standard,” and concluded that the IDEAL MR sequence was the best sequence of the available methods to provide quantitative water and fat images.
C. Correlation of Water and Fat Between Optical and MR Imaging
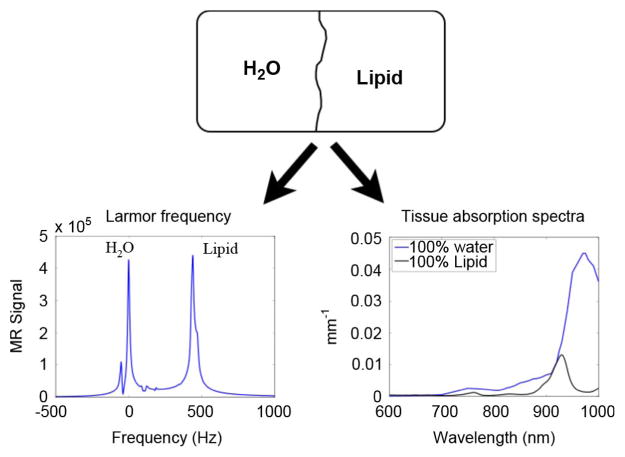
It is critical for the methods presented in this work that the water and fat measured by the MR are the same substances that are measured optically. In principle, optical and MR imaging are sensitive to different characteristics of water and lipids; whereas optical imaging is sensitive to the electronic atomic structure, MR imaging is sensitive to the proton resonance, which is affected by local magnetic shielding. However, for a given voxel of tissue, these modalities both determine water and lipid volume fractions, which are equivalent. This separation is shown pictorially in Fig. 2.
Fig. 2.
Comparison of the spectral dependency of MR and NIR optics on water and fat. Because the signal contributions from water and fat can be isolated, percent water and fat calculated by MR will in principle be the same percentages determined by optics (Optical spectrum obtained from van Veen et al.).
The total signal detected by MR in a unit of tissue consisting of protons only associated with water and fat is [37]
| (9) |
where sW, sF are the signals from water and fat, respectively, ΔfW,F are differences in frequency between the known spectrum of water and lipids, shown in Fig. 2(a), and the frequency of the measurement, and t is the time of the measurement (i.e., the echo time). Water and fat are separated in the IDEAL sequence by measuring the changes in the signal at a distinct number of echo times, and decomposing (9) for water and fat signal. Most importantly, the IDEAL sequence and reconstruction remove contributions due to local field inhomogeneities (offsets), ψ. A comprehensive detailing of this procedure is given in [37].
The signal calculated for each component is
| (10) |
where i is either water, W, or fat, F, ρ is the proton density, k is a scaling factor, which depends on coil sensitivity [41], and R is a relaxation factor which is dependent on tissue relaxation parameters and sequence selection. The coil sensitivity factor is difficult to determine in practice; however, this is not critical since the goal is to separate the signal into water and fat fractions. Additionally, for a small tip angle (used in this work), the contributions from the different Ri are minimal—these can be set equal. Therefore, normalizing the signal in (10) by kR and assuming uniform proton density gives the relative fraction of water and fat
| (11) |
In optical imaging, light absorption from a voxel of tissue is due to the concentration of water, lipids, and hemoglobin. However, water and lipids make up the great majority of the tissue volume. Since water and lipids make up nearly 100% of the volume of breast tissue, one constituent may be determined by subtracting the percentage of the other from 100%. This allows the determination of lipid fraction without the need for its inclusion in the spectroscopic system of equations, given by (1).
Merritt et al. [42] investigated the correlation between water and fat measured optically and by a three-point Dixon MR sequence in water and soybean oil emulsion phantoms. They found an R2 agreement of 0.97 in water, and 0.99 in lipid. The difference in water fraction between the modalities was highest, 5% and 8%, when water percentages were at the extremes of water fraction in tissue, at 10% and 100%, respectively.
D. Methods to Incorporate MR Water and Fat Into Image Reconstruction
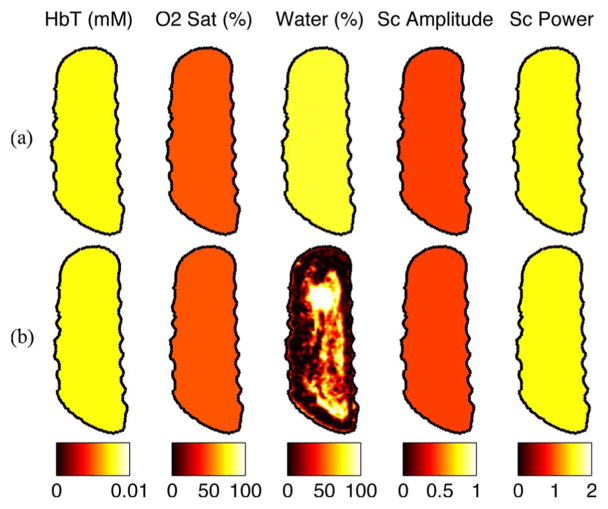
In this work, quantitative MR water/fat separation is incorporated into the optical reconstruction using two methods: the direct substitution method, and the joint weighted estimation method. For both methods, quantitative water and fat fractions from MR are substituted into the initial guess, μprior, whereas the other parameters are computed from an optical calibration routine [33], mentioned above. An example of an all-optical initial guess from the patient imaged in Section III-D is shown in Fig. 3(a), whereas the initial guess using the MR water image is shown in Fig. 3(b). In this work, lipids are ignored since their spectral contribution to the optical signal for the PMTs used in this system is insignificant. Lipid signals are used to determine water concentration in the MR sequences, and are ignored for the MR/optical reconstruction. Once water images are formed, lipid images can be calculated simply by subtracting the water fraction from 1.0, if desired.
Fig. 3.
The initial guess determined by (a) optics alone, and (b) optics including the MR water image, from the patient imaged in this study.
1) Direct Substitution of Water and Fat: If it is assumed that the MR water and fat information is perfectly accurate, these values can be substituted directly into the objective function. Thus, the Water estimate in the tissue property vector, μ, can be replaced with the MR water estimate, MRWATER, which is the water fraction calculated via MR.
The water fraction is fixed throughout the reconstruction, since it is assumed to be estimated accurately by MR. Thus, the water contribution to the Jacobian may be removed during matrix inversion. The Jacobian is modified to
| (12) |
Its dimensions are reduced. The tissue property vector during matrix inversion is reduced to
After the update is calculated, the water estimate from MR is inserted back into the tissue property vector μ to calculate the data/model misfit. This formulation has several advantages. First and foremost, the water is forced to be a more accurate value for water fraction, which ensures that hemoglobin/water crosstalk is reduced. Additionally, the inversion is more stable because of the reduction in the number of unknowns.
2) Joint Weighted Estimation of Water and Fat: A concern with the direct substitution method is in the assumption that the MR quantitative information is perfect. Even in MR sequences that are quantitatively accurate in phantoms, effects from T1 relaxation, inhomogeneous Rf excitation, and spectral deviations from the assumed spectral signatures will lead to inaccuracies. These errors in MR estimation will corrupt not only the MR measured water, but also other parameters because of similarities in the optical absorption spectrum. The joint weighted estimation (JWE) method estimates tissue properties using both optical and MR information jointly. Since both datasets are available, bias in water estimation in one modality will have smaller detriments to parameter recovery. In contrast to the direct substitution approach, this method uses the full Jacobian in the image reconstruction.
The advantage of this method is that the weighting function can be adjusted to control the expected contrast of the water and fat. This weighting function depends on the expected accuracy of the ability of the MR to separate water and fat. These quantities are incorporated into the parameter weighting function
| (13) |
where each of the tissue content weight submatrices, WC (where C are the chromophores), contains the variance, or contrast bound, of each of the parameters on the diagonal, and the covariance, or spatial interdependence of the parameters on the off-diagonal. The weighting functions for WHbO, WHb, WScA, and WScP incorporate the known physiologically possible contrasts of oxyhemoglobin, deoxyhemoglobin, scattering amplitude, and scattering power, respectively, extracted from the literature [3], [9], [43]. These values are described in more detail in Yalavarthy et al. [29] The water weighting function, WWaterMR, incorporates the known accuracy of the MR water quantification measurement at each voxel (denoted with subscript)
| (14) |
In this approach, as opposed to the direct substitution approach, the tissue property vector is
for each calculation of the update equation. The initial guess, μprior is the same as that used for the direct substitution approach (7). In this method, the MR water is used only for the prior estimate of the water—it is not used to fix the water value throughout the reconstruction, as in the direct substitution approach. This formulation allows a joint determination of water, and therefore maintains the dimensions of the Jacobian. This weighting function in is input into the objective function of (3). In this work, the covariances were set to zeros, as covariance of the water voxels between each tissue region were assumed to be independent. The variance of the MR water quantification can be determined via phantom experiments, as performed by Bernard et al. [40].
III. Results
A. Effects of MR Water-Guidance on Errors Caused by Insufficient Spectral Sampling
In any spectroscopy problem, insufficient spectral sampling will lead to errors in separation of the different components due to measurement noise. In optical imaging, the use of fewer wavelengths leads to greater errors in chromophore estimation. In particular, fewer wavelengths is expected to increase crosstalk between water and oxyhemoglobin, as measurement noise will have a greater impact on their spectral separation.
This section investigates error due to hemoglobin/water crosstalk with differing numbers of wavelengths. The water-guided reconstruction algorithms described above were compared to a reconstruction which omitted MR water/fat information. Reconstructions were performed with ensembles of 3, 4, 5, and 6 wavelengths typically used in optical tomography [1], [44] (chosen from 661 nm, 761 nm, 785 nm, 808 nm, 826 nm, 849 nm).
A simulated test problem was created from a breast MR scan, shown in Fig. 4. A finite element mesh was created from the MR images, segmented, and used to generate noisy data (5% Gaussian noise in amplitude, 5° Gaussian noise in phase). A 5-mm-diameter tumor was embedded in the fibroglandular region of a segmented coronal breast MR slice. The diameter of the domain was ∼ 90 mm. The contrast added to the breast was typical of recovered breast properties [2], [20], and is shown in Table I. A separate reconstruction mesh, made from the same volume but with slightly fewer nodes was used to reconstruct tissue properties. The oxyhemoglobin concentration error was determined for various wavelength sets for different numbers of wavelengths. For three wavelengths (N = 3), five sets of different wavelengths (M = 5) were used. Similarly, five sets were used for four wavelengths, five sets were used for five wavelengths, and one set for six wavelengths. The error percentage, E, reported for each of N wavelengths was averaged over the M ensembles of wavelength sets, according to
| (15) |
where μHbO,est and μHbO,truth are the recovered (estimated) and true oxyhemoglobin concentrations, respectively.
Fig. 4.
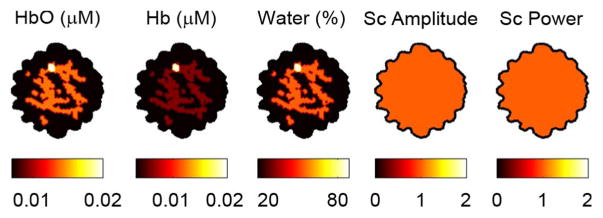
Test problem used in this simulation study. Total hemoglobin in the tumor was set at 0.04 mM, a 2:1 contrast over the background fibroglandular tissue. Oxygen saturation was 50% in the tumor, and 70% in the background. These values are within the range of contrast found between healthy tissue and invasive ductal carcinomas [1]. Data with 5% white noise in AC amplitude and 5° white noise in phase was generated from this geometry.
TABLE I.
Tissue Properties Used in the Simulation Study of Fig. 4
| Tissue Type | HbO (mM) | Hb (mM) | Water (%) | ScA | ScP |
|---|---|---|---|---|---|
|
| |||||
| Adipose | 0.007 | 0.003 | 10 | 1 | 1 |
| Fibroglandular | 0.014 | 0.006 | 50 | 1 | 1 |
| Tumor | 0.020 | 0.020 | 90 | 1 | 1 |
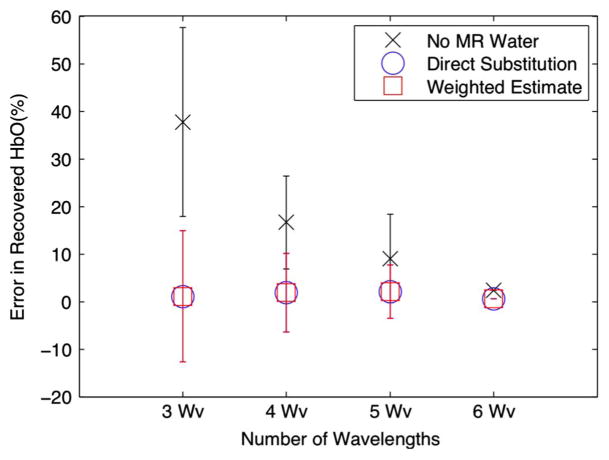
Fig. 5 shows the error in oxyhemoglobin concentration of the various reconstructions. The mean from each set is plotted, as well as error bars indicating standard deviations for each set. Omitting MR water yields average errors of 38%, 18%, 9%, and 2% for 3, 4, 5, and 6 wavelengths, respectively, whereas including MR water yields average errors of 1%, 2%, 2%, and 1%. It is apparent that using MR water information with either method, even with a mere three wavelengths, gives superior oxyhemoglobin concentration quantification compared to omitting MR water, as all are within 2%.
Fig. 5.
Oxyhemoglobin error in terms of the means and standard deviations for all wavelength sets with and without water quantification. Error in HbO decreases with additional wavelengths because of the improved spectral sampling, which in turn leads to more accurate separation between water and oxyhemoglobin. Comparatively, the direct substitution method gives superior quantification, even with three wavelengths.
B. Influence of MR Water/Fat Separation Constraint on Crosstalk
It is important to study the effects of errors in MR quantification on these methods, as MR water quantification is not expected to be perfect. Imperfect water estimation, if rigidly enforced to incorrect values, will lead to errors in oxyhemoglobin concentration. With sufficiently large errors in MR water, including this information may lead to poorer estimation than excluding the water information altogether. This section investigates this effect.
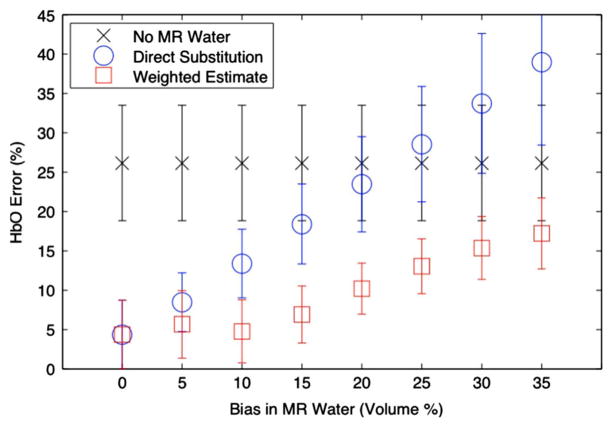
Datasets were formed from the previous test problem of Section III-A, using ensembles of three-wavelengths. This case represents the worst-case scenario for spectral separation, where there are only three datasets for the three unknowns of oxy-hemoglobin concentration, deoxyhemoglobin concentration, and water concentration. While the true water concentration was fixed, the initial water estimation used in the initial guess, μprior, for the MR water guided reconstructions was perturbed by varying amounts, from 0% to 35%. The joint weighted estimation approach incorporated the bound of the MR error into WMRwater, as described in Section II-D. Fig. 6 displays errors in oxyhemoglobin concentration as a function of errors in MR water quantification; means and standard deviations for all sets are plotted. As expected, if the MR water quantification is accurate, using MR water guidance results in lower errors in oxyhemoglobin concentration than if MR water is ignored. However, these results suggest that if MR water quantification is worse than about 22%, including MR water directly is detrimental to the optical reconstruction, even compared to omitting this information entirely. On the other hand, using the joint weighted estimation approach yields a superior estimate when there are biases in MR water for all investigated perturbations.
Fig. 6.
Oxyhemoglobin error in terms of means and standard deviations for all wavelength sets with respect to error in the water estimates. Error in oxyhemoglobin increases as MR water quantification error increases. In this case, simulations were performed using three-wavelength sets. Error is shown as the mean with error bars indicating standard deviation. In these cases, if MR water quantification was within 20% error, using MR water guidance provided a benefit (lower error). In all cases, using a weighted estimate achieved the best quantification (within error bounds).
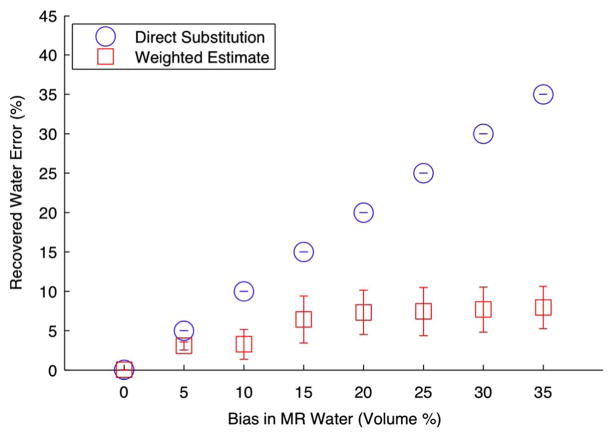
Fig. 7 examines the recovered water values using the two water-guided methods. This shows the increased errors in water estimation as the prior water concentration is increasingly perturbed. In the direct substitution case water error increases linearly, as this method fixes the water concentration to its erroneous prior estimate. In contrast, the joint weighted estimation approach improves the water estimate. Thus, this method may be beneficial in applications where obtaining highly accurate water or lipid concentrations with MR is difficult because of anatomically-induced field inhomogeneity or time constraints.
Fig. 7.
Recovered water error in terms of the means and standard deviations for all wavelength sets with respect to errors in the water estimates. Comparison of recovered errors in water quantification between the direct substitution approach versus the joint weighted estimation approach.
C. Experimental Validation in a Breast Tissue-Simulating Phantom
A gelatin (G2625, Sigma), tissue-simulating phantom was used to test the methodology of using MR water/fat priors. This phantom had a 24 mm gelatin inclusion with 2:1 contrast in total hemoglobin. It was made following techniques described elsewhere [21], [45], [46]. The optical properties of this phantom are shown in Table II. Optical properties are quantified in terms of total hemoglobin (HbT = HbO + Hb) and oxygen saturation (Sat), because the blood oxygenation was not measured (although it was nearly fully oxygenated), and these properties are arguably more interesting clinically.
TABLE II.
True Concentrations in the Background and Region of Interest (ROI) in the Gelatin Phantom. Scatter Amplitude and Scatter Power were Homogeneous, But Unknown (UK)
| HbT (mM) | O2 Sat (%) | Water (%) | Sc-A | Sc-P | |
|---|---|---|---|---|---|
| Background | 0.015 | 100 | 90 | UK | UK |
| ROI | 0.03 | 100 | 90 | UK | UK |
1) Measurement of Water Concentration in Gelatin: To determine the water content in the gelatin, measurements were performed using both a UV-VIS-NIR spectrophotometer (Varian Cary, Varian, Palo Alto, CA) and an MR water/fat separation gradient echo DIXON technique.
Optical absorbance data was collected by placing water and the prepared gelatin into sample cuvettes and measuring their spectra with a spectrophotometer. These spectra were calibrated with a blank cuvette. The spectral absorbance for water and the gelatin phantom are shown in Fig. 8(a). A power law fit was performed on the gelatin data to remove the offset due to scatter signal from the gelatin. Using pure water as a reference, it was determined with this method that the gelatin contained 87% water.
Fig. 8.
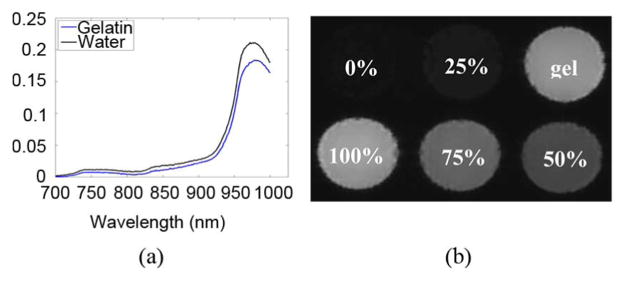
Methods used to compute percent water in gelatin consisted of (a) NIR spectrophotometry, and (b) DIXON MR. In both cases, pure water was used as a reference to determine the water content of the gelatin (labeled here as “gel”).
To measure the water content in gelatin with MR, water-fat separated MR images (2D GRASS, TR = 500 ms, TE = 2.3/3.5/4.6 ms, flip angle = 90°) of phantoms containing varying amounts of water and soybean oil were acquired. These phantoms were blended together by adding 1% Tween (Sigma–Aldrich, St. Louis, MO) and mixing on the blender's high setting for ∼3 min. The well-mixed phantoms had a milky consistency. These phantoms were poured into a cylindrical mold to form phantoms with water concentrations of: 0%, 25%, 50%, 75%, and 100%. The gelatin mixture was poured into a sixth hole, and allowed to cool. The signals from the resulting water images were normalized to the signal of the phantom containing 100% water. Using this method, it was determined that the gelatin phantom had a water concentration of 90%.
2) Reconstruction Results From the Gelatin Phantom: Calibrated data from six wavelengths (661, 761, 785, 808, 826, 849 nm) were used to reconstruct images of chromophore concentrations with water-guided and non-water-guided reconstructions. To again investigate the effects of poor spectral sampling, reconstructions were performed with varying numbers of wavelengths. Specifically, three reconstructions used three wavelengths of data (one with 661, 785, and 849 nm, one with 661, 761, and 785 nm, and one with 661, 785, and 826 nm), two reconstructions used four wavelengths (one with 661, 761, 785, 849, and one with 661, 761, 785, 808) one reconstruction used five wavelengths (661, 761, 785, 808, 826), and one used the full six wavelength dataset. For the MR water guided methods, water was input exactly (88.5%, averaged from the spectrometer and DIXON methods), as determined above. Since the water-guided reconstructions give the same result with 0% error in water, only the JWE approach was used in this section. Example optical image reconstructions are shown in Fig. 9(a)–(c) for the wavelength set of 661, 785, and 826 nm. Absolute percent errors are shown in Fig. 9(d).
Fig. 9.
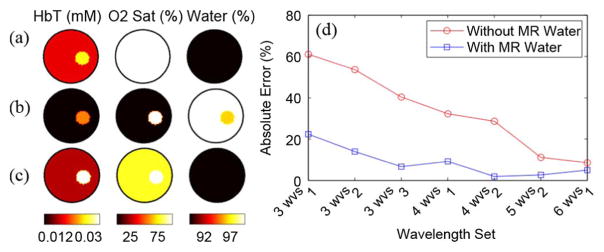
Comparison of reconstructions of three wavelengths of 661, 785, and 826 nm with and without water priors. (a) Target true values, (b) non-water-guided reconstruction, and (c) water-guided reconstruction. (d) Errors in oxyhemoglobin of water guided versus nonwater guided reconstructions for different numbers of wavelengths.
As expected, when the MR water image is used, errors in total hemoglobin decrease compared to the non-water-guided technique, especially when using three or four wavelengths. As more wavelengths are included in the reconstruction, the non-water-guided case converges to the water guided-case. These reconstruction results show that utilizing the MR water information yields a more accurate estimation of total hemoglobin (statistical significance: p < 0.001, one-tailed two-sample t-test).
D. In Vivo Results in a Human Breast
A 47-year-old woman with an invasive ductal carcinoma of the left breast was imaged postbiopsy. MR images were taken in the coronal plane, including a gradient echo T2-weighted sequence [Fig. 10(b)] and a spoiled gradient echo IDEAL water/fat sequence. Anatomical boundaries of the fibroglandular tissue and suspect lesion were manually segmented under supervision of the radiologist (B. Daniel). Gadolinium-enhanced images were collected 11 days prior to the imaging session according to the clinical breast protocol at Stanford University Medical Center [Fig. 10(a)]. IDEAL water/fat separation images in the plane of the optical fibers are shown in Fig. 10(c) and (d). Three reconstructions were performed: one without water-guidance, one with water-guidance using the direct substitution method, and one with the JWE approach with MR water accuracy of ±3.7%. This value was taken from [40], which used the same commercially available Fat/Water imaging sequence.
Fig. 10.
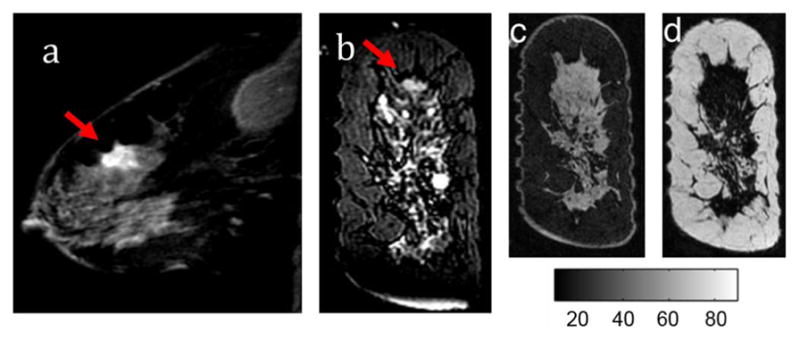
(a) T1-W Gadolinium MR image of the affected breast (b) T2 weighted image in the coronal plane of the optical fibers. Tumors are identified with the red arrows. Images of water (c) and lipid (d) IDEAL MR images.
The optical image results are shown Fig. 11. Without either MR-water method, the tumor hemoglobin was estimated at 0.035 mM compared to 0.026 mM in the fibroglandular and 0.016 mM in the adipose tissue. Comparing the quantitative MR water image with the all-optical estimatation, the water content is underestimated. Oxygen saturation was highest in the tumor at 70%, slightly above the oxygen saturation in the fibroglandular and adipose tissue, both around 60%.
Fig. 11.
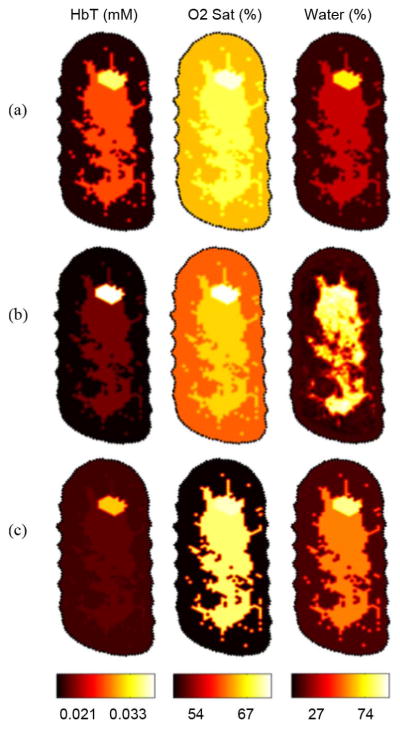
(a) In vivo image reconstructions of a diseased breast without MR water guidance priors. (b) Image reconstruction using the direct substitution gives the highest tumor to background contrast. (c) Image reconstruction using the joint weighted estimation approach yields higher contrast than ignoring water quantitative priors, but less contrast than the direct substitution method.
By including MR water values via the direct substitution method, total hemoglobin was estimated to be 0.039 mM in the tumor, and 0.019 mM and 0.015 mM in the fibroglandular and adipose tissues, respectively. Because the direct method more accurately estimates water at 60%, oxyhemoglobin estimates are lower, which results in more hemoglobin contrast between the fibroglandular tissue and the tumor tissue. The effect of including MR water priors via this method increased tumor to fibroglandular total hemoglobin contrast by ∼42%, to ∼103%.
The joint weighted estimation approach led to total hemoglobin recovery of 0.031 mM, while fibroglandular and adipose were 0.018 mM and 0.017 mM, respectively. This led to an increase in contrast compared to excluding water priors of ∼7%. The decrease in contrast in total hemoglobin of the JWE method versus the direct method could likely be attributed to the decrease in water in the fibroglandular tissue by ∼5%, from 60.2% to 54.9%, and no significant change in water content in the tumor tissue.
IV. Discussion and Conclusion
MR-guided optical imaging offers the ability to characterize tissue properties that may provide significant benefit to the identification and classification of lesions. One advantage of using MR guidance compared to standalone optical imaging is its ability to provide anatomical boundaries; this topic has been previously investigated in the literature. Structural information enables several improvements: a more accurate light propagation model is formed by better delineating the air/tissue boundary [47], optical fiber positions relative to the tissue are identified with higher accuracy [5], and interior boundaries may be incorporated [4], [21], [22]. Incorporating anatomical MR information has been shown to improve a fundamental limitation of optical imaging—spatial resolution [48]. In this work, we have shown that the MR may provide further aid to optical imaging through its spectral capabilities, which improve a practical limitation—suboptimal optical detection hardware.
This study shows that including MR water/fat separation can yield significant improvement in hemoglobin quantification. In a simulated complex case with added noise, inputting the correct quantity of water through these techniques yielded nearly a 40% reduction in oxyhemoglobin error when imaging with as few as three wavelengths. This error was demonstrated in Figs. 6 and 7 to be dependent on water bias, due to poor spectral sampling of the water (compare the near-linear increase in recovered water bias in Fig. 7 with oxyhemoglobin bias in Fig. 6). These numerical phantoms suggest that these methodologies are less sensitive to data noise, which is the dominant cause of errors when de-convolving spectra with a minimal number of samples (wavelengths).
In a tissue-simulating experimental phantom, including the MR water prior in the image reconstruction yielded hemoglobin quantification improvements of near 40% when imaging with three wavelengths.
In imaging a patient with breast cancer, it was found that hemoglobin contrast between the tumor and the background tissue was increased when MR quantitative water information was incorporated. Since the all-optical water estimation led to an underestimation of the water content compared to the MR, this reconstruction may have led to an overestimation in total hemoglobin in the fibroglandular tissue because of crosstalk. Thus, the ignoring the MR water information led to reduced tumor to background contrast.
These results also demonstrate that large MR water quantification errors will result in poorer tissue recovery with a constrained water-guided reconstruction than if MR water is ignored. By incorporating the known variance of the MR sequence (here varied between 2.5% and 35%) into the reconstruction, the joint-weighted estimate algorithm recovered tissue properties with up to 20% less error. This method is critical when there is a high degree of magnet inhomogeneity, such as cases where patient size or patient position in the breast coil degrades image quality. Thus, in cases where the water/fat separation is expected to be poor, the joint weighted estimation method is more appropriate.
An important outcome from this work is the demonstration that incorporating MR water quantification may alleviate the need to add more than the 3 wavelengths required to resolve HbO, Hb, and Water. Figs. 5 and 9 demonstrated this capability. This has significant utility for increasing temporal resolution, as adequate accuracy may be achieved with fewer wavelengths. These results imply that adding additional wavelengths in endogenous optical imaging mainly serves to improve water quantification, thereby indirectly aiding hemoglobin quantification. However, this observation must be put into the context of the system, both in terms of spectral capabilities and noise performance. Clearly, a system which has poor accuracy in detecting the wavelengths most sensitive to hemoglobin (e.g., 661, 761, and 785 nm) will suffer from poor quantification in hemoglobin regardless of whether or not MR water quantification is utilized.
As multimodality instruments become more common in the clinic, a unique benefit is if they offer complimentary information. Combining MR and optical provides benefits to each modality; while MR can improve on the inherent limitations of optical imaging, optical contrasts may improve the information content of MR. Imaging of water and fat quantities is a good example of the synergy that can exist between these modalities.
Acknowledgments
This work was supported by the Department of Defense Pre-doctoral Training Fellowship 503298, the National Cancer Institute grants 5P01CA080139 and 2R01CA069544, and the Center for Advanced Magnetic Resonance Technology at Stanford, P41 RR009784.
Contributor Information
Colin M. Carpenter, Email: colincarpenter@stanford.edu, Thayer School of Engineering, Dartmouth College, Hanover, NH 03755 USA. He is now with the Department of Radiation Oncology, School of Medicine, Stanford University, Stanford, CA 94305 USA
Brian W. Pogue, Email: pogue@dartmouth.edu, Thayer School of Engineering, Dartmouth College, Hanover, NH 03755 USA
Shudong Jiang, Email: jiang@dartmouth.edu, Thayer School of Engineering, Dartmouth College, Hanover, NH 03755 USA.
Jia Wang, Email: wang.jia2@mayo.edu, Thayer School of Engineering, Dartmouth College, Hanover, NH 03755 USA. He is now with the Department of Radiology, Mayo Clinic, Rochester, MN 55905 USA.
Brian A. Hargreaves, Email: bah@stanford.edu, Department of Radiology, Stanford University School of Medicine, Stanford, CA 94305 USA
Rebecca Rakow-Penner, Email: rakow@stanford.edu, Department of Radiology, Stanford University School of Medicine, Stanford, CA 94305 USA.
Bruce L. Daniel, Email: bdaniel@stanford.edu, Department of Radiology, Stanford University School of Medicine, Stanford, CA 94305 USA
Keith D. Paulsen, Email: paulsen@dartmouth.edu, Thayer School of Engineering, Dartmouth College, Hanover, NH 03755 USA
References
- 1.Pogue BW, Poplack SP, McBride TO, Wells WA, Osterman SK, Osterberg UL, Paulsen KD. Quantitative hemoglobin tomography with diffuse near-infrared spectroscopy: Pilot results in the breast. Radiology. 2001;218(1):261–6. doi: 10.1148/radiology.218.1.r01ja51261. [DOI] [PubMed] [Google Scholar]
- 2.Brooksby B, Pogue BW, Jiang S, Dehghani H, Srinivasan S, Kogel C, Tosteson T, Weaver JB, Poplack SP, Paulsen KD. Imaging breast adipose and fibroglandular tissue molecular signatures using hybrid MRI-guided near-infrared spectral tomography. Proc Nat Acad Sci. 2006;103:8828–8833. doi: 10.1073/pnas.0509636103. [DOI] [PMC free article] [PubMed] [Google Scholar]
- 3.Durduran T, Choe R, Culver JP, Zubkov L, Holboke MJ, Giammarco J, Chance B, Yodh AG. Bulk optical properties of healthy female breast tissue. Phys Med Biol. 2002;47(16):2847–2861. doi: 10.1088/0031-9155/47/16/302. [DOI] [PubMed] [Google Scholar]
- 4.Barbour RL, Graber HL, Chang J, Barbour SS, Koo PC, Aronson R. MRI-guided optical tomography: Prospects and computation for a new imaging method. IEEE Comp Sci Eng. 1995;2(4):63–77. [Google Scholar]
- 5.Brooksby B, Jiang S, Dehghani H, Pogue BW, Paulsen KD, Kogel C, Doyley M, Weaver JB, Poplack SP. Magnetic resonance-guided near-infrared tomography of the breast. Rev Sci Instrum. 2004;75(12):5262–5270. [Google Scholar]
- 6.Grosenick D, Wabnitz H, Moesta KT, Mucke J, Moller M, Stroszczynski C, Stossel J, Wassermann B, Schlag PM, Rinneberg H. Concentration and oxygen saturation of haemoglobin of 50 breast tumours determined by time-domain optical mammography. Phys Med Biol. 2004;47(9):1165–1181. doi: 10.1088/0031-9155/49/7/006. [DOI] [PubMed] [Google Scholar]
- 7.Intes X. Time-domain optical mammography softscan initial results. Acad Radiol. 2005;12(8):934–947. doi: 10.1016/j.acra.2005.05.006. [DOI] [PubMed] [Google Scholar]
- 8.Poplack SP, Tosteson TD, Wells WA, Pogue BW, Meaney PM, Hartov A, Kogel CA, Soho SK, Gibson JJ, Paulsen KD. Electromagnetic breast imaging: Results of a pilot study in women with abnormal mammograms. Radiology. 2007;243(2):350–9. doi: 10.1148/radiol.2432060286. [DOI] [PubMed] [Google Scholar]
- 9.Cerussi A, Shah N, Hsiang D, Durkin A, Butler J, Tromberg B. In vivo absorption, scattering, and physiologic properties of 58 malignant breast tumors determined by broadband diffuse optical spectroscopy. J Biomed Opt. 2006;11(4) doi: 10.1117/1.2337546. [DOI] [PubMed] [Google Scholar]
- 10.Choe R, Konecky SD, Corlu A, Lee K, Durduran T, Busch DR, Czerniecki B, Tchou J, Fraker DL, DeMichele A, Chance B, Putt E, Schnall MD, Rosen MA, Yodh AG. Differentiation of benign and malignant breast lesions by in-vivo three-dimensional diffuse optical tomography. Cancer Res. 2009;69(2):102S. doi: 10.1117/1.3103325. [DOI] [PMC free article] [PubMed] [Google Scholar]
- 11.Carpenter CM, Jiang S, Srinivasan S, Pogue BW, Paulsen KD. MRI-guided near-infrared spectroscopy of breast tumors. Medicamundi. 2009;53(1):28–34. [Google Scholar]
- 12.Corlu A, Durduran T, Choe R, Schweiger M, Hillman EM, Arridge SR, Yodh AG. Uniqueness and wavelength optimization in continuous-wave multispectral diffuse optical tomography. Opt Lett. 2003;28(23):2339–41. doi: 10.1364/ol.28.002339. [DOI] [PubMed] [Google Scholar]
- 13.van Veen R, Sterenborg H, Pifferi A, Torricelli A, Cubeddu R. OSA Annu. BIOMED Topical Meeting; Miami, FL. 2004; p. SF4. [Google Scholar]
- 14.Franceschini M, Fantini S, Cerussi A, Barbieri B, Chance B, Gratton E. Quantitative spectroscopic determination of hemoglobin concentration and saturation in a turbid medium: Analysis of the effect of water absorption. J Biomed Opt. 1997;2(2):147–153. doi: 10.1117/12.262145. [DOI] [PubMed] [Google Scholar]
- 15.Cerussi AE, Jakubowski D, Shah N, Bevilacqua F, Lanning R, Berger AJ, Hsiang D, Butler J, Holcombe RF, Tromberg BJ. Spectroscopy enhances the information content of optical mammography. J Biomed Opt. 2002;7(1):60–71. doi: 10.1117/1.1427050. [DOI] [PubMed] [Google Scholar]
- 16.Fang QQ, Carp SA, Selb J, Boverman G, Zhang Q, Kopans DB, Moore RH, Miller EL, Brooks DH, Boas DA. Combined optical imaging and mammography of the healthy breast: Optical contrast derived from breast structure and compression. IEEE Trans Med Imag. 2009 Jan;28(1):30–42. doi: 10.1109/TMI.2008.925082. [DOI] [PMC free article] [PubMed] [Google Scholar]
- 17.McBride TO, Pogue BW, Poplack S, Soho S, Wells WA, Jiang S, Osterberg UL, Paulsen KD. Multispectral near-infrared tomography: A case study in compensating for water and lipid content in hemoglobin imaging of the breast. J Biomed Opt. 2002;7(1):72–9. doi: 10.1117/1.1428290. [DOI] [PubMed] [Google Scholar]
- 18.Dixon WT. Simple proton spectroscopic imaging. Radiology. 1984;153:189–194. doi: 10.1148/radiology.153.1.6089263. [DOI] [PubMed] [Google Scholar]
- 19.Li A, Boverman G, Zhang Y, Brooks D, Miller E, Kilmer M, Zhang Q, Hillman E, Boas D. Optimal linear inverse solution with multiple priors in diffuse optical tomography. Appl Opt. 2005;44(10) doi: 10.1364/ao.44.001948. [DOI] [PubMed] [Google Scholar]
- 20.Carpenter CM, Pogue BW, Jiang SJ, Dehghani H, Wang X, Paulsen KD, Wells WA, Forero J, Kogel C, Weaver JB, Poplack SP, Kaufman PA. Image-guided spectroscopy provides molecular specific information in vivo: MRI-guided spectroscopy of breast cancer hemoglobin, water, and scatterer size. Opt Lett. 2007;32(8):933–935. doi: 10.1364/ol.32.000933. [DOI] [PubMed] [Google Scholar]
- 21.Brooksby B, Jiang S, Dehghani H, Pogue BW, Paulsen KD, Weaver JB, Kogel C, Poplack SP. Combining near infrared tomography and magnetic resonance imaging to study in vivo breast tissue: Implementation of a laplacian-type regularization to incorporate MR structure. J Biomed Opt. 2005;10(5):050504-1–050504-10. doi: 10.1117/1.2098627. [DOI] [PubMed] [Google Scholar]
- 22.Guven M, Yazici B, Intes X, Chance B. Diffuse optical tomography with a priori anatomical information. Phys Med Biol. 2005;12:2837–2858. doi: 10.1088/0031-9155/50/12/008. [DOI] [PubMed] [Google Scholar]
- 23.Dehghani H, Pogue BW, Shudong J, Brooksby B, Paulsen KD. Three-dimensional optical tomography: Resolution in small-object imaging. Appl Opt. 2003;42(16):3117–28. doi: 10.1364/ao.42.003117. [DOI] [PubMed] [Google Scholar]
- 24.Carpenter C, Srinivasan S, Pogue B, Paulsen K. Methodology development for three-dimensional MR-guided near infrared spectroscopy of breast tumors. Opt Express. 2008;16(22):17903–17914. doi: 10.1364/oe.16.17903. [DOI] [PMC free article] [PubMed] [Google Scholar]
- 25.Bigio IR, Bown SG, Briggs G, Kelley C, Lakhani S, Pickard D, Ripley PM, Rose IG, Sanders C. Diagnosis of breast cancer using elastic-scattering spectroscopy: Preliminary clinical results. J Biomed Opt. 2000;5(2):221–228. doi: 10.1117/1.429990. [DOI] [PubMed] [Google Scholar]
- 26.Patterson MS, Wilson BC, Wyman DR. The propagation of optical radiation in tissue II. Optical properties of tissues and resulting fluence distributions. Lasers Med Sci. 1990;6:379–390. [Google Scholar]
- 27.Arridge SR, Schweiger M, Hiraoka M, Delpy DT. A finite-element approach for modeling photon transport in tissue. Med Phys. 1993;20(2):299–309. doi: 10.1118/1.597069. [DOI] [PubMed] [Google Scholar]
- 28.Paulsen KD, Hjiang J. Spatially varying optical property reconstruction using a finite element diffusion equation approximation. Med Phys. 1995;22(6):691–701. doi: 10.1118/1.597488. [DOI] [PubMed] [Google Scholar]
- 29.Yalavarthy PK, Pogue BW, Dehghani H, Paulsen KD. Weight-matrix structured regularization provides optical generalized least-squares estimate in diffuse optical tomography. Med Phys. 2007;34(6):2085–98. doi: 10.1118/1.2733803. [DOI] [PubMed] [Google Scholar]
- 30.Intes X, Maloux C, Guven M, Yazici T, Chance B. Diffuse optical tomography with physiological and spatial a priori constraints. Phys Med Biol. 2004;49:N155–N163. doi: 10.1088/0031-9155/49/12/n01. [DOI] [PubMed] [Google Scholar]
- 31.Arridge SR, Schweiger M. Photon-measurement density functions. Part 2: Finite-element-method calculations. Appl Opt. 1995;34:8026–8037. doi: 10.1364/AO.34.008026. [DOI] [PubMed] [Google Scholar]
- 32.Corlu A, Choe R, Durduran T, Lee K, Schweiger M, Arridge SR, Hillman EM, Yodh AG. Diffuse optical tomography with spectral constraints and wavelength optimization. Appl Opt. 2005;44(11):2082–93. doi: 10.1364/ao.44.002082. [DOI] [PubMed] [Google Scholar]
- 33.McBride TO, Pogue BW, Osterberg UL, Paulsen KD. Strategies for absolute calibration of near infrared tomographic tissue imaging. Adv Exp Med Biol. 2003;530:85–99. doi: 10.1007/978-1-4615-0075-9_9. [DOI] [PubMed] [Google Scholar]
- 34.Carpenter CM, Pogue BW. Diffuse optical spectroscopy with magnetic resonance imaging. In: Azar FS, Intes X, editors. Translational Multimodality Optical Imaging. Boston, MA: Artech; 2008. [Google Scholar]
- 35.Glover GH, Schnieder E. Three-point dixon technique for true water/fat decomposition with B0 inhomogeneity correction. Magn Reson Med. 1991;18(2) doi: 10.1002/mrm.1910180211. [DOI] [PubMed] [Google Scholar]
- 36.Graham SJ, Stanchev PL, LloydSmith JOA, Bronskill MJ, Plewes DB. Changes in fibroglandular volume and water content of breast tissue during the menstrual cycle observed by MR imaging at 1.5 T. J Magn Reson Imag. 1995;5(6):695–701. doi: 10.1002/jmri.1880050613. [DOI] [PubMed] [Google Scholar]
- 37.Reeder S, Pelc N, Alley M, Gold G. Multi-coil Dixon chemical species separation with an iterative least squares method. Magn Reson Med. 2004;51:35–45. doi: 10.1002/mrm.10675. [DOI] [PubMed] [Google Scholar]
- 38.Guiu B, Loffroy R, Cercueil JP, Krause D. Multiecho MR imaging and proton MR spectroscopy for liver fat quantification. Radiology. 2008;249(3):1081. doi: 10.1148/radiol.2493081034. [DOI] [PubMed] [Google Scholar]
- 39.Hu HH, Nayak KS. Quantification of absolute fat mass using an adipose tissue reference signal model. J Magn Reson Imag. 2008;28(6):1483–1491. doi: 10.1002/jmri.21603. [DOI] [PMC free article] [PubMed] [Google Scholar]
- 40.Bernard CP, Liney GP, Manton DJ, Turnbull LW, Langton CM. Comparison of fat quantification methods: A phantom study at 3.0 T. J Magn Reson Imag. 2008;27(1):192–197. doi: 10.1002/jmri.21201. [DOI] [PubMed] [Google Scholar]
- 41.Liang ZP, Lauterbur PC. Principles of Magnetic Resonance Imaging a Signal Processing Perspective. New York: IEEE Press; 2000. [Google Scholar]
- 42.Merritt S, Gulsen G, Chiou G, Chu Y, Deng C, Cerussi AE, Durkin AJ, Tromberg BJ, Nalcioglu O. Comparison of water and lipid content measurements using diffuse optical spectroscopy and MRI in emulsion phantoms. Technol Cancer Res Treatment. 2003;2(6):563–9. doi: 10.1177/153303460300200608. [DOI] [PubMed] [Google Scholar]
- 43.Srinivasan S, Pogue BW, Jiang S, Dehghani H, Kogel C, Soho S, Chambers JG, Tosteson TD, Poplack SP, Paulsen KD. Interpreting hemoglobin and water concentration, oxygen saturation, and scattering measured by near-infrared tomography of normal breast in vivo. Proc Nat Acad Sci USA. 2003;100(21):12349–12354. doi: 10.1073/pnas.2032822100. [DOI] [PMC free article] [PubMed] [Google Scholar]
- 44.Ntziachristos V, Yodh AG, Schnall M, Chance B. Concurrent MRI and diffuse optical tomography of breast after indocyanine green enhancement. Proc Nat Acad Sci USA. 2000;97(6):2767–72. doi: 10.1073/pnas.040570597. [DOI] [PMC free article] [PubMed] [Google Scholar]
- 45.Pogue BW, Patterson MS. Review of tissue simulating phantoms for optical spectroscopy, imaging and dosimetry. J Biomed Opt. 2006;11(4) doi: 10.1117/1.2335429. [DOI] [PubMed] [Google Scholar]
- 46.Wang J, Davis SC, Srinivasan S, Jiang SD, Pogue BW, Paulsen KD. Spectral tomography with diffuse near-infrared light: Inclusion of broadband frequency domain spectral data. J Biomed Opt. 2008;13(4):041305. doi: 10.1117/1.2952006. [DOI] [PMC free article] [PubMed] [Google Scholar]
- 47.Li A, Miller EL, Kilmer ME, Brukilaccio TJ, Chaves T, Stott J, Zhang Q, Wu T, Choriton M, Moore RH, Kopans DB, Boas DA. Tomographic optical breast imaging guided by three-dimensional mammography. Appl Opt. 2003;42(25):5181–5190. doi: 10.1364/ao.42.005181. [DOI] [PubMed] [Google Scholar]
- 48.Yalavarthy PK, Pogue BW, Dehghani H, Carpenter CM, Jiang SJ, Paulsen KD. Structural information within regularization matrices improves near infrared diffuse optical tomography. Opt Exp. 2007;15(13) doi: 10.1364/oe.15.008043. [DOI] [PubMed] [Google Scholar]


