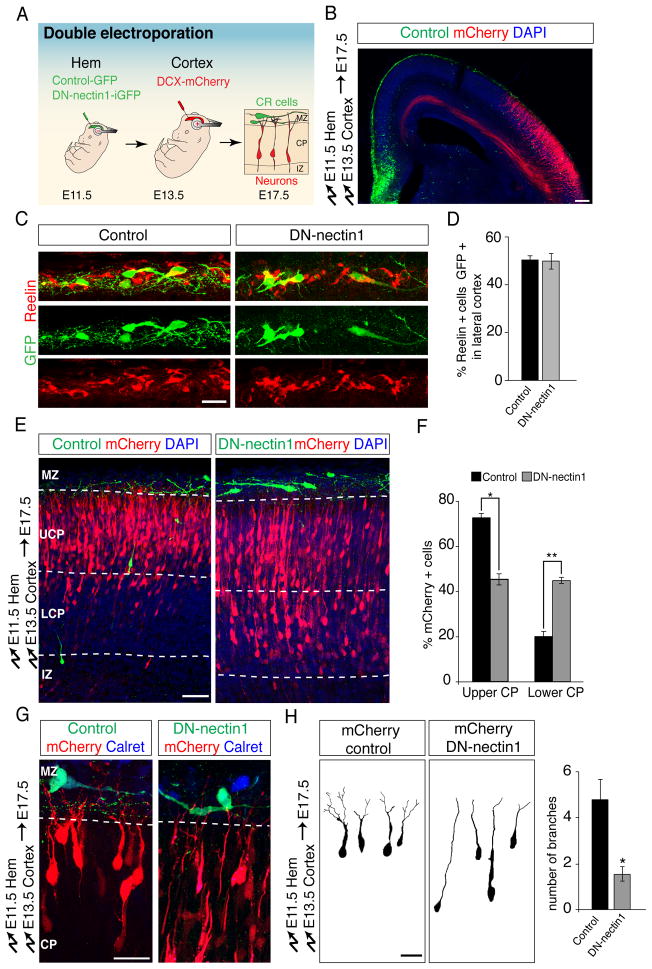
Fig. 5. Nectin1 in CR cells is required non-autonomously for glia-independent somal translocation of radially migrating projection neurons.
(A) Double-electroporation to target CR cells and then label radially migrating neurons in the same embryo. Control-iGFP or DN-nectin1-iGFP was electroporated into the cortical hem at E11.5, then migrating neurons were electroporated with Dcx-mCherry at E13.5. Neuronal position was analyzed at E17.5. (B) Example of a double-electroporated brain showing GFP-expressing cells (green) in the hem and MZ and mCherry-expressing projection neurons (red). DAPI-stained nuclei are in blue. (C) High magnification view of the lateral cortex showing that hem-electroporated cells in the MZ (green) have typical CR cell morphologies and express reelin (red). Note that half of all reelin+ CR cells in the lateral cortex are electroporated, as quantified in (D). (D) Quantification (mean ± SEM) of the percentage of CR cells in the lateral cortex that express control GFP or DN-Nectin1 after hem electroporation. (E) Perturbation of nectin1 function in CR cells causes a non-cell-autonomous migration defect of early-born projection neurons. Neurons in controls reach the upper cortical plate (UCP) by E17.5, whereas expression of DN-nectin1 in CR cells (green) causes radially migrating neurons (red) to accumulate in the lower CP (LCP). (F) Quantification (mean ± SEM) of the data in (D). *p < 0.00005, **p < 0.000005, by Student’s t-test. (G) Leading processes of migrating neurons (red) show reduced arborization compared to controls when they encounter CR cells expressing DN-nectin1 (green). The CR cell marker caretinin is shown in blue. (H) 3D reconstructions of mCherry+ projection neurons in contact with the MZ after double electroporation. Leading processes that contact control CR cells arborize in the MZ, whereas neurons contacting CR cells expressing DN-nectin1 display minimal arborization. Quantification is mean ± SEM of the number of branches in the MZ 4 days after electroporation. *p <0.001 by Student’s t-test. Scale bars (B) 100 μm, (C,G,H) 10 μm and (E) 50 μm. See also Figure S4.

