

Abstract
Systemic lupus erythematosus (SLE) is an autoimmune disease characterized by the production of autoantibodies against self-antigens such as double-stranded DNA and phospholipids. Classical comorbidities of SLE include glomerulonephritis, infection, cardiovascular disease, arthritis, skin disorders, and neurological disease. In addition to these classical comorbidities, there is emerging evidence that SLE patients are at higher risk of developing insulin resistance and other components of the metabolic syndrome. Visceral adipose tissue inflammation is a central mediator of insulin resistance in the obese setting, but the mechanism behind the pathogenesis of metabolic disease in the SLE patient population is unclear. We hypothesize that lupus-associated changes in the adaptive immune system are associated with disruption in glucose homeostasis in the context of SLE. To test this hypothesis, we assessed the metabolic and immunological phenotype of SLE-prone B6.SLE mice. B6.SLE mice fed a low-fat diet had significantly worsened glucose tolerance, increased adipose tissue insulin resistance, increased β-cell insulin secretion, and increased adipocyte size compared with their respective B6 controls. Independently of diet, B cells isolated from the white adipose tissue of B6.SLE mice were skewed toward IgG production, and the level of IgG1 was elevated in the serum of SLE-prone mice. These data show that B6.SLE mice develop defects in glucose homeostasis even when fed a low-fat diet and suggest that B cells may play a role in this metabolic dysfunction.
Keywords: insulin resistance, glucose intolerance, autoimmunity, lupus, autoantibodies
systemic lupus erythematosus (SLE) is a chronic autoimmune disease in which pathogenic autoantibodies disrupt the functions of various organs and organ systems. Causes of SLE mortality can be clustered into two main groups: early mortality and late mortality (6, 12, 40). The early-mortality group includes glomerulonephritis, infection, and neurological disease, whereas the late-mortality group is mainly composed of cardiovascular disease (CVD) (17, 30). Management of SLE complications has improved over the last several decades, causing a shift in the mortality burden from early causes to late causes. As this burden shifts, it is important to understand the factors that contribute to the development of CVD in the context of SLE. Various studies have shown a higher prevalence of traditional CVD risk factors such as hyperlipidemia or hypertension and nontraditional, SLE-specific risk factors such as autoantibody production or corticosteroid therapy (6). One traditional risk factor, metabolic syndrome, has higher prevalence in the SLE population (8, 11, 22, 33) and may contribute to the increased CVD burden in these patients.
The metabolic syndrome consists of several interrelated disorders, including the “deadly quartet” of truncal obesity, insulin resistance (IR), hypertension, and dyslipidemia (10, 18). IR, a key component of type 2 diabetes mellitus (T2DM), is thought to be caused by chronic inflammatory processes involving complex interactions between cells of the metabolic and immune systems. Several studies have yielded crucial information implicating visceral adipose tissue as a main focus of the chronic inflammation that can contribute to IR and T2DM. Examination of fat tissue has revealed an accumulation of adipose tissue macrophages in obese mice (43), and blocking the accumulation of these cells attenuates IR in these animals (42). More recent studies have implicated the adaptive immune system in the pathogenesis of IR. CD8+ T cells exacerbate whereas T regulatory cells ameliorate IR in the context of obesity (13, 27, 45), and B cells have been shown to exacerbate IR through the production of pathogenic immunoglobulins presumably against adipose tissue antigens (44).
There are limited data regarding metabolic syndrome in mouse models of SLE. In the only other study of metabolic syndrome in an SLE model that we are aware of, Ryan et al. (32) have shown that the lupus-prone (NZB/W)F1 strain has increased adiposity, increased macrophage infiltration into adipose tissue, and increased glucose intolerance, but the contributions of the adaptive immune system to this metabolic phenotype was not examined. Therefore, the role of lymphocytes in the pathogenesis of IR in the context of SLE is not known and merits further study. Furthermore, there are no reports on metabolic syndrome in other mouse models of SLE.
We examined the pathogenesis of metabolic syndrome in the B6.SLE mouse model of SLE. The B6.SLE congenic strain is derived from the NZM2410 [(NZB/W)F1 × NZW] model of SLE, which develops severe lupus and nephritis in both sexes (23). Through linkage analyses, Morel et al. (23) identified three major genomic intervals linked to lupus susceptibility in the strain. Using these three chromosomal intervals, termed Sle1, Sle2, and Sle3, the investigators made triple congenic mice on the C57Bl/6 background (24, 25). The B6.SLE strain (originally named B6.Sle1.2.3) displays a fully penetrant lupus phenotype similar to that of humans. In the current study, we present evidence that adipose tissue IR and disrupted glucose homeostasis in B6.SLE may be mediated by pathogenic B cells.
MATERIALS AND METHODS
Mice.
B6.Sle.1.2.3 mice, hereafter referred to as B6.SLE mice, were a generous gift of Edward Wakeland (UTSW, Dallas, TX) and have been previously described (23). C57BL/6 mice (B6) were originally purchased from Jackson Labs (Bar Harbor, ME) and were bred in the animal facility at Vanderbilt University Medical Center. All procedures involving animal subjects received prior approval from the Vanderbilt University Institutional Animal Care and Use Committee.
Diet.
B6 and B6.SLE mice were cohoused after weaning and fed a low-fat diet (LFD, 10% kcal from fat, D12450B; Research Diets, New Brunswick, NJ) or high-fat diet (HFD, 45% kcal from fat, D12451; Research Diets) ad libitum.
Glucose tolerance tests.
Study mice were fasted for 5–6 h on paper bedding before their tails were nicked under isoflurane anesthesia. Mice were rested for 20 min and then injected intraperitoneally with 1.25 g/kg lean body mass glucose. Blood glucose was measured at baseline and at 15, 30, 45, 60, 90, and 120 min after injection using a One Touch Ultra glucometer.
Anti-dsDNA antibody ELISA.
Serum titers of anti-dsDNA antibodies were measured using the protocol described by Shivakumar et al. (35). Nunc MaxiSorp plates were blocked with mBSA in 1× PBS (0.1 mg/ml) at 37°C for 30 min. The plate was then washed with PBS and coated with 50 μg/ml dsDNA in PBS at 37°C for 30 min. The plate was washed twice with PBS and blocked overnight at 4°C with blocking buffer (3% BSA, 3 mM EDTA, and 0.1% gelatin in PBS). Plates were washed twice with PBS. Serum was diluted 1:1,000 in serum diluent (2% BSA, 3 mM EDTA, 0.05% Tween 20 in PBS) and added to the plate and incubated 2 h at room temperature (RT) on an orbital shaker. The plate was washed twice in PBS-Tween and twice in PBS. IgG-HRP (Promega, Madison, WI) was diluted 1:5,000 in secondary diluent (1% BSA and 0.05% Tween in PBS), added to the plate and incubated overnight at 4°C on an orbital shaker. The plate was washed twice with PBS-Tween and twice with PBS, and OptEIA TMB Substrate (BD Biosciences, San Diego, CA) was added to plate and allowed to incubate. Reaction was quenched with 1 M phosphoric acid, and the plate was promptly read at 450 nm.
Islet perifusion assay.
Pancreatic islets were isolated and assessed as previously described (5, 41, 46). Briefly, the pancreas was digested in a solution of collagenase P in Hank's balanced saline solution (HBSS) using a wrist-action shaker. Digestion was quenched with ice-cold 10% FCS-HBSS. The digest was washed, and islets were hand-picked under microscopic guidance. Islet insulin secretion was analyzed in a dynamic cell perifusion system. The perifusion medium was Dulbecco's modified Eagle's medium supplemented (GIBCO) with 10 mM HEPES, 26 mM NaHCO3 and 0.1% BSA. Fifty islet equivalents were placed in a chamber and washed under baseline media for 30 min prior to the experiment. Islets were then perifused for 9 min with 5.6 mM glucose (Sigma, D16), followed by 30 min with 16.7 mM glucose, 21 min with 5.6 mM glucose, 9 min with 16.7 mM glucose plus 50 μM isobutylmethylxanthine (IBMX, Sigma, I5879-1G, St. Louis, MO), 21 min with 5.6 mM glucose, 9 min with 20 mM KCl, and 21 min with 5.6 mM glucose. The effluent fractions were collected at 3-min intervals using an automatic fraction collector. The insulin concentration of each fraction was measured by radioimmunoassay (RI-13K, Millipore).
Immunoglobulin ELISA.
Serum IgG was measured using a conventional sandwich ELISA. Briefly, MaxiSorp ELISA plates (Nalge Nunc, Rochester, NY) were coated overnight with 0.5 μg/ml IgG heavy and light chain (Southern Biotech, Birmingham, AL). Plates were blocked for 1 h with 10% FBS in 1× PBS, and serum samples or mouse reference serum (Bethyl Laboratories, Montgomery, TX) were incubated overnight at 4°C. Detection antibody [0.5 g/ml biotin-conjugated anti-IgM, -IgG1, -IgG2c (Southern Biotech, Birmingham AL), or anti-IgG HRP-conjugated antibody (1:2,500) (Promega, Madison, WI)] was incubated 2 h at RT. Streptavidin-HRP (1:2,500; Sigma) was incubated in IgM, IgG1, or IgG2c wells for 1 h at RT before plates were developed with OptEIA TMB Substrate (BD Biosciences).
Tissue preparation.
Perigonadal fat pads were minced and digested for 30 min at 37°C with agitation in 1 mg/ml collagenase in HBSS (Sigma). Digested tissue was passed through a 40-μm filter, and leukocytes were isolated from the interface of a 40%/60% Percoll gradient (GE Healthcare, Piscataway, NJ). Livers were collected and crushed through a 40-μm filter, and leukocytes were isolated from the interface of a 40%/60% Percoll gradient.
Flow cytometry.
Single-cell suspensions of liver mononuclear cells and stromal vascular cells were isolated as described above. To minimize nonspecific binding of flow antibodies, cells were blocked for 15 min at RT with a 1:200 dilution of Fc receptor block (BD Biosciences) in a FACS buffer consisting of 1× HBSS, 1% BSA, 4.1663 mM sodium bicarbonate, and 3.0765 mM sodium azide. The following fluorescently labeled antibodies were diluted 1:200 in FACS buffer and incubated with the cells for 45 min at 4°C: CD19-PECy7, B220-A450, TCRβ-PECy7, IgG-FITC, IgM-PE, IgD-APC, CD80-APC, F4/80-PECy7, CD8-FITC, and CD4-APCCy7 (BD Biosciences). The labeled cells were washed three times with FACS buffer and fixed overnight at 4°C in a solution of 2% paraformaldehyde in PBS. Labeled cells were analyzed on a MACSquant seven-color flow cytometer (Miltenyi Biotec, Bergisch Gladbach, Germany) and data were analyzed with FCS Express 4 (De Novo Software, Los Angeles, CA).
Immunoblotting.
Mice were fasted on paper bedding for 4 h and then injected with 1 U/kg body wt insulin. Fifteen minutes later, mice were euthanized, and liver, soleus, gastrocnemius, and perigonadal fat pads were removed and freeze-clamped in liquid nitrogen. Fat was homogenized in a solution of 50 mM Tris·HCl, pH 7.5, 1 mM EDTA, 1 mM EGTA, 10% glycerol, 1% Triton X-100, 1 mM DTT, 1 mM PMSF, 5 mg/ml protease inhibitor, 50 mM NaF, and 5 mM sodium pyrophosphate and centrifuged for 10 min at 13,000 rpm at 4°C. The lysate was run on a 10% SDS-PAGE gel and transferred to a nitrocellulose membrane. The membrane was probed with Akt primary rabbit antibody (1:1,000; Cell Signaling, Danvers, MA) or p-Akt primary rabbit antibody (1:1,000; Cell Signaling) and incubated overnight at 4°C. The membrane was then incubated for 1 h at RT with anti-β-actin antibody (1:1,000; Sigma Aldrich) followed by incubation with goat anti-rabbit 800LT-conjugated secondary antibody (1:5,000; Li-Cor, Lincoln, NE) and goat anti-mouse 680LT-conjugated secondary antibody (1:20,000) and for 1 h at RT. Gels were scanned using a Odyssey Infrared Imaging System (Li-Cor), and bands were quantified using Odyssey version 3.0 software (Li-Cor).
Serum cholesterol, serum triglycerides, and liver triglycerides.
Mice were fasted on paper bedding for 4 h, and blood was collected via the retroorbital sinus under isoflurane anesthesia. Blood was allowed to clot for 20 min and was subsequently spun at 13,000 rpm for 20 min at 4°C. Serum was collected, protease inhibitor cocktail was added, and the samples were stored at −80°C. Serum was thawed and diluted 1:100 with 2H2O, and triglyceride and cholesterol were measured using a cholesterol and triglyceride enzymatic assay according to the manufacturer's protocol (Cliniqa, San Marcos, CA).
Lipids were extracted from the liver by the method of Folch-Lees (14). Individual lipid classes were separated by thin-layer chromatography and visualized by rhodamine 6G. Triglycerides were scraped from the plates and methylated using BF3-methanol as described by Morrison and Smith (26). The methylated fatty acids were extracted and analyzed by gas chromatography. Gas chromatographic analyses were carried out on an Agilent 7890A gas chromatograph equipped with flame ionization detectors and a capillary column (Supelco, Bellefonte, PA). Helium was used as a carrier gas, and fatty acids were identified by comparing the retention times to those of known standards.
Adipocyte size measurement.
Perigonadal fat pads were collected and fixed in PBS containing 10% formalin. Fat was embedded in paraffin, sectioned, and stained with hematoxylin and eosin. Adipocyte size was quantified by capturing four independent fields per blinded slide and measuring adipocyte area using ImageJ software (National Institutes of Health, Bethesda, MD). Average adipocyte size was calculated and expressed as micromerters squared per adipocyte.
Multiplex adipokine assay and C-peptide ELISA study.
mice were fasted for 4 h on paper bedding, and blood was collected from the retroorbital sinus under isoflurane anesthesia. Blood was allowed to clot for 20 min and was subsequently spun at 13,000 rpm for 20 min at 4°C. Serum was collected, protease inhibitor cocktail was added, and the samples were stored at −80°C. A Milliplex mouse adipokine assay (Millipore, Billerica, MA) was used to measure insulin, leptin, resistin, IL-6, and TNFα according to the manufacturer's instructions. Serum C-peptide was measured using a Millipore C-Peptide 2 ELISA kit according to the manufacturer's instructions.
Statistics.
Statistical significance for glucose toerance test data was calculated with a two-way ANOVA for repeated measures. All other significance was calculated with a Student's t-test comparing mice within diet groups. All calculations were completed with GraphPad Prism software (GraphPad Software, La Jolla, CA). Unless otherwise noted, all data are expressed as means ± SE.
RESULTS
B6.SLE mice are prone to autoimmunity.
Increased production of pathogenic anti-dsDNA antibodies and splenomegaly are hallmarks of autoimmune disease in B6.SLE mice. Five-week-old male B6 and B6.SLE mice were placed on LFD or HFD. After 20 wk of diet feeding, both anti-dsDNA antibody titers (Fig. 1A) and spleen weight (Fig. 1B) were significantly increased in B6.SLE mice relative to their respective controls. Interestingly, splenomegaly was more pronounced in HFD-fed B6.SLE mice than LFD-fed B6.SLE mice, but there was no difference in anti-dsDNA antibody titers between B6.SLE mice of each diet group. Although the markers of autoimmunity were significantly increased, there was no increase mortality in B6.SLE mice after 20 wk of feeding compared with B6 controls (data not shown).
Fig. 1.
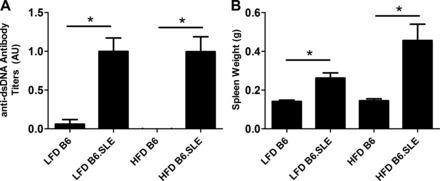
B6.SLE mice are prone to autoimmunity. A: 5-wk-old B6 (C57Bl/6) and B6.SLE male mice (B6 mice with systemic lupus erythematosus) were fed a low-fat diet (LFD; 10% kcal from fat) or high-fat diet (HFD; 45% kcal from fat) for 20 wk, and blood was collected via retroorbital sinus. Anti-dsDNA antibody titers were measured via ELISA and normalized to stock control serum (n = 6–15/group). B: 5-wk-old B6 and B6.SLE male mice were fed LFD or HFD for 20–25 wk. Spleen weight was measured after death (n = 6–15/group). *P < 0.005 by Student's t-test.
Weight and body composition of B6.SLE mice vary from those of B6 controls.
Total body mass was measured weekly after LFD and HFD was initiated (Fig. 2A, left). The baseline weights of B6.SLE mice in both diet groups were higher than in their respective controls and remained elevated for the duration of the experiment. Weight gain, as expressed as change in body weight from baseline (Fig. 2A, right), was not significantly different between B6 and B6.SLE mice in each diet group. Lean body mass and adipose tissue mass were assessed in all groups after 20 wk of feeding (Fig. 2B). Adiposity was not significantly different between LFD-fed B6.SLE and B6 mice at this time point. However, lean body mass was significantly higher in LFD- and HFD-fed B6.SLE groups compared with B6 controls and partially accounted for the increased body weight observed in LFD-fed B6.SLE mice in Fig. 2A. A similar trend in lean body mass was observed in female B6.SLE mice fed HFD or LFD for 27–30 wk (data not shown).
Fig. 2.
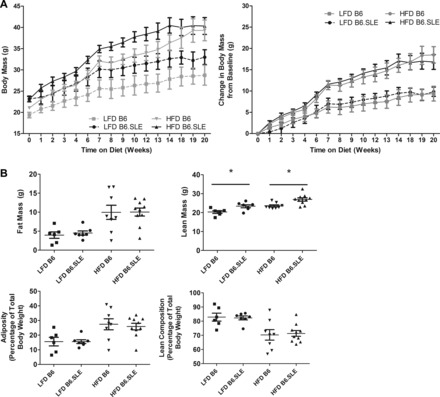
Measurement of body mass and composition of B6 and B6.SLE mice. A: 5-wk-old B6 and B6.SLE male mice were fed LFD or HFD, and total body weight was measured weekly (n = 3–5/group). Data are expressed as total body mass (left) and change in body mass from baseline (right). B: 5-wk-old B6 and B6.SLE male mice were fed LFD or HFD, and body composition was measured with a Bruker MiniSpec NMR analyzer after 20 wk of feeding (n = 5–10/group) *P < 0.05 by Student's t-test.
Glucose homeostasis and IR signaling is altered in B6.SLE mice.
Glucose tolerance tests were conducted in male B6.SLE and B6 mice after 20 wk of LFD or HFD feeding (Fig. 3, A and B). Glucose intolerance was significantly higher in B6.SLE mice than in their respective B6 controls in the LFD-fed groups when data were expressed as absolute blood glucose level (Fig. 3A) or as area under the curve (Fig. 3B). Interestingly, the glucose curve of LFD-fed B6.SLE mice approached the curve of HFD-fed B6 mice. In addition, female B6.SLE mice fed HFD had significantly higher glucose intolerance than B6 controls after 27–30 wk of feeding (data not shown).
Fig. 3.
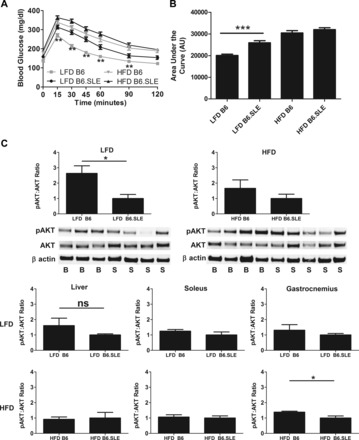
Glucose homeostasis and adipose tissue insulin receptor signaling is impaired in B6.SLE mice. Five-week-old B6 and B6.SLE male mice were fed LFD or HFD for 20 wk. After 5–6 h of fasting, mice were injected with 1.25 g glucose/kg lean body wt, and blood glucose was measured using a One Touch Ultra glucometer (n = 16–25 mice/group in 4 independent experiments). Data are expressed as blood glucose over time (A) or area under the glucose excursion curve (B). **P < 0.0001 between LFD-fed B6.SLE and B6 mice by two-way ANOVA. ***P < 0.0001 by Student's t-test. C: after 20 wk of HFD or LFD feeding, mice were fasted for 4 h and then injected with 1 U/kg lean body wt insulin. Fifteen minutes later, mice were euthanized, and liver, gastrocnemius, soleus, and perigonadal fat were removed and freeze-clamped in liquid nitrogen. Tissue lysate was analyzed by Western blot with Akt and phospho- (p-)Akt antibodies. Data are expressed as integrated intensity of Akt or the ratios of the integrated intensity of p-Akt and Akt (n = 3–5 mice/group). Values are expressed as means ± SE. *P < 0.04 by Student t-test; n.c., not significant.
To determine whether insulin signaling is disrupted in metabolically active tissues in B6.SLE mice, Western blotting was used to measure the p-Akt-to-Akt ratio in the perigonadal fat pads, liver, soleus muscle, and gastrocnemius muscle. Akt is a critical component of the insulin signaling pathway and becomes phosphorylated after the insulin receptor is ligated, ultimately causing translocation of the GLUT4 glucose transporter to the cell surface. The p-Akt-to-total-Akt ratio was significantly reduced in the adipose tissue of LFD-fed B6.SLE mice relative to B6 controls (Fig. 3C), indicating that insulin signaling is impaired in the adipose tissue of LFD-fed SLE mice. No significant difference in Akt phosphorylation was seen in LFD-fed strains in the liver or gastrocnemius or soleus muscle, although trends toward lower ratios in B6.SLE mice were observed. No significant differences in p-Akt ratios were seen between strains in any of the tissues in HFD-fed groups.
B6.SLE islets have increased insulin secretion.
To determine whether the observed glucose intolerance is due to impaired β-cell function, pancreatic islets were isolated from LFD-fed B6 and B6.SLE mice, and responses to several β-cell secretagogues were measured in an islet perifusion system. Figure 4A shows that insulin secretion was significantly increased in the islets of LFD-fed B6.SLE mice in response to 16.7 mM glucose, 16.7 mM glucose + 50 μM IBMX, and 20 mM KCl, ruling out β-cell defects in glucose sensing, metabolism, or granule exocytosis in LFD-fed B6.SLE mice.
Fig. 4.
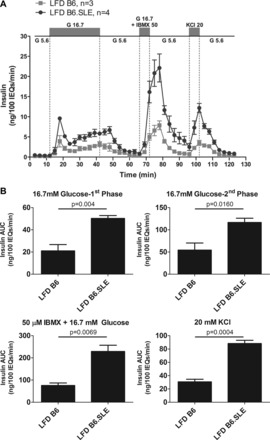
B6.SLE pancreatic islets have increased insulin secretion. Male mice were fed LFD for 20 wk before being euthanized. Function of size-matched pancreatic islets was assessed in a cell perifusion apparatus in response to several β-cell secretagogues. Data are expressed as ng insulin/100 islet equivalents (IEQs) per minute (A) or area under the curve (AUC) for each secretagogue (B) (n = 3–4/group). Statistical analysis was performed by Student's t-test.
Circulating adipokines and cytokines are not different in LFD-fed B6.SLE mice.
To determine whether circulating adipokines and cytokines contribute to glucose intolerance in B6.SLE mice, fasting levels of leptin, resistin, IL-6, TNFα, and insulin were measured using a cytokine bead array, and fasting glucose was measured using a hand-held glucometer. As seen in Fig. 5A, no differences in fasting insulin or fasting glucose were observed between strains in the LFD-fed groups, and there was a nonsignificant trend toward higher glucose and insulin in HFD-fed B6 mice relative to HFD fed B6.SLE mice. Insulin clearance was estimated by measuring the ratio of fasting serum insulin to fasting serum C-peptide 2 in LFD-fed mice. C-peptide 2 is cleaved from the proinsulin molecule during the formation of insulin (29). C-peptide 2 is cleared in the kidney (47), and insulin is cleared primarily in the liver (9), and the ratio of these two molecules can be used to estimate hepatic clearance of insulin. There was no difference in the C-peptide-to-insulin ratio between B6.SLE and B6 mice, which suggests that SLE disease does not affect the rate of insulin clearance in B6.SLE mice (Fig. 5A, right).
Fig. 5.
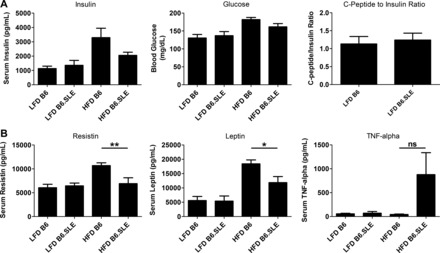
Fasting adipokines, cytokines, insulin, and glucose in serum of B6.SLE mice. Male mice were fed LFD or HFD for 20 wk before being euthanized. Mice were fasted for 4 h, and blood was collected via retroorbital sinus. Glucose levels were measured with a hand-held glucometer, and C-peptide was measured with a sandwich ELISA. Insulin, resistin, leptin, and TNFα were measured with a multiplex adipokine assay (n = 8–11/group). *P < 0.02 by Student's t-test; **P < 0.009 by Student's t-test.
Levels of serum resistin and leptin in LFD-fed groups were indistinguishable, and levels of resistin and leptin were significantly lower in HFD-fed B6.SLE mice relative to HFD-fed B6 controls (Fig. 5B). There was a trend toward higher TNFα in HFD-fed B6.SLE mice relative to controls, but no increase in serum TNFα was seen in LFD-fed B6.SLE mice. IL-6 levels were below the level of assay detection in all groups. Collectively, these results suggest that the glucose intolerance and adipose tissue IR observed in LFD-fed mice is not instigated by adipokines or cytokines normally associated with IR and may result from SLE-specific factors.
Adipocyte size is increased in B6.SLE mice.
Increased adipocyte size has been correlated with glucose intolerance and adipose tissue insulin resistance. To determine whether B6.SLE mice have increased adipocyte size, we measured adipocyte size in paraffin-embedded adipose tissue. As seen in Fig. 6, average adipocyte size was significantly greater in LFD-fed B6.SLE mice than in B6 controls. There was no difference in average adipocyte size between HFD-fed B6.SLE mice and their controls.
Fig. 6.
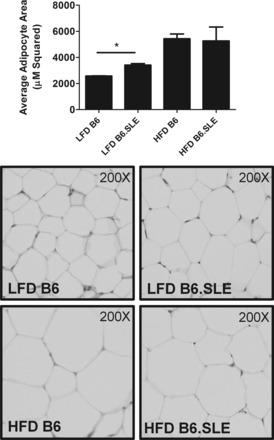
Measurement of adipocyte area. Male mice were fed LFD or HFD for 20 wk before being euthanized. Perigonadal fat pads were fixed, sectioned, and stained with H&E, and adipocyte area was quantified (n = 3–4/group). *P < 0.0005 by Student's t-test.
Serum cholesterol, serum triglyceride, and liver triglyceride are significantly reduced in B6.SLE mice.
We measured serum cholesterol and triglycerides in study mice to determine whether lipid homeostasis is perturbed in B6.SLE mice. As seen in Fig. 7A, serum cholesterol and triglyceride levels were significantly reduced in HFD- and LFD-fed B6.SLE mice relative to their respective controls. Liver triglyceride content (Fig. 7B) was significantly decreased in HFD-fed B6.SLE mice relative to B6 controls and there was a nonsignificant trend toward reduced triglyceride content in the livers of LFD-fed B6.SLE mice.
Fig. 7.

Measurement of serum triglyceride and cholesterol. A: male mice were fed LFD or HFD for 20–25 wk before being euthanized. Blood was collected via retroorbital sinus, and serum cholesterol and triglyceride were measured using a commercially available enzymatic assay (n = 8–11 mice/group). *P < 0.005 by Student's t-test. B: male mice were fed HFD or LFD for 20–25 wk before being euthanized. Livers were harvested, and triglyceride content was measured by gas chromatography (n = 4–10/group). *P < 0.05 by Student's t-test.
Leukocyte content in the stromal vascular fraction varies in SLE mice.
Cells of the adaptive and innate immune systems have been associated with adipose tissue dysfunction in mouse models of obesity. To examine the immune compartment in study mice, we used flow cytometry to assess the cell content of the stromal vascular fraction (SVF) in LFD- and HFD-fed mice after 20 wk of HFD or LFD feeding. No significant difference was seen in the percentage of total CD19+ B cells in the SVF (Fig. 8A) in either diet group. There were no differences in antigen-presenting cell content of the SVF between strains within each diet group as measured by F480, a marker of both macrophages and dendritic cells (Fig. 8B). These findings indicate that F480+ cell infiltration, known to be associated with IR in obese mice, is not correlated with glucose intolerance and adipose insulin resistance in B6.SLE mice. TCRβ+ T cell content in the SVF of HFD- and LFD-fed B6.SLE was significantly higher than their respective B6 controls (Fig. 8C). Additionally, the proportion of CD8+ T cells, but not CD4+ T cells, in LFD-fed B6.SLE mice was significantly increased relative to controls and exceeded the percentages of CD8+ T cells in HFD-fed B6 mice (Fig. 8, D and E). This increase in CD8+ T cell parallels the results of Nishimura et al. (27), in which HFD-feeding caused an increase in CD8+ T cells that correlated with IR in their study.
Fig. 8.
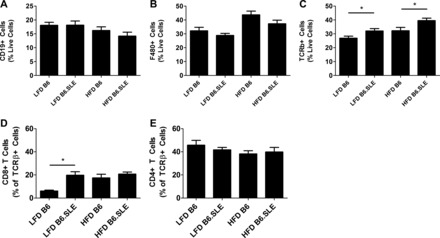
Flow cytometry analyses of the stromal vascular fraction (SVF) of B6 and B6.SLE mice fed LFD or HFD. Mice were fed LFD or HFD for 20–25 wk before being euthanized. A–E: SVF cells were isolated by digesting perigonadal fat pads in collagenase followed by Percoll gradient centrifugation. Cells were stained and analyzed using conventional flow cytometry techniques (n = 5–8 mice/group). *P < 0.05 by Student's t-test.
SVF B cells in B6.SLE mice are skewed toward IgG production.
Although no quantitative differences were observed in the CD19+ B cell population in study mice, we hypothesized that B6.SLE mice were predisposed to develop qualitative differences in the SVF resident B cell population. Previous studies by Winer et al. (44) have shown that B cells contribute to adipose tissue IR through production of pathogenic IgG antibodies. We investigated whether SVF resident B cells had undergone class-switch recombination by using flow cytometry to quantify IgD, IgM, and IgG expression on CD19+ B cells (Fig. 9A). The percentage of class-switched IgG+ B cells in B6.SLE mice was significantly higher than that of B6 controls in each diet group. Furthermore, there were significantly higher percentages of IgG+ B cells in the SVF of LFD- and HFD-fed B6.SLE female mice (data not shown). No differences in IgG+ B cell ratios were observed in the liver, indicating that these changes are specific to the gonadal fat pad. To determine whether systemic Ig levels were altered in B6.SLE mice, circulating total IgG, IgG1, IgG2c, and IgM were measured in serum collected from male mice fed HFD or LFD for 20–26 wk (Fig. 9B). LFD- and HFD-fed B6.SLE mice had significantly higher circulating total IgG, IgG1, IgG2c, and IgM than their respective B6 controls. Female mice also had similarly increased levels of IgG and IgM compared with control mice (data not shown). Perigonadal fat pad lysates were probed for IgG heavy chain to determine whether SLE mice had higher adipose tissue IgG deposition than B6 controls. As seen in Fig. 9C, there was significantly more IgG heavy chain in the perigonadal fat pads of LFD-fed B6.SLE mice compared with LFD-fed B6 controls. Furthermore, there was significantly more IgG deposition in the livers of LFD- and HFD-fed B6.SLE mice relative to their B6 controls. Finally, the expression of the activation marker CD80 was significantly increased in SVF B cells of LFD-fed B6.SLE mice (Fig. 9D). Overall, the data show that SVF B cells are skewed toward a proinflammatory IgG response, that circulating IgG1 levels are elevated in the serum of B6.SLE mice, and that there is increased IgG deposition in the fat pads of B6.SLE mice.
Fig. 9.
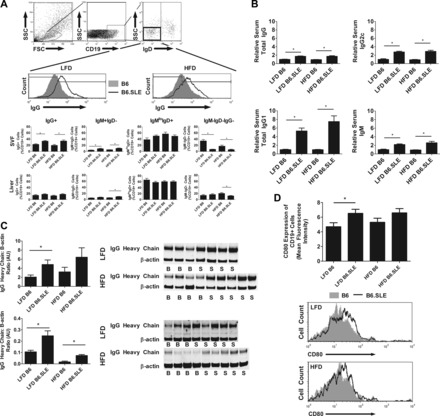
SVF B cells in B6.SLE mice are skewed toward IgG production and show higher expression of an activation marker. A: mice were fed LFD or HFD for 20–25 wk before being euthanized. SVF cells and hepatic mononuclear cells were isolated by digesting perigonadal fat pads in collagenase followed by Percoll gradient centrifugation. Cells were stained and analyzed using conventional flow cytometry techniques (n = 6–8 mice/group). *P < 0.05 by Student's t-test. B: male mice were fed LFD or HFD for 20–26 wk and serum levels of IgG1, IgG2c, IgM, and total Ig were measured using conventional sandwich ELISA. ELISA absorbances were normalized to LFD-fed B6 controls (n = 6–16/group). *P < 0.0005 by Student's t-test. C: perigonadal fat pads and liver were harvested from male B6 and B6.SLE mice. Total tissue lysate was applied to an SDS-PAGE gel and a Western blot was completed using anti-IgG heavy chain and β-actin antibodies. Data are expressed as the ratio of the integrated intensity of the IgG heavy chain band to the integrated intensity of the β-actin band (n = 6–8/group in fat and 3–6/group in liver). *P < 0.05 by Student's t-test. D: mice were fed LFD or HFD for 20–25 wk before being euthanized. SVF cells were isolated by digesting perigonadal fat pads in collagenase followed by Percoll gradient centrifugation. Cells were stained for CD80 and analyzed using conventional flow cytometry techniques (n = 5–8 mice/group). *P < 0.05 by Student's t-test.
DISCUSSION
In this report, we show for the first time that B6.SLE mice develop more severe glucose intolerance and adipose tissue insulin resistance than B6 controls and that B6.SLE B cells have a diabetogenic immunophenotype characterized by increased circulating IgG, increased IgG expression on B cells, and increased deposition of IgG heavy chain in white adipose tissue (15, 44). These changes were observed in LFD-fed B6.SLE mice, indicating that SLE disrupts glucose metabolism in the context of a LFD. Adiposity did not vary significantly between B6.SLE mice and their controls, indicating that lupus-related immune dysregulation, and not adipose tissue accumulation, causes disruption of glucose homeostasis in mice. Assessment of pancreatic islet function showed increased glucose-stimulated insulin secretion in B6.SLE islets. However, there was not a concomitant increase in fasting serum insulin in B6.SLE mice, which could be explained by either increased insulin clearance or lower islet cell mass. Estimation of insulin clearance with the C-peptide-to-insulin ratio (Fig. 5A, right) showed no difference between mouse strains. Collectively, these data suggest that B6.SLE mice may be compensating for lower islet cell mass by increasing islet secretory capacity. Islet cell mass was not measured, so we cannot confirm that there is a defect in islet cell mass in B6.SLE mice in the present study.
These findings contrast with the earlier mouse studies of Ryan et al. (32) in the NZW/F1 model of lupus, in which NZW/F1 mice were shown to have hyperinsulinemia, hyperleptinemia, and higher glucose intolerance than control parental strain mice. Our study differs from that of Ryan et al. in several key areas. First, the NZW/F1 mice in the Ryan et al. study reported significantly larger white adipose depots than controls. In some cohorts, NZW/F1 mice had twice as much visceral adipose tissue as controls, making it difficult to determine whether the metabolic differences observed were due to changes in body composition or the immune dysregulation observed in the setting of SLE. Our study shows that B6.SLE mice have decreased glucose tolerance and adipose tissue insulin resistance despite having similar adipose tissue mass and increased lean mass relative to controls.
Second, given the newly characterized importance of the adaptive immune system in metabolic syndrome and the critical role of the adaptive immune system in the pathogenesis of SLE, our studies focused on the immunophenotype of the SVF lymphocyte compartment. We observed significantly increased percentages of T cells in the SVF of LFD-fed B6.SLE mice relative to controls. Although no differences in total B cell proportions were detected in B6.SLE mice on either diet, there were several qualitative differences in the B cell compartment. Specifically, the proportion of IgG-positive B cells was significantly increased in both diet groups, and the activation marker CD80 was increased on B cells in LFD-fed B6.SLE mice. Circulating IgG was increased in the periphery of B6.SLE mice on both diets, and there was a significant increase in IgG deposition in the adipose tissue of B6.SLE mice. These results are consistent with the diabetogenic B cell immunophenotype described by Winer et al. (44), in which IgG antibody secreted by B cells in the context of HFD contributed to insulin resistance.
Adipocyte hypertrophy in visceral adipose tissue has been associated with insulin resistance and hyperlipidemia. Although we observed increased adipocyte size in LFD-fed B6.SLE mice relative to controls, there were decreases in serum triglyceride and cholesterol in B6.SLE mice. We have previously observed reduced triglyceride and cholesterol levels in studies of B6.SLE mice (4, 36), and other groups have shown similar changes in serum lipids in patients with rheumatoid arthritis and other autoimmune diseases (16, 21, 31, 34, 37). The mechanism that causes this phenomenon is not known, but it may result from disruption of lipid homeostasis by the chronic inflammation present in autoimmune disease (37).
Fasting levels of glucose, insulin, leptin, resistin, TNFα, and IL-6 were not significantly different between LFD-fed B6.SLE mice and their controls. This may indicate that the metabolic phenotype becomes unmasked only after a challenge with glucose or insulin or that the phenotype is apparent only in the fed state. Levels of glucose, insulin, leptin, and resistin in the fed state were been measured in the current study. Furthermore, we observed worsened glucose tolerance and adipose tissue insulin resistance in LFD-fed B6.SLE mice (Fig. 3C), which was not accompanied by significant insulin resistance in the liver or skeletal muscle of B6.SLE mice. Adipose tissue-specific impairment of insulin signaling has been shown to ameliorate glucose intolerance in fat-specific insulin receptor knockout (FIRKO) mice (3). Within this paradigm, we would not anticipate that the LFD-fed B6.SLE mice would have significantly worsened glucose tolerance. However, it is possible that nonclassical, SLE-mediated effects on adipose tissue may be causing the observed metabolic impairment in B6.SLE mice. One molecule associated with both SLE and impairment of adipocyte function is B cell activating factor (BAFF). We observed increased levels of circulating BAFF in B6.SLE mice, and SVF resident B cells in these mice had elevated expression of the BAFF receptor (data not shown). BAFF is a growth factor that promotes proliferation, maturation, and antibody production of B cells. Elevated levels of circulating BAFF have been observed in the context of SLE and is associated with increased disease severity and production of pathogenic autoantibodies (7). In addition, adipocytes have been shown to express the BAFF receptor, and BAFF has been shown to specifically disrupt glucose homeostasis both in vitro and in vivo (15). Future studies will focus on the role of BAFF and IgG in the pathogenesis of metabolic disease in the context of B6.SLE mice.
Adiposity of B6.SLE mice did not differ significantly from that of B6 mice. Although early studies showed higher BMI in cohorts of lupus patients (19, 20), subsequent studies failed to show significant differences in BMI between SLE patients and healthy controls (22, 28, 38, 39). In one of those studies, Magadmi et al. (22) reported that SLE patients had significantly worsened insulin resistance than healthy control patients, but body composition did not differ significantly between SLE and control groups, and SLE patients were only moderately overweight (BMI 26.6 kg/m2). The observations of Magadmi et al. have been corroborated by several other groups (1, 27, 36). Therefore, we propose that the LFD-fed B6.SLE mice are a very suitable model of SLE-associated metabolic disease. Unexpectedly, reductions in glucose tolerance and insulin signaling were not observed in HFD-fed B6.SLE mice relative to B6 controls. It is possible that HFD feeding “saturates” the phenotype of B6.SLE mice, making it difficult to detect differences in glucose tolerance and insulin signaling between strains. Subsequent studies will focus on LFD-fed B6.SLE mice.
In conclusion, we have shown that B6.SLE mice fed LFD have significantly worsened glucose tolerance and adipose tissue insulin resistance than B6 controls. This B6.SLE glucose intolerance occurs in the presence of a diabetogenic B cell environment which is characterized by the presence of an increased number of IgG-producing B cells and IgG depositions in the white adipose tissue as well as higher levels of circulating IgG. The presence of metabolic dysfunction may exacerbate other SLE comorbidities such as cardiovascular disease. Although it is clear that SLE patients and the B6.SLE mouse model suffer disproportionately from CVD (1, 36), the causes of this disparity have not been completely elucidated. Insulin resistance has higher prevalence in the SLE population, and it is conceivable that it could be a contributing factor in the high CVD burden in these patients. Our current findings suggest potential mechanisms that give rise to metabolic disease in SLE patients and form the foundation for additional studies that could lead to greater understanding of the pathogenesis of SLE comorbidities.
GRANTS
The work presented in this study was supported by NIH Grants R01 HL-088364 and R01 HL-089310 (to A. S. Major), a predoctoral fellowship 5F31 DK-83193 (to C. L. Gabriel), Medical Scientist Training Program Training Grant T32 GM-07347 (to C. L. Gabriel), an AMA Foundation Seed Grant (to C. L. Gabriel), a Scientist Development Grant from the AHA (to Y. V. Mendez-Fernandez), and a Mentored Scientist Development Award K01 HL-108865 from the National Heart, Lung, and Blood Institute (to Y. V. Mendez-Fernandez).
DISCLOSURES
No conflicts of interest, financial or otherwise, are declared by the author(s).
AUTHOR CONTRIBUTIONS
C.L.G. and A.S.M., conception and design of research; C.L.G.,P.B.S., Y.V.M.F., A.J.Y., A.M.Y., and A.S.M. performed experiments; C.L.G. and A.S.M. analyzed data; C.L.G. and A.S.M interpreted results of experiments; C.L.G. and A.S.M. prepared figures; C.L.G. and A.S.M. drafted manuscript; C.L.G., P.B.S., Y.V.M.F., A.J.Y., A.M.Y. A.S.M. edited and revised manuscript; C.L.G., P.B.S., Y.V.M.F., A.J.Y., A.M.Y. A.S.M. approved final version of manuscript.
ACKNOWLEDGMENTS
We thank the Vanderbilt Mouse Metabolic Phenotyping Center (funded by Grant U24 DK-59637), Vanderbilt Islet Procurement and Analysis Core of Diabetes Research and Training Center (supported by Grant DK-20593 to Vanderbilt DRTC), the Vanderbilt Center for Human Genetics Research, and the Vanderbilt Cell Biology Resource Cores for their expertise and the use of shared resources. We thank David Wasserman, PhD, Alyssa Hasty, PhD, and Marcela Brissova, PhD, for help in data interpretation.
REFERENCES
- 1. Asanuma Y, Oeser A. Premature coronary-artery atherosclerosis in systemic lupus erythematosus. N Engl J Med 349: 2407–2415, 2003 [DOI] [PubMed] [Google Scholar]
- 2. Baker JF, Morales M, Qatanani M, Cucchiara A, Nackos E, Lazar MA, Teff K, von Feldt JM. Resistin levels in lupus and associations with disease-specific measures, insulin resistance, and coronary calcification. J Rheumatol 38: 2369–2375, 2011 [DOI] [PMC free article] [PubMed] [Google Scholar]
- 3. Blüher M, Michael M, Peroni O, Ueki U, Carter N, Kahn BB, Kahn CR. Adipose tissue selective insulin receptor knockout protects against obesity and obesity-related glucose intolerance. Dev Cell 3: 25–38, 2002 [DOI] [PubMed] [Google Scholar]
- 4. Braun a N, Wade NS, Wakeland EK, Major AS. Accelerated atherosclerosis is independent of feeding high fat diet in systemic lupus erythematosus-susceptible LDLr(−/−) mice. Lupus 17: 1070–1078, 2008 [DOI] [PMC free article] [PubMed] [Google Scholar]
- 5. Brissova M, Fowler M, Wiebe P, Shostak A, Shiota M, Radhika A, Lin PC, Gannon M, Powers AC. Intraislet endothelial cells contribute to revascularization of transplanted pancreatic islets. Diabetes 53: 1318–1325, 2004 [DOI] [PubMed] [Google Scholar]
- 6. Bruce IN. “Not only . . . but also”: factors that contribute to accelerated atherosclerosis and premature coronary heart disease in systemic lupus erythematosus. Rheumatology 44: 1492–1502, 2005 [DOI] [PubMed] [Google Scholar]
- 7. Cancro MP, Cruz DPD, Khamashta MA, D'Cruz DP. The role of B lymphocyte stimulator (BLyS) in systemic lupus erythematosus. J Clin Invest 119: 1066–1073, 2009 [DOI] [PMC free article] [PubMed] [Google Scholar]
- 8. Chung C, Oeser A. Inflammation associated insulin resistance: Differential effects in rheumatoid arthritis and systemic lupus erythematosus define potential mechanisms. Arthritis Rheumatism 58: 2105–2112, 2008 [DOI] [PMC free article] [PubMed] [Google Scholar]
- 9. Duckworth WC, Bennett RG, Hamel FG. Insulin degradation: progress and potential. Endocr Rev 19: 608–624, 1998 [DOI] [PubMed] [Google Scholar]
- 10. Eckel RH, Alberti KGMM, Grundy SM, Zimmet PZ. The metabolic syndrome. Lancet 375: 181–183, 2010 [DOI] [PubMed] [Google Scholar]
- 11. Escárcega RO, García-Carrasco M, Fuentes-Alexandro S, Jara LJ, Rojas-Rodriguez J, Escobar-Linares LE, Cervera R. Insulin resistance, chronic inflammatory state and the link with systemic lupus erythematosus-related coronary disease. Autoimmun Rev 6: 48–53, 2006 [DOI] [PubMed] [Google Scholar]
- 12. Feldt JV. The cardiovascular threat of lupus. Nat Clin Pract 4: 505–505, 2008 [DOI] [PubMed] [Google Scholar]
- 13. Feuerer M, Herrero L, Cipolletta D, Naaz A, Wong J, Nayer A, Lee J, Goldfine AB, Benoist C, Shoelson S, Mathis D. Lean, but not obese, fat is enriched for a unique population of regulatory T cells that affect metabolic parameters. Nat Med 15: 930–939, 2009 [DOI] [PMC free article] [PubMed] [Google Scholar]
- 14. Folch J, Lees M, Stanley GHS. A simple method for the isolation and purification of total lipides from animal tissues. J Biol Chem 226: 497–509, 1957 [PubMed] [Google Scholar]
- 15. Hamada M, Abe M, Miyake T, Kawasaki K, Tada F, Furukawa S, Matsuura B, Hiasa Y, Onji M. B cell-activating factor controls the production of adipokines and induces insulin resistance. Obesity (Silver Spring, Md) 19: 1915–1922, 2011 [DOI] [PubMed] [Google Scholar]
- 16. Iannello S, Cavaleri A, Milazzo P, Cantarella S, Belfiore F. Low fasting serum triglyceride level as a precocious marker of autoimmune disorders. Med Gen Med 5: 20, 2003 [PubMed] [Google Scholar]
- 17. Kaplan MJ. Management of cardiovascular disease risk in chronic inflammatory disorders. Nat Rev Rheumatol 5: 208–217, 2009 [DOI] [PubMed] [Google Scholar]
- 18. Kaplan NM. The deadly quartet. Upper-body obesity, glucose intolerance, hypertriglyceridemia, and hypertension. Arch Int Med 149: 1514–1520, 1989 [DOI] [PubMed] [Google Scholar]
- 19. Kipen Y, Briganti E, Strauss B. Three year follow-up of body composition changes in pre-menopausal women with systemic lupus erythematosus. Rheumatology 38: 59–65, 1999 [DOI] [PubMed] [Google Scholar]
- 20. Kipen Y, Strauss B, Morand E. Body composition in systemic lupus erythematosus. Br J Rheumatol 37: 514–519, 1998 [DOI] [PubMed] [Google Scholar]
- 21. London MG, Muirden KD, Hewitt JV. Serum cholesterol in rheumatic diseases. Br Med J 1: 1380–1383, 1963 [DOI] [PMC free article] [PubMed] [Google Scholar]
- 22. Magadmi ME, Ahmad Y, Turkie W. Hyperinsulinemia, insulin resistance, and circulating oxidized low density lipoprotein in women with systemic lupus erythematosus. J Rheumatol 33: 50–56, 2006 [PubMed] [Google Scholar]
- 23. Morel L, Rudofsky UH, Longmate JA, Schiffenbauer J, Wakeland EK. Polygenic control of susceptibility to murine systemic lupus erythematosus. Immunity 1: 219–229, 1994 [DOI] [PubMed] [Google Scholar]
- 24. Morel L, Wakeland EK. Lessons from the NZM2410 model and related strains. Int Rev Immunol 19: 423–446, 2000 [DOI] [PubMed] [Google Scholar]
- 25. Morel L, Yu Y, Blenman KR, Caldwell RA, Wakeland EK. Production of congenic mouse strains carrying genomic intervals containing SLE-susceptibility genes derived from the SLE-prone NZM2410 strain. Lab Med 339: 335–339, 1996 [DOI] [PubMed] [Google Scholar]
- 26. Morrison WR, Smith LM. Preparation of fatty acid methyl esters and dimethylacetals from lipids with boron fluoride—methanol. J Lipid Res 5: 600–608, 1964 [PubMed] [Google Scholar]
- 27. Nishimura S, Manabe I, Nagasaki M, Eto K, Yamashita H, Ohsugi M, Otsu M, Hara K, Ueki K, Sugiura S. CD8+ effector T cells contribute to macrophage recruitment and adipose tissue inflammation in obesity. Nat Med 15: 914–920, 2009 [DOI] [PubMed] [Google Scholar]
- 28. Posadas-Romero C, Torres-Tamayo M, Zamora-González J, Aguilar-Herrera BE, Posadas-Sánchez R, Cardoso-Saldaña G, Ladrón de Guevara G, Solis-Vallejo E, El Hafidi M. High insulin levels and increased low-density lipoprotein oxidizability in pediatric patients with systemic lupus erythematosus. Arthritis Rheumatism 50: 160–165, 2004 [DOI] [PubMed] [Google Scholar]
- 29. Rubenstein AH, Clark JL, Melani F, Steiner DF. Secretion of proinsulin C-peptide by pancreatic β cells and its circulation in blood. Nature 224: 697–699, 1969 [Google Scholar]
- 30. Roman MJ, Shanker BA, Davis A, Lockshin MD, Sammaritano L, Simantov R, Crow MK, Schwartz JE, Paget SA, Devereux RB, Salmon JE. Prevalence and correlates of accelerated atherosclerosis in systemic lupus erythematosus. N Engl J Med 349: 2399–2407, 2003 [DOI] [PubMed] [Google Scholar]
- 31. Rossner S, Lofmark C. Dyslipoproteinaemia in patients with active, chronic polyarthritis. A study on serum lipoproteins and triglyceride clearance (intravenous fat tolerance test). Atherosclerosis 28: 41–52, 1977 [DOI] [PubMed] [Google Scholar]
- 32. Ryan MJ, McLemore GR, Hendrix ST. Insulin resistance and obesity in a mouse model of systemic lupus erythematosus. Hypertension 48: 988–993, 2006 [DOI] [PubMed] [Google Scholar]
- 33. Sada KE, Yamasaki Y, Maruyama M, Sugiyama H, Yamamura M, Maeshima Y, Makino H. Altered levels of adipocytokines in association with insulin resistance in patients with systemic lupus erythematosus. J Rheumatol 33: 1545–1552, 2006 [PubMed] [Google Scholar]
- 34. Santos MJ, Vinagre F, Canas da Silva J, Gil V, Fonseca JE. Body composition phenotypes in systemic lupus erythematosus and rheumatoid arthritis: a comparative study of Caucasian female patients. Clin Exper Rheumatol 29: 470–476, 2011 [PubMed] [Google Scholar]
- 35. Shivakumar S, Tsokos GC, Datta SK. T cell receptor alpha/beta expressing double-negative (CD4-/CD8-) and CD4+ T helper cells in humans augment the production of pathogenic anti-DNA autoantibodies associated with lupus nephritis. J Immunol 143: 103–112, 1989 [PubMed] [Google Scholar]
- 36. Stanic AK, Stein CM, Morgan AC, Fazio S, Linton MF, Wakeland EK, Olsen NJ, Major AS. Immune dysregulation accelerates atherosclerosis and modulates plaque composition in systemic lupus erythematosus. Proc Natl Acad Sci USA 103: 7018–7023, 2006 [DOI] [PMC free article] [PubMed] [Google Scholar]
- 37. Svenson KLG, Lithell H, Hallgren R, Selinus I, Vessby B. Serum lipoprotein in active rheumatoid arthritis and other chronic inflammatory arthritides. I. Relativity to inflammatory activity. Arch Int Med 147: 1912–1916, 1987 [PubMed] [Google Scholar]
- 38. Tso T, Huang WN, Huang HY, Chang CK. Elevation of plasma interleukin-18 concentration is associated with insulin levels in patients with systemic lupus erythematosus. Lupus 15: 207–212, 2006 [DOI] [PubMed] [Google Scholar]
- 39. Tso TK, Huang WN. Elevation of fasting insulin and its association with cardiovascular disease risk in women with systemic lupus erythematosus. Rheumatol Int 29: 735–742, 2009 [DOI] [PubMed] [Google Scholar]
- 40. Urowitz MB, Bookman AA, Koehler BE, Gordon DA, Smythe HA, Ogryzlo MA. The bimodal mortality pattern of systemic lupus erythematosus. Am J Med 60: 221–225, 1976 [DOI] [PubMed] [Google Scholar]
- 41. Wang T, Lacík I, Brissová M, Anilkumar AV, Prokop A, Hunkeler D, Green R, Shahrokhi K, Powers AC. An encapsulation system for the immunoisolation of pancreatic islets. Nat Biotechnol 15: 358–362, 1997 [DOI] [PubMed] [Google Scholar]
- 42. Weisberg SP, Hunter D, Huber R, Lemieux J, Slaymaker S, Vaddi K, Charo I, Leibel AWF RL., Jr CCR2 modulates inflammatory and metabolic effects of high-fat feeding. J Clin Invest 116: 115–124, 2006 [DOI] [PMC free article] [PubMed] [Google Scholar]
- 43. Weisberg SP, McCann D, Desai M, Rosenbaum M, Leibel RL, Ferrante AW. Obesity is associated with macrophage accumulation in adipose tissue. J Clin Invest 112: 1796–1808, 2003 [DOI] [PMC free article] [PubMed] [Google Scholar]
- 44. Winer a D, Winer S, Shen L, Wadia PP, Yantha J, Paltser G, Tsui H, Wu P, Davidson MG, Alonso MN, Leong HX, Glassford A, Caimol M, Kenkel JA, Tedder TF, McLaughlin T, Miklos DB, Dosch HM, Engleman EG. B cells promote insulin resistance through modulation of T cells and production of pathogenic IgG antibodies. Nat Med 17: 1–8, 2011 [DOI] [PMC free article] [PubMed] [Google Scholar]
- 45. Winer S, Chan Y, Paltser G, Truong D, Tsui H, Bahrami J, Dorfman R, Wang Y, Zielenski J, Mastronardi F, Maezawa Y, Drucker D, Engleman E, Winer D, Dosch H. Normalization of obesity-associated insulin resistance through immunotherapy. Nat Med 15: 921–929, 2009 [DOI] [PMC free article] [PubMed] [Google Scholar]
- 46. Won JG, Nicholson WE, Ching KN, Orth DN. Effect of protein kinase-C depletion on inositol trisphosphate-mediated and cyclic adenosine 3′,5′-monophosphate-dependent protein kinase-mediated adrenocorticotropin secretion. Endocrinology 133: 1274–1283, 1993 [DOI] [PubMed] [Google Scholar]
- 47. Zavaroni I, Deferrari G, Lugari R, Bonora E, Garibotto G, Dall'Aglio E, Robaudo C, Gnudi A. Renal metabolism of C-peptide in man. J Clin Endocrinol Metab 65: 494–498, 1987 [DOI] [PubMed] [Google Scholar]