

Abstract
Recessive inheritance of mutations in ceroid neuronal lipofuscinosis type 3 (CLN3) results in juvenile neuronal ceroid lipofuscinosis (JNCL), a childhood neurodegenerative disease with symptoms including loss of vision, seizures, and motor and mental decline. CLN3p is a transmembrane protein with undefined function. Using a Cln3 reporter mouse harboring a nuclear-localized bacterial β-galactosidase (β-Gal) gene driven by the native Cln3 promoter, we detected β-Gal most prominently in epithelial cells of skin, colon, lung, and kidney. In the kidney, β-Gal-positive nuclei were predominant in medullary collecting duct principal cells, with increased expression along the medullary osmotic gradient. Quantification of Cln3 transcript levels from kidneys of wild-type (Cln3+/+) mice corroborated this expression gradient. Reporter mouse-derived renal epithelial cultures demonstrated a tonicity-dependent increase in β-Gal expression. RT-quantitative PCR determination of Cln3 transcript levels further supported osmoregulation at the Cln3 locus. In vivo, osmoresponsiveness of Cln3 was demonstrated by reduction of medullary Cln3 transcript abundance after furosemide administration. Primary cultures of epithelial cells of the inner medulla from Cln3lacZ/lacZ (CLN3p-null) mice showed no defect in osmolyte accumulation or taurine flux, arguing against a requirement for CLN3p in osmolyte import or synthesis. CLN3p-deficient mice with free access to water showed a mild urine-concentrating defect but, upon water deprivation, were able to concentrate their urine normally. Unexpectedly, we found that CLN3p-deficient mice were hyperkalemic and had a low fractional excretion of K+. Together, these findings suggest an osmoregulated role for CLN3p in renal control of water and K+ balance.
Keywords: Batten disease, juvenile neuronal ceroid lipofuscinosis, osmolytes, kidney, polyuria, potassium
the juvenile form of neuronal ceroid lipofuscinosis (JNCL), or Batten disease, is caused by recessive inheritance of mutations in the ceroid neuronal lipofuscinosis type 3 (CLN3) gene (reviewed in Refs. 25 and 32). Symptoms typically manifest in children between 5 and 7 yr of age and present with visual problems that proceed to blindness. Other manifestations include seizures and deterioration of cognitive and motor skills, with death commonly occurring in young adulthood. Progressive photoreceptor cell loss occurs (13), as does widespread neuronal cell loss in the brain, with prominent loss of neurons in parts of the cortex and hippocampus (4, 54). A diagnostic feature of JNCL is the cumulative buildup of autofluorescent lipopigment within lysosomes in many cell types (49).
CLN3p is a hydrophobic protein without significant homology to other proteins, and its molecular function remains elusive (reviewed in Ref. 40). CLN3p is predicted to contain six membrane-spanning regions and has been variously localized to lysosomes, endosomes, and Golgi in nonneuronal cells and in endosomes and vesicles along neurites and at synapses in neurons. Studies in CLN3p-deficient murine cells or patient cell lines or yeast cells deficient in Btn1p (the CLN3p ortholog) suggest that CLN3p may influence a variety of cell functions, including endocytosis (10, 18, 29), vesicular trafficking (9, 11), vacuolar (37) or lysosomal (21) pH homeostasis, arginine import (9, 42), galactosylceremide transport (45), bis(monoacylglycerol)phosphate synthesis (22), palmitoyl-protein desaturation (33), apoptosis resistance (39), and autophagy (8). From this diverse set of altered functions, it is not clear whether CLN3p performs a molecular function that impacts multiple pathways or performs distinct functions in different cell types and/or in different subcellular compartments.
Low endogenous expression levels and a lack of reliable CLN3p-specific antibodies have limited progress using traditional cell biology approaches. Our laboratory generated a Cln3 reporter mouse that allows us to acquire information regarding temporal and regional Cln3 expression (14). In this knock-in mouse, the recombinant allele contains a nuclear-localized bacterial β-galactosidase (β-Gal) transgene and SV40 polyadenylation sequences replacing Cln3 sequences from exon 1 to intron 8. β-Gal expression is thus directed by endogenous Cln3 promoter elements. CLN3p is not expressed from the recombinant allele, and homozygous reporter (Cln3lacZ/lacZ) mice are CLN3p-null. As previously reported (14), in adult brain we detect moderate levels of β-Gal expression in granule neurons of the dentate gyrus of the hippocampus and in endothelial cells of the microvasculature. In the present study, we find that, outside the central nervous system (CNS), reporter protein is evident in several tissues, notably skin, lung, colon, and, most strikingly, the inner medulla (IM) of the kidney. No kidney phenotype has, to our knowledge, been reported. However, it is very possible that mild phenotypes may go unnoticed. Moreover, while function may be readily compensated in the kidney, this may not be the case for the CNS. It is possible that neurons, because of their dependence on interconnectivity and lack of regenerative capacity, are more sensitive to effects of CLN3 deficiency.
The kidney medulla harbors a unique environment; nowhere else in the mammalian system does osmolality exceed 1,500 mosmol/kgH2O and Po2 reach 10 Torr. The osmotic gradient owes largely to increasing concentrations of interstitial NaCl and urea from the corticomedullary border to the tip of the IM, or papilla (IM/papilla). This hypertonic medulla is absolutely essential for water reabsorption across the epithelial cells of the medullary collecting ducts and, thus, the excretion of concentrated urine. This hypertonic milieu is not static; the osmolality can change depending on the long-term state of hydration (48). With water deprivation or antidiuresis, interstitial osmolalities around the collecting duct cells of the IM can surpass 2,000 mosmol/kgH2O in rodents (1). In contrast, animals undergoing water diuresis (or those given loop diuretics such as furosemide) have a substantially less hypertonic medulla. The osmolality of the renal cortex is similar to that of other tissues; osmolality is relatively constant (280–300 mosmol/kgH2O), even under physiological extremes of water balance.
To maintain osmotic equilibrium with hypertonic surroundings, renal medullary cells upregulate the expression of proteins involved in the synthesis or import of nonperturbing organic osmolytes (reviewed in Refs. 19, 20, 34). These solutes allow cells to maintain a hypertonic intracellular environment, yet maintain normal concentrations of ions such as Na+ and K+. Renal medullary cells, which have adapted to their hypertonic environment, have an abundance of five organic osmolytes: sorbitol, inositol, glycerophosphorylcholine (GPC), betaine, and taurine. Sorbitol and GPC are synthesized intracellularly, betaine and taurine generally require transport, and inositol can be synthesized or transported. Cells outside the renal medulla, while not subjected to extreme fluctuations in osmolality, nonetheless utilize similar mechanisms for cell volume control. In the brain, taurine is present in substantial concentration and plays critical roles as a neuroprotectant (47), as well as an osmolyte (23, 36). Moreover, taurine is crucial for photoreceptor development and maintenance in the retina (43).
The significance of Cln3 expression in non-CNS organs in mammals has not, to our knowledge, been explored. Given the remarkable gradient of β-Gal expression in the kidneys of our Cln3 reporter mice, we hypothesized that Cln3 expression is osmoregulated and that CLN3p plays a role in osmolyte accumulation. We found Cln3 expression to indeed correlate with osmolality. However, CLN3p-deficient cells displayed normal osmolyte accumulation. Interestingly, evaluation of mice for water intake and blood/urine chemistries showed enhanced water consumption, high serum K+, and reduced fractional excretion of K+ in CLN3p-deficient mice compared with controls. These findings suggest roles for CLN3p in water reabsorption and K+ excretion by the kidney.
MATERIALS AND METHODS
Animal maintenance.
The Cln3 reporter mouse was generated as previously described using targeted recombination, and recombinant mice were backcrossed to C57/BL/6J for ≥17 generations before use in experiments (14). For this study, offspring of Cln3lacZ/+ × Cln3lacZ/+, Cln3lacZ/lacZ × Cln3lacZ/lacZ, or Cln3+/+ × Cln3+/+ breeding pairs were used. All animal care and handling were approved by the University of Iowa Institutional Animal Care and Use Committee. Ratios of male to female mice were equal or similar for different groups in animal experiments and primary culture experiments.
β-Gal activity in tissue and cell lysates.
Tissues were harvested from mice and homogenized in 0.1 M phosphate buffer (pH 7.8) containing 0.2% Triton X-100 (lysis buffer), frozen and thawed three times, and centrifuged at 4°C for 15 min at 12,000 g to remove debris. Protease inhibitors (EDTA-free Complete protease inhibitor tablets, used at 1×; Roche Applied Science, Indianapolis, IN) were added to the supernatants, and endogenous galactosidase activity was inactivated by 50 min of incubation at 48°C. β-Gal activity in lysates was determined using the FluoReporter lacZ/galactosidase quantitation kit (Invitrogen, Life Technologies, Carlsbad, CA), set up in triplicate in 96-well black plates, and detected using a FluorStar fluorometer and Fluo32 software (BMG Lab Technologies, Durham, NC). β-Gal concentration in lysates was interpolated from a standard curve generated with purified β-Gal (Sigma, St. Louis, MO). Protein concentrations in lysates were determined using the DC protein assay (Bio-Rad Laboratories, Hercules, CA). For each tissue, samples were assayed from three Cln3lacZ/+ and three Cln3+/+ mice and expressed as nanograms of β-Gal per milligram of protein (means ± SE). For assay of β-Gal from cultured cells, lysis buffer was added to monolayers, and lysates were collected, frozen and thawed three times, and centrifuged at 4°C for 15 min at 12,000 g, and protease inhibitors were added to the supernatants as described above. β-Gal activity was determined using the Galacto-Light Plus assay (ABI, Foster City, CA), with samples read in duplicate using a Moonlight 3010 luminometer (BD Biosciences, Franklin Lakes, NJ). Protein concentrations in lysates were determined by Bio-Rad assay, and results are expressed as light units per milligram of protein (means ± SD) of duplicate cultures.
Tissue processing and staining.
For X-Gal staining and immunohistochemistry (IHC), mice were perfused with 2% paraformaldehyde (PFA) in PBS (pH 7.4), and tissues were processed to 10-μm sections on slides or 40-μm floating sections, as previously described (14). For some sections, X-Gal staining was followed by IHC. For IHC, X-Gal-stained sections were washed in PBS, blocked at room temperature by incubation for 1 h in PBS containing 10% donkey serum and 0.3% Triton X-100, and then incubated overnight at 4°C with goat polyclonal anti-aquaporin 2 (AQP2; C-17 antibody, Santa Cruz Biotechnology, Santa Cruz, CA), goat polyclonal anti-Tamm-Horsfall protein (THP; G-20 antibody, Santa Cruz Biotechnology), or biotinylated Dolichos biflorus agglutinin (DBA; Vector Laboratories, Burlingame, CA) diluted in PBS containing 1% donkey serum and 0.1% Triton X-100 (diluent). Sections with primary antibody were washed in PBS and incubated for 2 h at room temperature with biotinylated donkey anti-goat secondary antibody (Jackson ImmunoResearch Laboratories, West Grove, PA) at 1:1,000 in diluent. Sections were washed in PBS and incubated for 2 h at room temperature with ABC complexes (Vectastain ABC Elite kit, Vector Laboratories) diluted 1:10 in PBS, washed in PBS, and developed with a diaminobenzidine kit (Vector Laboratories), dried overnight, passed twice through xylenes for 10 min each, and mounted with Permount-xylenes (1:1). Images were captured using Olympus IX70 and Olympus BX60 microscopes and an Olympus DP70 digital camera with associated DP software (Olympus, Center Valley, PA).
For immunofluorescent staining, mice were perfused with 4% PFA, and cryostat sections (40 μm floating or 6 μm on slides) were prepared. Floating sections were blocked at room temperature for 2 h in PBS containing 10% goat serum plus 10% rabbit serum and 0.3% Triton X-100, stained at 4°C overnight with polyclonal rabbit anti-Escherichia coli β-Gal (Biodesign International, Kennebunk, ME) conjugated to Alexa 488 (A488, Alexa Fluor 488 protein labeling kit, Invitrogen), and diluted in PBS containing 0.1% Triton X-100 and 1% goat serum. Sections were stained for 25 min at room temperature with the nonspecific nuclear dye TO-PRO-3 (0.5 μM; Invitrogen) to label all cells, washed in PBS, and then mounted with Vectashield (Vector Laboratories) and viewed via confocal microscopy using a Zeiss LSM 510 laser scanning microscope and associated LSM software (Carl Zeiss MicroImaging, Thornwood, NY). For assessment of autofluorescent inclusions in unstained sections, 40-μm kidney sections from Cln3+/+ or Cln3lacZ/lacZ mice were mounted with Vectashield, and confocal images were captured in the red channel. Confocal images within experiments were captured using identical settings. Sections (6 μm) on slides were blocked for 30 min with 10% normal donkey serum and 0.05% Triton X-100 in PBS and incubated with primary antibodies to AQP2/3 (goat polyclonal; Santa Cruz Biotechnology), V-ATPase B1 and B2 (rabbit polyclonal, Santa Cruz Biotechnology), and A488 anti-β-Gal (rabbit polyclonal, as described above) at 2 μg/ml each in PBS for 2 h at room temperature. After they were washed with PBS, the slides were incubated for 30 min with Alexa 568 (A568) anti-rabbit IgG and Alexa 647 (A647) anti-goat IgG secondary antibodies from donkey (Invitrogen). Slides were washed with PBS, stained for 5 min with Hoechst nuclear dye, and mounted with Vectashield, and images were captured on a Zeiss LSM 710 laser scanning microscope and analyzed with Zeiss Zen Light-associated software. AQP2 and AQP3 reside on the surface membrane or cytoplasmic vesicles of collecting duct principal cells, while V-ATPase B localizes to the surface membrane or cytoplasmic vesicles of intercalated (IC) cells. β-Gal signal appeared in green and red channels due to staining with rabbit A488 anti-β-Gal and A568 anti-rabbit antibodies and appeared yellow in merged images. The yellow β-Gal signal was clearly distinguishable from red V-ATPase staining, which was outside cell nuclei and did not overlap with A488 or Hoechst signals.
For immunofluorescent staining of cultured cells, monolayers were fixed with 4% PFA in PBS for 10 min at room temperature, blocked for 1 h in PBS with 10% goat serum and 0.1% Triton X-100, and then incubated overnight at 4°C with primary antibodies. Primary antibodies included combinations of rabbit A488-anti-β-Gal, mouse monoclonal anti-pan cytokeratin (clone C-11, Sigma), rat monoclonal anti-CD31 (BD Biosciences, San Jose, CA), and rabbit anti-ZO-1 (Invitrogen), each at 1–2 μg/ml. After they were washed with PBS, the monolayers were incubated for 1 h with appropriate A568- or A488-conjugated goat polyclonal secondary antibodies (Invitrogen) and washed again. Cell nuclei were stained by 5 min of incubation with Hoechst dye, and images were captured using an inverted Olympus IX70 fluorescent microscope and an Olympus DP70 digital camera (Olympus). Images were captured using identical settings for each staining condition.
Cln3 transcript abundance in kidney regions.
Mice were perfused with 20 ml of cold PBS, and samples of liver, spleen, and lung were immediately homogenized in TRIzol (Invitrogen). Kidneys were placed in ice-cold PBS, and renal cortex samples, outer medullas (OM), and IM/papilla were dissected out and homogenized in TRIzol. RNA was isolated from tissue samples using TRIzol as directed by the manufacturer (Invitrogen). One microgram of RNA was reverse-transcribed to cDNA in 50-μl reactions using the High-Capacity cDNA RT kit and random primers (ABI), and DNA was removed using a DNA-Free kit (ABI). Quantitative PCR (qPCR) were set up in triplicate using Universal Master Mix (ABI) and primer-probe sets for murine Cln3 (Mm00477972_ml, exon 2–3) and eukaryotic 18S rRNA (Hs99999901_s1) and run using a 7900HT Fast real-time PCR system (ABI). No significant amplification was observed in “no-RT” controls. The comparative CT method (ABI Bulletin 2) was applied to determine the relative abundance of Cln3 transcripts in the various tissues and kidney regions, with 18S rRNA as the endogenous control and a liver sample as the calibrator (equal to 1). Samples were taken from two mice for liver, spleen, and lung and from three mice for kidney regions. Results are expressed as means ± SD, and significant differences between kidney regions were established by unpaired t-tests.
Primary IM cultures.
Primary renal IM cell cultures were generated using methods similar to those described in previous studies (31, 60). The starting medium for primary cultures was a 50:50 mixture of low-glucose DMEM (Invitrogen) and F-12-Coons (Sigma) containing 10 mM HEPES, 5 μg/ml apo-transferrin (Sigma), 5 pM 3,3′,5-triiodo-l-thyronine sodium salt (Sigma), 50 nM hydrocortisone (Sigma), 10 nM sodium selenite (Sigma), 10% fetal bovine serum, 100 U/ml penicillin, and 100 μg/ml streptomycin and made hypertonic by the addition of NaCl and urea at a 1.5:1 molar ratio for a final osmolality of ∼600 mosmol/kgH2O (HT medium). DMEM/F-12 (Invitrogen) was similarly made hypertonic by the addition of NaCl plus urea (HT-DMEM/F-12). Briefly, 3- to 5-wk-old mice were killed by cervical dislocation after isoflurane anesthesia, and kidneys were aseptically removed and placed in HT-DMEM/F-12 on ice. IM from several mice per group were dissected out, pooled, and cut into small (∼0.5-mm) pieces, which were digested for 90 min in a tissue culture incubator (37°C and 5% CO2) in HT-DMEM/F-12 containing 700 U/ml hyaluronidase (Worthington Biochemical, Lakewood, NJ) and 2 mg/ml collagenase B (Roche), with trituration every 15 min. At the halfway point, DNase I (Promega, Madison, WI) was added to a final concentration of 10 U/ml to reduce clumping. After digestion, the desired small clusters were diluted in prewarmed HT-DMEM/F-12 and collected by centrifugation for 2 min at 230 g and further washed by two more centrifugations in HT-DMEM/F-12. Pellets were suspended in HT medium and seeded into dishes at a density corresponding to about one 60-mm dish per mouse. The culture medium was replaced with fresh HT medium every 2 or 3 days. At confluence (5–7 days), the medium was changed to HT medium without serum (HT medium-0). For experiments, cultures were subjected to further changes in osmolality as described below.
Osmoregulation of reporter protein.
For testing of osmoregulation of β-Gal, primary IM cultures from Cln3lacZ/+ mice were generated as described above in 24-well dishes. After confluence and culture in HT medium-0 for 48 h, the osmolality was lowered (dropped to isosmolar, 300 mosmol/kgH2O), maintained at 600 mosmol/kgH2O, or increased at the rate of 100 mosmol/kgH2O per day to 800, 1,000, 1,200, or 1,400 mosmol/kgH2O by the addition of NaCl plus urea (1.5:1 molar ratio) in duplicate wells. At 24 h after the last addition, the cells were harvested into lysis buffer and analyzed for β-Gal activity by Galacto-Light assay as described above.
In vitro osmoregulation of Cln3 transcript abundance.
Primary cultures of IM from Cln3+/+ mice were generated as described above, and after change to HT medium-0, osmolality of the cultures was maintained at 600 mosmol/kgH2O or lowered to isosmolar (300 mosmol/kgH2O) in duplicate wells. After 48–72 h, RNA was isolated using an RNeasy Plus kit (Qiagen, Valencia, CA), which includes a DNA removal column. RNA was reverse transcribed to cDNA, and qPCR was performed using primer-probe sets for murine Cln3 (Mm01163353_ml, exon 3–5), eukaryotic 18S rRNA, and murine Pax2 (Mm00477972_ml; ABI). qPCR reactions were performed as described above. No significant amplification was detected in no-RT controls. Results are expressed as hypertonic transcript abundance relative to isotonic.
Osmoregulation of Cln3 in vivo.
Cln3lacZ/+ mice were injected with furosemide (3 mg/100 g body wt ip; Sigma) at time 0 and again at 3 h and were killed 3 h after the second dose. Control Cln3lacZ/+ mice were injected with saline vehicle alone. At the time of death, kidneys were removed to dishes on ice containing RNAlater (Qiagen). IM and samples of renal cortex were dissected out, and RNA was isolated using RNeasy Plus kits (Qiagen). RT and qPCR were performed using ABI reagents as described above. The qPCR was set up in triplicate using ABI primer-probe sets for eukaryotic 18S rRNA and murine Cln3, murine aldose reductase (AR; Mm01135578_g), and murine β-actin (Mm00607939_s). Relative transcript abundance was determined as described above using 18S rRNA as endogenous control. Results are expressed as means ± SE of samples from four mice, and t-tests were applied to establish P values.
Quantitation of intracellular osmolytes.
Primary cultures of IM from Cln3lacZ/lacZ, Cln3lacZ/+, or Cln3+/+ mice (6 mice pooled per group) were generated in 100-mm dishes as described above. A few days after change to HT medium-0, the medium was lowered to isotonic (300 mosmol/kgH2O) or raised to a final osmolality of 1,300 mosM at a rate of 100 mosmol/kgH2O per day. Medium was made hypertonic by addition of NaCl plus urea (at 1.5:1 molar ratio). Hypertonic and isotonic media were also supplemented with the osmolytes betaine, myo-inositol, and taurine (Sigma) at 200 μM each. At 48 h after the final increase in osmolality, the monolayers were rinsed twice with the corresponding medium without osmolyte supplements and then three times with PBS or HT-PBS (made hypertonic with NaCl to match the osmolality of the medium). Perchloric acid (7%) was added to monolayers to precipitate total proteins. Cells were scraped and collected, and precipitates were pelleted by centrifugation for 6 min at 10,000 g at 4°C. Protein pellets were dissolved in 0.25 M NaOH and kept at 4°C until protein determination (Bio-Rad). Supernatants were neutralized with KOH, incubated for 10 min on ice, and centrifuged again for 15 min. Supernatants were delipidated by passage over a Sep-Pak Light C18 cartridge (Waters, Milford, MA) and then passed over 0.22-μm filters. Samples were evaporated and dissolved in the volume of water to give a 2 mg/ml total protein equivalent, and 100 μl were analyzed by HPLC for osmolytes as previously described (44, 58). Osmolytes are expressed as millimoles per milligram of total cellular protein.
Taurine uptake/efflux.
Primary cultures from Cln3+/+ and Cln3lacZ/lacZ mice were established as described above in 24-well dishes with removal of serum and change to isotonic cultures at 1 wk. After 2 days, cultures were transitioned to 900 mosmol/kgH2O by three additions of NaCl plus urea (1.5:1 molar ratio) for induction of the taurine transporter (50). For assay of taurine uptake, the existing medium was removed, and 0.5 μCi of [1,2-3H]taurine ([3H]taurine; GE Healthcare Bio-Sciences, Piscataway, NJ) in 200 μl of prewarmed uptake buffer (140 mM NaCl, 5.5 mM glucose, 5.4 mM KCl, 1.8 mM CaCl2, 10 nM HEPES, and 10 μM taurine plus an additional 112.5 mM NaCl and 75 mM urea to make a hypertonic medium) was added to the wells. At 0, 15, or 40 min after [3H]taurine addition, cell monolayers were washed three times with ice-cold wash buffer (uptake buffer without taurine or [3H]taurine), and 200 μl of 1 N NaOH were added to the wells to lyse the cells. Lysates were neutralized by addition of 200 μl of 1 N HCl. Matching control wells included excess cold taurine (50 mM) in the uptake buffer to block specific uptake; the [3H]taurine measured in these lysates was considered nonspecific and was subtracted from test wells. Lysates were diluted in scintillation fluid, and radioactivity was measured on a scintillation counter. [3H]taurine uptake was >80% specific; it was only 17% nonspecific at 15 min and 11% nonspecific at 40 min. Specific [3H]taurine uptake (test − control) is expressed as counts per minute (cpm; mean ± SD) of duplicate cultures.
For [3H]taurine efflux experiments, primary IM cultures from Cln3lacZ/lacZ and Cln3+/+ mice were generated as described above in 24-well dishes and maintained for 48 h in HT medium-0 prior to assay. Cells were loaded with taurine by 2 h of incubation in HT medium-0 containing 10 μM cold taurine and 3 μCi/ml of [3H]taurine (200 μl/well). After loading, the monolayers were washed three times with prewarmed HT medium-0, and isotonic medium-0 was added to trigger taurine efflux. After 10 min, this medium (efflux) was collected. The monolayers were washed twice with ice-cold isotonic medium, and cells were lysed as described above. The efflux medium, aliquots of the isotonic washes, and the lysates were diluted in scintillation fluid and counted. Efflux was calculated as a percentage of the total, where the total is the sum of the counts in the efflux, isotonic washes, and lysates, and is expressed as mean cpm ± SD.
Blood/serum and urine measurements.
Cln3lacZ/lacZ and Cln3+/+ mice at 10–12 mo of age were used in metabolic cage experiments to assess urine-concentrating function and blood/urine chemistries (n = 12 mice per group for urine analyses; n = 6 mice per group for blood/serum analyses). Mice were acclimated to metabolic cages (Single Mouse Techniplast, Fisher Scientific, Hanover Park, IL) for 2 days, and urine was collected after 24 h of free access to water and again after 24 h of water deprivation. Blood for hematocrit and serum chemistries was collected at the time of death, either directly after water deprivation or 5 days after return to free access to water. The VITROS 350 chemistry system (Ortho Clinical Diagnostics, Rochester, NY) with VITROS calibrators, standards, and supplies (Fisher Scientific) was used to determine serum and urine chemistries (creatinine and salts, serum ECO2, blood urea nitrogen, and urine albumin). Urine pH, serum ECO2, and serum and urine osmolalities (vapor-pressure osmometer, Wescor, Logan, UT) were determined prior to sample storage at −80°C. Total 24-h excretion for each solute (x) was determined by the following equation: (Uvol × Ux), where Uvol is 24-h urine volume and Ux is urine solute concentration. Fractional excretion for each solute was estimated by the following equation: (Ux/Sx)/(UCr/SCr), where Ux is urine solute concentration, Sx is serum solute concentration, UCr is urine creatinine concentration, and SCr is serum creatinine concentration. Results are tabulated as total excretion (mean ± SE, n = 12 mice per group) and fractional excretion (mean ± SE, n = 6 mice per group). Unpaired t-tests were used to determine P values.
RESULTS
Cln3 expression in extraneural tissues.
We used our phenotypically normal heterozygous reporter (Cln3lacZ/+) mice (14) to assess relative Cln3 expression. In these recombinant mice, a nuclear-localized β-Gal reporter gene is inserted in place of Cln3 sequences and driven by native Cln3 promoter elements. Nuclear-targeted β-Gal, but not Cln3, is transcribed from the recombined allele, such that Cln3lacZ/lacZ mice are CLN3p-null and provide a CLN3p-deficient mouse model. Our previous study localized reporter to neuronal subtypes and vascular endothelia in the brain. In the present study, we examined extraneural β-Gal activity in Cln3lacZ/+ mice. Of the tissues examined, kidney medulla displayed the highest activity, followed by skin and lung (Fig. 1A). X-Gal staining revealed reporter-positive nuclei in skin epidermal cells (Fig. 1B), epithelial cells within the large conducting airways of the lung (Fig. 1C), and epithelial cells within colonic crypts (Fig. 1D). In addition, weakly positive nuclei were often detectable within the vascular endothelial cells of most tissues (not shown). The kidney stained very strongly with X-Gal (Fig. 1E): positive nuclei were detected in the glomeruli of the cortex (Fig. 1F), in some tubules in the outer medulla (OM; Fig. 1G), and in increasing density in most to all cell types in the IM/papilla (Fig. 1H). Immunofluorescent staining for β-Gal illustrated increasing intensity of nuclear β-Gal staining with progression to the tip of the papilla (Fig. 1I).
Fig. 1.

Reporter expression and ceroid neuronal lipofuscinosis type 3 (Cln3) transcripts are evident in nonneural tissues. A: β-galactosidase (β-Gal) activity in tissues collected from Cln3+/− or Cln3+/+ mice, assayed as outlined in materials and methods. Values are means ± SE of samples from 3 mice. Ki, kidney; Sk, skin; Lu, lung; Sp, spleen; Co, brain cortex; Hc, hippocampus; Cb, cerebellum; Li, liver. B–D: representative images captured from 10-μm X-Gal-stained sections of skin, lung, and colon. Blue staining demonstrates nuclear-localized β-Gal. E: β-gal expression through a bisected, X-Gal-stained kidney from a Cln3lacZ/+ mouse showing the lowest level of expression in renal cortex, intermediate expression in outer medulla (OM), and highest expression in inner medulla (IM)/papilla. F and G: X-Gal-stained 40-μm kidney sections of renal cortex (Cx) and OM-IM border; images approximated in the boxed areas in E. H and I: 10-μm sections from Cln3lacZ/+ IM stained with X-Gal and Alexa 488 (A488)-anti-β-Gal, respectively. E and I illustrate increased gradient of reporter expression in IM/papilla. J: relative Cln3 mRNA transcript abundance in Cln3+/+ mice determined by RT-quantitative PCR (qPCR). Values are means ± SD of 2 mice for lung (Lu), spleen (Sp), and liver (Li) and 3 mice for kidney cortex (Ki CX), OM, and IM. *P < 0.05, **P < 0.005 by t-test. Scale bars: 20 μm (C and H) and 100 μm (B, D, F, G and I). Sections in B, C, D, and H were counterstained with neutral red.
To complement reporter detection with Cln3 expression in the kidney, we performed RT-qPCR analysis for Cln3 transcript abundance in kidney regions, as well as in lung, spleen, and liver tissues dissected from Cln3+/+ mice. Similar to reporter expression, transcript levels in the kidney followed the osmotic gradient, with IM/papilla > outer medulla > cortex (Fig. 1J); expression in the IM was threefold higher than in the renal cortex. In addition, the expression level was almost sixfold higher in the IM than in the liver and threefold higher than in the lung and spleen. Transcript quantity in the renal cortex was similar to that in the lung and spleen. Thus Cln3 transcript levels in vivo show regional differences consistent with the β-Gal reporter protein.
To ascertain the major β-Gal-positive cell types in the kidney, we stained tissue sections with X-Gal followed by IHC staining for cell type-specific markers. In the OM, reporter-positive nuclei were found within DBA-lectin-positive tubules (Fig. 2A, left). DBA-lectin selectively binds collecting duct cells in the rodent kidney (53). In contrast, no β-Gal-positive cells were localized within thick ascending limbs (TAL), which stained strongly on their luminal surface for THP (Fig. 2A, middle) and could be seen running adjacent to β-Gal-positive tubules. Confocal analyses after staining for AQP2/3, β-Gal, and V-ATPase B (Fig. 2B) indicated that, within medullary collecting ducts, the β-Gal-positive nuclei belonged to AQP2/3-positive principal cells, and not V-ATPase B-positive IC cells. Rare, weakly β-Gal-positive IC cells were encountered (not shown). In the cortex, β-Gal-positive nuclei localized to glomeruli and vasculature (Fig. 2C). Both X-Gal and immunofluorescent staining gave the appearance of an increasing proportion of β-Gal-positive cells from superficial to deep IM. We addressed this impression more quantitatively by double-staining for β-Gal (using anti-β-Gal antibody) and cell nuclei (using TO-PRO-3, a nonspecific nuclear dye). The proportion of dual-positive nuclei was approximated by confocal microscopy. In the superficial IM (near the OM), ∼40% of the cells were β-Gal-positive (Fig. 2D, left). In the deep IM of the same sections, near the tip of the papilla, nearly all the cells were β-Gal-positive (Fig. 2D, middle). Together, reporter analyses indicate a pattern of increased Cln3 expression from the OM to the tip of the papilla, wherein most cells express reporter, and a pattern of preferential expression in principal cells, rather than IC cells, in the OM region of the kidney.
Fig. 2.
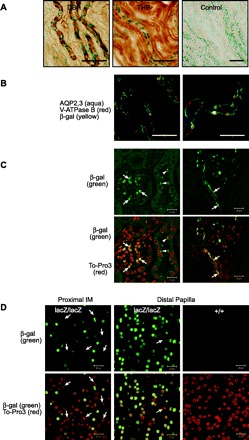
Reporter expression is prominent in collecting ducts in OM and spreads to all cell types in IM. A: 40-μm kidney sections from OM were stained with X-Gal for β-Gal (blue nuclei), stained for immunohistochemistry (IHC; brown precipitate) with Dolichos biflorus agglutinin (DBA) lectin, which selectively binds to collecting ducts, or antibody to Tamm-Horsfall protein (THP), which is a marker for thick ascending limb (TAL). Collecting ducts (DBA, left), but not TAL (THP, middle), showed β-Gal-positive cells. Control staining (right) was without primary antibody. B: 6-μm kidney sections were stained for β-Gal and for markers to distinguish between principal and intercalated (IC) cells in OM collecting ducts (see materials and methods). Confocal images show that β-Gal-positive nuclei (yellow) are frequently found within aquaporin (AQP) 2/3-positive principal cells (aqua), but not within V-ATPase B-positive IC cells (red). C and D: 40-μm kidney sections were dual-stained with A488-anti-β-Gal (green) and TO-PRO-3 (nuclear stain, red) and analyzed by confocal microscopy. C: images from cortex illustrate β-Gal-positive cells in a glomerulus (left, arrows) and in glomerulus-associated vasculature (right, arrows) and autofluorescent deposits in β-Gal-negative cells (right, arrowheads). D: proportion of β-Gal-expressing cells increases with distal progression in IM. Approximately 60% of cells at outer portion of IM (left) do not express β-Gal (nuclei are red but not green, arrows). Near the tip of the papilla, >95% of the cells express β-Gal (middle); 1 β-Gal-negative nucleus is seen (arrow). β-Gal is not detected in sections from wild-type controls (right). Scale bars: 100 μm (A and B) and 20 μm (C and D).
Cln3 expression is osmoregulated.
The pattern of Cln3 expression in the kidney is reflective of the natural osmotic gradient in the kidney. Proteins such as heat shock protein (HSP70) (2) and Pax2 (7) and proteins necessary for osmolyte import or synthesis (6) display an expression gradient in the kidney. As these proteins are osmoregulated, we hypothesized that Cln3 would be similarly responsive. To determine reporter expression relative to osmolality, we generated primary cultures from dissected IM of Cln3lacZ/+ mice. We enriched for tonicity-adapted medullary cells by initiation and early maintenance of the cultures in hyperosmotic (600 mosmol/kgH2O) medium. Cultures generated in this manner comprise predominantly IM epithelial cells (60).
Immunofluorescent staining for pan cytokeratin or CD31 was performed to assess relative contributions of epithelial and endothelial cells, respectively, to culture monolayers. Cln3+/+ and Cln3lacZ/lacZ cultures were generated and maintained in hypertonic medium. Cytokeratin-positive epithelial cells were clearly prevalent (see supplemental Fig. S1A in the online version of this article), with a minority of CD31-positive endothelial clusters (see supplemental Fig. S1B). Many cytokeratin-positive cells in the Cln3lacZ/lacZ cultures expressed β-Gal (see supplemental Fig. S1C), as expected. In addition, ZO-1 staining at intercellular boundaries indicated formation of tight junctions between neighboring epithelial cells (see supplemental Fig. S1D).
When primary Cln3lacZ/+ IM cultures reached confluence (∼1 wk), serum was removed from the medium. The osmolality of the culture medium was subsequently reduced to 300 mosmol/kgH2O or increased, in 100 mosmol/kgH2O increments once or twice per day, by the addition of NaCl plus urea at a ratio approximating the in vivo environment (1.5:1 molar ratio of added NaCl to urea). Figure 3, A and B, shows that reporter expression correlated with medium osmolality. Reporter levels were 6.5-fold higher at 1,400 than at 300 mosmol/kgH2O. An O2 gradient also exists in the renal medulla. Specialized arterioles, the vasa recta, extend from the corticomedullary border to the tip of the papilla and loop back up, creating a hypoxic gradient (34). Thus we considered that Po2 might additionally regulate reporter expression. However, reporter levels in primary renal medullary cells were similar after culture in reduced Po2 (2%) compared with normoxia (20% O2), regardless of osmolality (Fig. 3B). These results suggest that osmolality, rather than Po2, is a significant regulator of Cln3 expression.
Fig. 3.

Cln3 expression is osmoregulated. A: primary Cln3lacZ/+ IM cells were cultured under isotonic [300 mosmol/kgH2O (300 mosM)] or increasingly hypertonic (by addition of NaCl + urea) conditions, and β-Gal activity was measured in cell lysates. Histograms show means ± SD of duplicate cultures and are representative of 2 separate experiments. LU, light units. B: primary cultures were set up as in A and cultured under normal Po2 or at reduced Po2 (2%) for 2 days, and β-Gal activity was measured in lysates. Histograms show means ± SD of duplicate cultures. C: primary IM cultures were generated from Cln3+/+ mice and cultured in isotonic medium (300 mosmol/kgH2O) or medium made hypertonic by addition of NaCl + urea (left) or addition of various solutes (right). After 2–3 days under these culture conditions, relative transcript abundance was determined by RT-qPCR for Cln3 and Pax2. Histograms show means ± SD of duplicate cultures and are representative of 2 separate experiments. D: to assess effects of in vivo osmolality on Cln3 expression, Cln3lacZ/+ mice were injected with vehicle alone (no treatment) or furosemide at time 0 and 3 h. RNA was isolated from kidney cortex and IM at 6 h, and relative transcript abundances for Cln3, aldose reductase (AR), and β-actin were determined by RT-qPCR. Histograms show means ± SE (n = 4 mice per group). Cln3 and AR transcripts are more abundant in medulla than cortex. With furosemide treatment, medullary Cln3 and AR transcript levels drop dramatically. (t-test: **P < 0.005, *P < 0.05)
In separate experiments, we utilized primary cultures from Cln3+/+ mice to assess the effect of hypertonicity on Cln3 transcript levels. Primary cultures were generated as described above, with hypertonic changes achieved upon addition or removal of NaCl plus urea. Figure 3C (left) illustrates tonicity-dependent increases in the abundance of Cln3 mRNA relative to isotonic levels (2.9- and 7.6-fold for 600 and 1,000 mosmol/kgH2O, respectively), as measured by RT-qPCR. Significant transcript increase was also determined in cultures made hypertonic (final 600 mosmol/kgH2O) by addition of NaCl, mannitol, or raffinose (Fig. 3C, right). Raffinose was particularly effective (33-fold increase above isotonic), suggestive of additional, tonicity-independent regulatory mechanisms. Pax2, a previously described tonicity-regulated protein (7), was used as a positive control; accordingly, Pax2 expression was found to increase with hypertonicity imparted by NaCl plus urea, NaCl, and raffinose (Fig. 3C). These results demonstrate in vitro osmoregulation of Cln3 in primary renal medullary cells.
To assess in vivo osmoregulation of Cln3, we compared Cln3 transcript abundance in kidneys of untreated vs. furosemide-treated heterozygous mice. By inhibiting Na+ reabsorption in the TAL, furosemide effectively reduces interstitial osmolality in the renal medulla. RT-qPCR analysis of dissected renal cortex and IM tissue showed that furosemide profoundly diminished Cln3 transcript abundance in the IM, with little influence in the cortex (Fig. 3D). AR was used as an osmoregulated control. AR catalyzes the synthesis of the nonperturbing osmolyte sorbitol and displays tonicity-sensitive expression along the renal medulla (51). Furosemide triggered a significant reduction of AR transcript abundance, while levels of β-actin (a non-osmo-regulated control) were unaltered (Fig. 3D). These results indicate that interstitial osmolality regulates Cln3 expression in the renal medulla.
CLN3p deficiency does not limit osmolyte accumulation.
The regulation of Cln3 expression by osmolality suggests that CLN3p might function in pathways affecting intracellular osmolyte accumulation. To examine this possibility, we established primary IM cultures from control (Cln3+/+ or Cln3lacZ/+) and CLN3p-deficient (Cln3lacZ/lacZ) mice and measured intracellular osmolyte concentrations after maintenance in isotonic or hypertonic conditions. Intracellular osmolytes were quantified by HPLC and normalized to total cellular protein. For control and CLN3p-deficient cells, intracellular concentrations of the dominant osmolytes (inositol, taurine, GPC, sorbitol, and betaine) were manyfold higher after growth in hypertonic than isotonic medium (Fig. 4A), and there was no apparent effect of genotype. Intracellular levels of the less prominent osmolyte proline also increased under hypertonic conditions, while glycine showed no accumulation. Urea also rose to high intracellular levels. Unlike osmolytes, urea is relatively cell-permeant and equilibrates across cell membranes, explaining this intracellular rise. GPC and betaine, in addition to assisting in osmotic equilibrium, have been shown to protect intracellular proteins from the denaturing actions of urea (59). These results indicate that CLN3p-deficient cells acquire normal levels of osmolytes upon exposure to a hypertonic environment.
Fig. 4.

Osmolyte accumulation and taurine influx are intact in CLN3p-deficient cells. A: primary IM cells from Cln3lacZ/+ and Cln3lacZ/lacZ or Cln3+/+ and Cln3lacZ/lacZ mice were cultured under isotonic or hypertonic conditions, and intracellular osmolytes were measured by HPLC and normalized to total cellular protein. Data for Cln3lacZ/+ and Cln3+/+ were combined as control. Values are means ± SD. GPC, glycerophosphorylcholine. B: taurine influx in normal and CLN3p-null cells. [3H]taurine was added to medium, cell lysates were collected at 0, 15, and 30 min, and radioactivity was counted [counts/min (cpm)]. Values are means ± SD of duplicate cultures and are representative of 2 experiments.
Our data indicate that CLN3p is dispensable for osmolyte accumulation. However, CLN3p could affect the rate of transport or synthesis of an osmolyte, without changing the final steady-state level achieved after several days. Along with its role as an osmolyte in the kidney, taurine is also an important osmolyte in the hippocampus (36) and as a neurotrophin in the retina (43), two areas of neurodegeneration in JNCL. To determine whether the rate of taurine import is regulated by CLN3p, we measured [3H]taurine uptake in CLN3p-deficient vs. wild-type primary renal medullary cells. No significant differences in uptake were detected at 15 or 30 min (Fig. 4B), indicating that CLN3p absence does not disturb the kinetics of taurine uptake. In a separate experiment, we assessed taurine efflux. Primary IM cells were loaded with [3H]taurine, and efflux was measured 10 min after change from hypertonic (600 mosmol/kgH2O) to isotonic (300 mosmol/kgH2O) medium. [3H]taurine efflux was substantial for Cln3lacZ/lacZ and Cln3+/+ cells and similar for each genotype (65 ± 0.3 and 68 ± 0.1%, respectively), indicating that taurine efflux is also intact in CLN3p-deficient cells.
Enhanced water consumption and urine output in knockout mice.
In the kidney, interstitial osmolality in conjunction with selective expression and translocation of aquaporins along nephron segments and vasa recta permits osmotic flow of water for maintenance of body fluid. To assess whether CLN3p deficiency might affect renal functions related to water balance, we compared water consumption, urine output, and urine osmolality for Cln3lacZ/lacZ and Cln3+/+ mice after free access to water or water deprivation. CLN3p-deficient mice consumed significantly more water over 24 h and had higher urine volume and lower urine osmolality than controls (Fig. 5). However, with 24 h of water deprivation, urine output was diminished and was similar to Cln3+/+ controls with respect to osmolality (Fig. 5B) and volume (0.4 ± 0.33 and 0.46 ± 3 ml for wild-type and Cln3lacZ/lacZ, respectively). Thus, in the absence of CLN3p, mice display mild polyuria. However, water deprivation stimulates water conservation, such that deficient mice are able to concentrate their urine to levels similar to those observed in controls.
Fig. 5.

CLN3-deficient mice drink more water. Cln3+/+ and Cln3lacZ/lacZ mice were independently housed in metabolic cages with or without free access to water for 24-h collection of urine. Water consumption, urine output, and urine osmolality were measured. Histograms show means ± SE of 11–12 mice per group. A: with free access to water, CLN3p-deficient mice consumed more water and produced more urine over 24 h than controls. B: urine osmolality was lower for CLN3p-deficient mice with free access to water than wild-type controls but increased with water deprivation to levels not statistically different from controls. Increase in urine osmolalities upon water deprivation was significant for both groups. (t-test: **P < 0.005, *P < 0.05)
Abnormal K+ excretion in CLN3p-deficient mice.
Changes in water balance could reflect underlying defects in electrolyte transport across renal tubules. We measured serum and urine creatinine, electrolytes, blood urea nitrogen, and other indicators of kidney function (Tables 1 and 2). We found no significant differences between Cln3lacZ/lacZ and Cln3+/+ mice in urine pH or serum total CO2, suggesting that pH regulation is not impaired in CLN3p-deficient mice. Upon analysis of 24-h total and fractional excretion of ions, we determined that, with free access to water, serum K+ tended to be higher and fractional excretion of K+ was significantly lower in CLN3p-deficient than control mice (Tables 1 and 2). With water deprivation, fractional excretion of Mg2+ was significantly higher in CLN3p-deficient than control mice. This tendency to higher fractional excretion of Mg2+ was also observed in mice with free access to water. However, because serum Mg2+ was not different (tended to be higher in Cln3p-deficient mice), it is unlikely that the higher fractional excretion of Mg2+ represents a primary renal defect in the ability to conserve Mg2+. In contrast, the K+ abnormalities provide clear evidence for a defect in K+ excretion consequent to CLN3p deficiency.
Table 1.
Blood and serum chemistries
| Free Access to Water |
Water-Deprived |
|||
|---|---|---|---|---|
| +/+ | lacZ/lacZ | +/+ | lacZ/lacZ | |
| Creatinine, mg/dl | 0.35 ± 0.06 | 0.37 ± 0.04 | 0.24 ± 0.01 | 0.27 ± 0.03 |
| Albumin, g/dl | 2.3 ± 0.0 | 2.5 ± 0.1 | 2.5 ± 0.1 | 2.7 ± 0.1 |
| Hematocrit, %vol RBC | 45.2 ± 1.0 | 46.4 ± 0.5 | 48.7 ± 0.6 | 50.0 ± 0.8 |
| Osmolality, mosmol/kgH2O | 315 ± 3 | 317 ± 2 | 318 ± 1.4 | 334 ± 4* |
| Total CO2, mmol/l | 17.8 ± 0.7 | 18.7 ± 1.5 | 21.0 ± 0.8 | 19.3 ± 1.0 |
| Na+, mmol/l | 150 ± 2. | 152 ± 2 | 154 ± 1 | 151 ± 2 |
| K+, mmol/l | 6.0 ± 0.7 | 7.8 ± 0.6 | 4.8 ± 0.3 | 7.1 ± 0.4† |
| Mg2+, mg/dl | 3.1 ± 0.1 | 3.0 ± 0.1 | 2.7 ± 0.1 | 2.9 ± 0.1 |
| Ca2+, mg/dl | 9.0 ± 0.2 | 8.9 ± 0.2 | 9.5 ± 0.1 | 8.8 ± 0.5 |
| Phosphorus, mg/dl | 10.0 ± 0.4 | 10.1 ± 0.6 | 9.5 ± 0.2 | 9.3 ± 0.5 |
Values are means ± SE from 4-10 mice per group.
P < 0.005 vs. +/+.
P < 0.001 vs. +/+.
Table 2.
Urine chemistries
| Free Access to Water |
Water-Deprived |
|||
|---|---|---|---|---|
| +/+ | lacZ/lacZ | +/+ | lacZ/lacZ | |
| Urine 24-h excretion | ||||
| Creatinine, μg | 530 ± 46 | 675 ± 59 | 487 ± 76 | 473 ± 62 |
| Na+, μmol | 205 ± 23 | 243 ± 23 | 189 ± 31 | 190 ± 28 |
| K+, μmol | 331 ± 35 | 335 ± 38 | 280 ± 44 | 274 ± 34 |
| Mg2+, μg | 836 ± 101 | 1,069 ± 102 | 653 ± 97 | 742 ± 97 |
| Ca2+, μg | 49 ± 7 | 74 ± 7.8* | 32.5 ± 5.2 | 29.9 ± 3.5 |
| Phosphorus, μg | 4,950 ± 522 | 5,154 ± 507 | 3,968 ± 648 | 3,888 ± 507 |
| Fractional excretion, % | ||||
| Na+ | 0.95 ± 0.11 | 1.12 ± 0.14 | 0.56 ± 0.03 | 0.64 ± 0.09 |
| K+ | 37.6 ± 2.5 | 25.8 ± 2.9* | 26.8 ± 2.5 | 20.5 ± 2.3 |
| Mg2+ | 0.16 ± 0.02 | 0.21 ± 0.02 | 0.11 ± 0.01 | 0.15 ± 0.02* |
| Ca2+ | 0.0031 ± 0.0005 | 0.0074 ± 0.0029 | 0.0017 ± 0.0004 | 0.0018 ± 0.0002 |
| Phosphorus | 0.33 ± 0.04 | 0.31 ± 0.04 | 0.18 ± 0.01 | 0.24 ± 0.04 |
Values are means ± SE; n = 9–12 for 24 h total excretion and n = 4–6 for fractional excretion. Urine and serum were collected after 24 h of free access to water or after 24 h of water deprivation.
P < 0.05 vs. +/+.
Autofluorecence accumulation in Cln3lacZ/lacZ kidneys.
Lysosomal accumulation of autofluorescent lipofuscin-like material is a diagnostic pathological feature of JNCL (32, 49). We found significant autofluorescent material in all regions of Cln3lacZ/lacZ kidney from 8-wk-old mice but little to no such autofluorescent material in an age-matched Cln3+/+ kidney (Fig. 6). The appearance of inclusions was not restricted to cells expressing reporter protein. For example, in the cortex, we observed deposits in cells within proximal convoluted tubules (Fig. 6, bottom left), despite the fact that tubules were consistently reporter-negative by X-Gal and immunofluorescent staining. Indeed, in sections immunofluorescently stained for β-Gal, autofluorescent material was evident in the cytoplasm of cortical epithelial cells lacking β-Gal-positive nuclei (Fig. 2C, arrowheads). At 6 mo, autofluorescence accumulation was more extensive in all kidney regions (not shown), as expected by the progressive nature of this pathology.
Fig. 6.

Intracellular autofluorescent deposits are present in all kidney regions of CLN3-deficient mice. Kidney sections (40 μm) from 8.5-wk-old Cln3+/+ and Cln3lacZ/lacZ mice were mounted with Vectashield, and 0.45-μm confocal images were captured in the red channel and transformed to gray scale. Abundant autofluorescent storage is apparent in cortex, OM, and IM/papilla of Cln3lacZ/lacZ, but not Cln3+/+, kidneys.
DISCUSSION
In this study, we used a recombinant Cln3 reporter mouse, wherein β-Gal is transcribed from the native Cln3 promoter, to investigate the expression of Cln3 outside the CNS. We demonstrate that 1) Cln3 is expressed in nonneural tissues and is prevalent in IM cells of the kidney, 2) expression of Cln3 in renal medullary cells is osmoregulated, 3) CLN3p is not necessary for accumulation of major renal osmolytes, 4) CLN3p-null mice display polyuria, 5) K+ excretion is impaired in CLN3p-deficient mice, and 6) kidney cells in CLN3p-deficient mice accumulate autofluorescent inclusions.
As JNCL is largely a CNS disorder, it might be expected that CLN3p operates primarily in cells of the nervous system. However, on the basis of reporter expression, we find that Cln3 expression is not restricted to the nervous system. We detected reporter in many tissues, with very high expression in the kidney medulla. Reporter expression in the kidney paralleled the natural corticomedullary osmotic gradient, with the intensity and proportion of positive cells increasing with progression to the tip of the IM/papilla. Using primary renal medullary cultures derived from heterozygous reporter mice, we found that reporter protein levels correlated directly with the osmolality of the culture medium. Importantly, our in vivo data also support osmoregulation of Cln3.
Our results suggest that tonicity-responsive cis elements may function in the 5′-flanking region in the Cln3 locus. A number of genes expressed in the renal medulla are osmoregulated and are involved in response to marked changes in extracellular tonicity. Many of these genes, including the Na+-myo-inositol transporter (SMIT), the betaine transporter (BGT1), AR, and HSP70 are positively regulated by the tonicity-responsive element-binding protein (TonEBP) transcription factor (5, 15). Upon hypertonic stress, TonEBP is activated and translocates to the nucleus, where it acts at cis TonE/ORE (tonicity-responsive element/osmoresponsive element) sites in the 5′-flanking regions of osmoresponsive genes (16). Analysis of the 5′-flanking region sequence of the murine Cln3 gene reveals an 11-bp site (5′AGGAAAAACAC3′), 1,020 bp upstream of the ATG, that fits the TonE/ORE consensus sequence [5′NGGAAA(A/T)(T/A/G)(C/A/T)(A/C)C3′] (17). Functionality of this site awaits verification and does not preclude the possible existence of additional undefined tonicity-responsive elements, as reported for the AQP2 gene (27).
On the basis of the observed osmoregulation of renal Cln3 expression, we hypothesized that CLN3p might function in osmolyte synthesis or import. Intracellular accumulation of nonperturbing organic osmolytes allows cells to equilibrate their intracellular osmolality with the extracellular osmolality while maintaining normal concentrations of Na+ and K+. In this study, we found remarkable increases of osmolytes in CLN3p-deficient and control cells after culture in hyperosmotic conditions. We conclude that CLN3p is dispensable for osmolyte accumulation. In addition, we found no difference in taurine uptake or efflux between normal and CLN3p-deficient cells. These data imply that CLN3p does not facilitate osmolyte accumulation or taurine transport. However, we cannot dismiss the possibility that its role is subtle and was not detected in our study or that renal medullary cells enact compensatory mechanisms in the absence of CLN3p.
The results of the in vivo analysis of water balance indicate a mild defect in the ability to concentrate urine. When permitted free access to water, CLN3p-null mice were polyuric and polydipsic. The serum data do not support primary polydipsia (i.e., a thirst-regulating defect) as the cause of the polyuria. CLN3p-deficient mice had a tendency to higher serum osmolality, a higher hematocrit, and higher serum albumin than controls. These differences implicate polyuria as the main defect, causing the plasma hypertonicity, which in turn triggers increased drinking. The basis for the polyuria is not completely obvious, but we suggest two possibilities. First, there could be an abnormality in protein trafficking within the collecting duct. CLN3p has been implicated in endocytic processes and vesicular trafficking (18, 29), and one might envision a role for CLN3p in aquaporin (or other protein) trafficking to or from the plasma membrane.
A second possibility is that the polyuria is secondary to the defect in K+ excretion. Acute and chronic K+ loading causes accumulation of K+ in the renal medulla interstitium (26). This accumulation causes inhibition of NaCl absorption from the medullary TAL with, consequently, less hypertonicity of the renal medulla (52). This effect, similar to that of loop diuretics, could produce a modest concentrating defect. Whatever the cause, it is apparent that extreme water deprivation can overcome this defect. The precise nature of the concentrating defect in these Cln3p-deficient mice requires further investigation.
Our serum/plasma chemistry analyses uncovered an unexpected phenotype in the CLN3p-deficient mice. These mice were hyperkalemic and had a lower fractional excretion of K+ than control mice. Virtually all the K+ appearing in urine is secreted by the distal nephron. Thus, since the Cln3p-null mice had a relatively normal glomerular filtration rate (as evidenced by a normal serum creatinine and urea nitrogen), they had a significant impairment in their ability to secrete K+. The major mediators of K+ secretion in the distal nephron are renal OM K+ channel (Romic) and the large-conductance Ca2+-activated K+ (BK) channels, apically situated in principal cells of the connecting tubule, cortical collecting duct, and, to a lesser extent, the OM collecting duct (56). Normal K+ secretion requires that these apical K+ channels be functional. In addition, normal K+ secretion requires normal Na+ transport by these nephron segments. Na+ must enter the cell via the apical membrane epithelial Na+ channels and be pumped out of the basolateral membrane via the Na+-K+-ATPase. CLN3p could be involved in functional regulation or trafficking of one or more of these channel or transporter complexes. A role for CLN3p in the localization of some Na+-K+-ATPase subunits has recently been reported (55) and may have relevance to distal nephron K+ excretion. Abnormalities in water intake and K+ balance have not, to our knowledge, been described for JNCL patients. However, mild defects could go unnoticed because of wide normal ranges and uncontrolled presampling conditions. K+ is critical to modulation of neuronal membrane potential and excitability. Defective regulation of K+ concentration could have adverse CNS effects, contributing to seizure phenotype and neuronal excitotoxicity in JNCL.
Accumulation of autofluorescent deposits in a variety of cell types is a hallmark feature of the neuronal ceroid lipofuscinosis (NCL) diseases (reviewed in Ref. 49). These lysosomal inclusions are also referred to as lipopigments or ceroid. They contain protein, carbohydrate, and lipid and are distinct from the lipofuscin that accumulates with age in nondisease states. In most NCL forms, subunit c of the mitochondrial ATP synthase is the dominant protein component of inclusions. In JNCL mouse models, ceroid is evident in neuronal populations of the brain and retina (12, 28), as well as in hepatocytes (12). We observed significant autofluorescent inclusions in the kidneys of Cln3lacZ/lacZ mice, but not in age-matched controls. Inclusions were evident in all regions, in contrast to a more restricted expression pattern for β-Gal reporter. Renal inclusions in our JNCL mouse model are consistent with previous reports of renal autofluorescent deposits and subunit c detection in urine samples in JNCL patients (57). The origin of these lipopigments in JNCL is not known, and the relationship between these deposits, CLN3p expression, and cell viability is unclear (30). It is possible that renal phenotypes arise as an indirect consequence of cellular dysfunction related to storage buildup. However, most in vitro studies use actively proliferating cell lines from JNCL mouse models or patients and uncover functional abnormalities in the absence of autofluorescence buildup.
Studies in mammalian cells support roles for CLN3p in a variety of seemingly diverse intracellular processes, including apoptosis resistance (39, 41), lipid metabolism or transport (22, 45), and vesicular trafficking and endocytosis (18, 29). An ability of CLN3p to protect against apoptosis would be consistent with a need for upregulation under high-salt conditions and is reminiscent of the antiapoptotic state associated with HSP70 expression under chronic hypertonicity (46). In addition, a function for CLN3p in localization of galactosylceremide to the plasma membrane (45) corresponds with a reported hypertonicity-induced increase in galactosylceremide and sulfatide synthesis in polarized Madin-Darby canine kidney cells (35). Interestingly, 1H-NMR spectroscopic analysis of brain tissues from CLN3p-deficient mice revealed elevated levels of myo-inositol, creatine, N-acetyl-aspartate, and taurine compared with controls (38), all of which have postulated roles in osmoregulation (3, 24).
The expression of CLN3p in epidermis, colonic epithelia, and lung epithelia, together with the very strong expression in the renal IM, adds to the evidence that it may be involved in defending against changes in cell volume. Epithelial cells, and particularly these epithelial cells, are especially susceptible to changes in cell volume by virtue of their role in regulating solute and water transport through the cell. The ability of an epithelial cell to regulate its volume while transporting large amounts of solute and water requires a delicate balance of transport activity and, possibly, metabolism of osmolytes. The expression of CLN3p in specific kidney cells is consistent with this idea. Whereas principal cells of the collecting duct can transport relatively large amounts of water and Na+, IC cells of the collecting duct and cells of the TAL are water impermeant. Thus the expression of large amounts of CLN3p in cells that must invoke robust defense against perturbations in cell volume supports the general idea that it is involved in osmoregulation. It is conceivable that CLN3p performs a tonicity-related function in the CNS, as well as the kidney and other epithelia.
In summary, our findings implicate CLN3p in renal regulation of water balance and K+ secretion. The contribution of CLN3p to these pathways, particularly in the setting of JNCL, requires further testing. The novel information from this study brings us closer to elucidating the molecular function of CLN3p and understanding JNCL pathogenesis.
GRANTS
This work was supported in part by the Batten Disease Support and Research Association, the NCL Foundation, the Roy J. Carver Trust, National Institute of Diabetes and Digestive and Kidney Diseases O'Brien Kidney Research Center Grant DK-52617, and a Veterans Affairs Medical Center Merit Grant.
DISCLOSURES
No conflicts of interest, financial or otherwise, are declared by the authors.
ACKNOWLEDGMENTS
We acknowledge the technical assistance of S. L. Eliason, D. M. Gaines, S. E. Gerard, and R. F. Husted. We thank the Central Microscopy Research Facility at the University of Iowa.
REFERENCES
- 1. Bankir L. Urea and the kidney. In: The Kidney ( 5th ed.), edited by Brenner BM, Rector FC. Philadelphia, PA: Saunders, 1996 [Google Scholar]
- 2. Beck FX, Grunbein R, Lugmayr K, Neuhofer W. Heat shock proteins and the cellular response to osmotic stress. Cell Physiol Biochem 10: 303–306, 2000 [DOI] [PubMed] [Google Scholar]
- 3. Bothwell JH, Rae C, Dixon RM, Styles P, Bhakoo KK. Hypo-osmotic swelling-activated release of organic osmolytes in brain slices: implications for brain oedema in vivo. J Neurochem 77: 1632–1640, 2001 [DOI] [PubMed] [Google Scholar]
- 4. Braak H, Goebel HH. Loss of pigment-laden stellate cells: a severe alteration of the isocortex in juvenile neuronal ceroid-lipofuscinosis. Acta Neuropathol (Berl) 42: 53–57, 1978 [DOI] [PubMed] [Google Scholar]
- 5. Burg MB, Kwon ED, Kultz D. Regulation of gene expression by hypertonicity. Annu Rev Physiol 59: 437–455, 1997 [DOI] [PubMed] [Google Scholar]
- 6. Burger-Kentischer A, Muller E, Neuhofer W, Marz J, Thurau K, Beck F. Expression of aldose reductase, sorbitol dehydrogenase and Na+/myo-inositol and Na+/Cl−/betaine transporter mRNAs in individual cells of the kidney during changes in the diuretic state. Pflügers Arch 437: 248–254, 1999 [DOI] [PubMed] [Google Scholar]
- 7. Cai Q, Dmitrieva NI, Ferraris JD, Brooks HL, van Balkom BW, Burg M. Pax2 expression occurs in renal medullary epithelial cells in vivo and in cell culture, is osmoregulated, and promotes osmotic tolerance. Proc Natl Acad Sci USA 102: 503–508, 2005 [DOI] [PMC free article] [PubMed] [Google Scholar]
- 8. Cao Y, Espinola JA, Fossale E, Massey AC, Cuervo AM, MacDonald ME, Cotman SL. Autophagy is disrupted in a knock-in mouse model of juvenile neuronal ceroid lipofuscinosis. J Biol Chem 281: 20483–20493, 2006 [DOI] [PubMed] [Google Scholar]
- 9. Chattopadhyay S, Pearce DA. Interaction with Btn2p is required for localization of Rsglp: Btn2p-mediated changes in arginine uptake in Saccharomyces cerevisiae. Eukaryot Cell 1: 606–612, 2002 [DOI] [PMC free article] [PubMed] [Google Scholar]
- 10. Codlin S, Haines RL, Mole SE. Btn1 affects endocytosis, polarization of sterol-rich membrane domains and polarized growth in Schizosaccharomyces pombe. Traffic 9: 936–950, 2008 [DOI] [PMC free article] [PubMed] [Google Scholar]
- 11. Codlin S, Mole SES. pombe btn1, the orthologue of the Batten disease gene CLN3, is required for vacuole protein sorting of Cpy1p and Golgi exit of Vps10p. J Cell Sci 122: 1163–1173, 2009 [DOI] [PMC free article] [PubMed] [Google Scholar]
- 12. Cotman SL, Vrbanac V, Lebel LA, Lee RL, Johnson KA, Donahue LR, Teed AM, Antonellis K, Bronson RT, Lerner TJ, MacDonald ME. Cln3(Δex7/8) knock-in mice with the common JNCL mutation exhibit progressive neurologic disease that begins before birth. Hum Mol Genet 11: 2709–2721, 2002 [DOI] [PubMed] [Google Scholar]
- 13. Eksandh LB, Ponjavic VB, Munroe PB, Eiberg HE, Uvebrant PE, Ehinger BE, Mole SE, Andreasson S. Full-field ERG in patients with Batten/Spielmeyer-Vogt disease caused by mutations in the CLN3 gene. Ophthalmic Genet 21: 69–77, 2000 [PubMed] [Google Scholar]
- 14. Eliason SL, Stein CS, Mao Q, Tecedor L, Ding SL, Gaines DM, Davidson BL. A knock-in reporter model of Batten disease. J Neurosci 27: 9826–9834, 2007 [DOI] [PMC free article] [PubMed] [Google Scholar]
- 15. Ferraris JD, Burg MB. Tonicity-dependent regulation of osmoprotective genes in mammalian cells. Contrib Nephrol 152: 125–141, 2006 [DOI] [PubMed] [Google Scholar]
- 16. Ferraris JD, Burg MB. Tonicity-regulated gene expression. Methods Enzymol 428: 279–296, 2007 [DOI] [PubMed] [Google Scholar]
- 17. Ferraris JD, Williams CK, Ohtaka A, Garcia-Perez A. Functional consensus for mammalian osmotic response elements. Am J Physiol Cell Physiol 276: C667–C673, 1999 [DOI] [PubMed] [Google Scholar]
- 18. Fossale E, Wolf P, Espinola JA, Lubicz-Nawrocka T, Teed AM, Gao H, Rigamonti D, Cattaneo E, MacDonald ME, Cotman SL. Membrane trafficking and mitochondrial abnormalities precede subunit c deposition in a cerebellar cell model of juvenile neuronal ceroid lipofuscinosis. BMC Neurosci 5: 57, 2004 [DOI] [PMC free article] [PubMed] [Google Scholar]
- 19. Garcia-Perez A, Burg MB. Renal medullary organic osmolytes. Physiol Rev 71: 1081–1115, 1991 [DOI] [PubMed] [Google Scholar]
- 20. Garcia-Perez A, Burg MB. Role of organic osmolytes in adaptation of renal cells to high osmolality. J Membr Biol 119: 1–13, 1991 [DOI] [PubMed] [Google Scholar]
- 21. Golabek AA, Kida E, Walus M, Kaczmarski W, Michalewski M, Wisniewski KE. CLN3 protein regulates lysosomal pH and alters intracellular processing of Alzheimer's amyloid-β protein precursor and cathepsin D in human cells. Mol Genet Metab 70: 203–213, 2000 [DOI] [PubMed] [Google Scholar]
- 22. Hobert JA, Dawson G. A novel role of the Batten disease gene CLN3: association with BMP synthesis. Biochem Biophys Res Commun 358: 111–116, 2007 [DOI] [PMC free article] [PubMed] [Google Scholar]
- 23. Hussy N, Deleuze C, Desarmenien MG, Moos FC. Osmotic regulation of neuronal activity: a new role for taurine and glial cells in a hypothalamic neuroendocrine structure. Prog Neurobiol 62: 113–134, 2000 [DOI] [PubMed] [Google Scholar]
- 24. Isaacks RE, Bender AS, Kim CY, Prieto NM, Norenberg MD. Osmotic regulation of myo-inositol uptake in primary astrocyte cultures. Neurochem Res 19: 331–338, 1994 [DOI] [PubMed] [Google Scholar]
- 25. Jalanko A, Braulke T. Neuronal ceroid lipofuscinoses. Biochim Biophys Acta 1793: 697–709, 2009 [DOI] [PubMed] [Google Scholar]
- 26. Jamison RL. Potassium recycling. Kidney Int 31: 695–703, 1987 [DOI] [PubMed] [Google Scholar]
- 27. Kasono K, Saito T, Tamemoto H, Yanagidate C, Uchida S, Kawakami M, Sasaki S, Ishikawa SE. Hypertonicity regulates the aquaporin-2 promoter independently of arginine vasopressin. Nephrol Dial Transplant 20: 509–515, 2005 [DOI] [PubMed] [Google Scholar]
- 28. Katz ML, Johnson GS, Tullis GE, Lei B. Phenotypic characterization of a mouse model of juvenile neuronal ceroid lipofuscinosis. Neurobiol Dis 29: 242–253, 2008 [DOI] [PMC free article] [PubMed] [Google Scholar]
- 29. Luiro K, Yliannala K, Ahtiainen L, Maunu H, Jarvela I, Kyttala A, Jalanko A. Interconnections of CLN3, Hook1 and Rab proteins link Batten disease to defects in the endocytic pathway. Hum Mol Genet 13: 3017–3027, 2004 [DOI] [PubMed] [Google Scholar]
- 30. Mitchison HM, Lim MJ, Cooper JD. Selectivity and types of cell death in the neuronal ceroid lipofuscinoses. Brain Pathol 14: 86–96, 2004 [DOI] [PMC free article] [PubMed] [Google Scholar]
- 31. Moeckel GW, Zhang L, Chen X, Rossini M, Zent R, Pozzi A. Role of integrin α1β1 in the regulation of renal medullary osmolyte concentration. Am J Physiol Renal Physiol 290: F223–F231, 2006 [DOI] [PubMed] [Google Scholar]
- 32. Mole SE, Williams RE, Goebel HH. Correlations between genotype, ultrastructural morphology and clinical phenotype in the neuronal ceroid lipofuscinoses. Neurogenetics 6: 107–126, 2005 [DOI] [PubMed] [Google Scholar]
- 33. Narayan SB, Rakheja D, Tan L, Pastor JV, Bennett MJ. CLN3P, the Batten's disease protein, is a novel palmitoyl-protein Δ9 desaturase. Ann Neurol 60: 570–577, 2006 [DOI] [PubMed] [Google Scholar]
- 34. Neuhofer W, Beck FX. Cell survival in the hostile environment of the renal medulla. Annu Rev Physiol 67: 531–555, 2005 [DOI] [PubMed] [Google Scholar]
- 35. Niimura Y, Nagai K. Metabolic responses of sulfatide and related glycolipids in Madin-Darby canine kidney (MDCK) cells under osmotic stresses. Comp Biochem Physiol B Biochem Mol Biol 149: 161–167, 2008 [DOI] [PubMed] [Google Scholar]
- 36. Olson JE, Li GZ. Osmotic sensitivity of taurine release from hippocampal neuronal and glial cells. Adv Exp Med Biol 483: 213–218, 2000 [DOI] [PubMed] [Google Scholar]
- 37. Pearce DA, Ferea T, Nosel SA, Das B, Sherman F. Action of BTN1, the yeast orthologue of the gene mutated in Batten disease. Nat Genet 22: 55–58, 1999 [DOI] [PubMed] [Google Scholar]
- 38. Pears MR, Cooper JD, Mitchison HM, Mortishire-Smith RJ, Pearce DA, Griffin JL. High-resolution 1H-NMR-based metabolomics indicates a neurotransmitter cycling deficit in cerebral tissue from a mouse model of Batten disease. J Biol Chem 280: 42508–42514, 2005 [DOI] [PubMed] [Google Scholar]
- 39. Persaud-Sawin DA, VanDongen A, Boustany RM. Motifs within the CLN3 protein: modulation of cell growth rates and apoptosis. Hum Mol Genet 11: 2129–2142, 2002 [DOI] [PubMed] [Google Scholar]
- 40. Phillips SN, Benedict JW, Weimer JM, Pearce DA. CLN3, the protein associated with Batten disease: structure, function and localization. J Neurosci Res 79: 573–583, 2005 [DOI] [PubMed] [Google Scholar]
- 41. Puranam KL, Guo WX, Qian WH, Nikbakht K, Boustany RM. CLN3 defines a novel antiapoptotic pathway operative in neurodegeneration and mediated by ceramide. Mol Genet Metab 66: 294–308, 1999 [DOI] [PubMed] [Google Scholar]
- 42. Ramirez-Montealegre D, Pearce DA. Defective lysosomal arginine transport in juvenile Batten disease. Hum Mol Genet 14: 3759–3773, 2005 [DOI] [PubMed] [Google Scholar]
- 43. Renteria RC, Johnson J, Copenhagen DR. Need rods? Get glycine receptors and taurine. Neuron 41: 839–841, 2004 [DOI] [PubMed] [Google Scholar]
- 44. Rosenberg NK, Lee RW, Yancey PH. High contents of hypotaurine and thiotaurine in hydrothermal-vent gastropods without thiotrophic endosymbionts. J Exp Zoolog A Comp Exp Biol 305: 655–662, 2006 [DOI] [PubMed] [Google Scholar]
- 45. Rusyn E, Mousallem T, Persaud-Sawin DA, Miller S, Boustany RM. CLN3p impacts galactosylceramide transport, raft morphology, and lipid content. Pediatr Res 63: 625–631, 2008 [DOI] [PubMed] [Google Scholar]
- 46. Santos BC, Pullman JM, Chevaile A, Welch WJ, Gullans SR. Chronic hyperosmolarity mediates constitutive expression of molecular chaperones and resistance to injury. Am J Physiol Renal Physiol 284: F564–F574, 2003 [DOI] [PubMed] [Google Scholar]
- 47. Saransaari P, Oja SS. Taurine and neural cell damage. Amino Acids 19: 509–526, 2000 [DOI] [PubMed] [Google Scholar]
- 48. Schmidt-Nielsen B, Graves B, Roth J. Water removal and solute additions determining increases in renal medullary osmolality. Am J Physiol Renal Fluid Electrolyte Physiol 244: F472–F482, 1983 [DOI] [PubMed] [Google Scholar]
- 49. Seehafer SS, Pearce DA. You say lipofuscin, we say ceroid: defining autofluorescent storage material. Neurobiol Aging 27: 576–588, 2006 [DOI] [PubMed] [Google Scholar]
- 50. Shioda R, Reinach PS, Hisatsune T, Miyamoto Y. Osmosensitive taurine transporter expression and activity in human corneal epithelial cells. Invest Ophthalmol Vis Sci 43: 2916–2922, 2002 [PubMed] [Google Scholar]
- 51. Smardo FL, Jr, Burg MB, Garcia-Perez A. Kidney aldose reductase gene transcription is osmotically regulated. Am J Physiol Cell Physiol 262: C776–C782, 1992 [DOI] [PubMed] [Google Scholar]
- 52. Stokes JB. Consequences of potassium recycling in the renal medulla. Effects of ion transport by the medullary thick ascending limb of Henle's loop. J Clin Invest 70: 219–229, 1982 [DOI] [PMC free article] [PubMed] [Google Scholar]
- 53. Stokes JB, Grupp C, Kinne RK. Purification of rat papillary collecting duct cells: functional and metabolic assessment. Am J Physiol Renal Fluid Electrolyte Physiol 253: F251–F262, 1987 [DOI] [PubMed] [Google Scholar]
- 54. Tyynela J, Cooper JD, Khan MN, Shemilts SJ, Haltia M. Hippocampal pathology in the human neuronal ceroid-lipofuscinoses: distinct patterns of storage deposition, neurodegeneration and glial activation. Brain Pathol 14: 349–357, 2004 [DOI] [PMC free article] [PubMed] [Google Scholar]
- 55. Uusi-Rauva K, Luiro K, Tanhuanpaa K, Kopra O, Martin-Vasallo P, Kyttala A, Jalanko A. Novel interactions of CLN3 protein link Batten disease to dysregulation of fodrin-Na+,K+ ATPase complex. Exp Cell Res 314: 2895–2905, 2008 [DOI] [PubMed] [Google Scholar]
- 56. Wang WH, Giebisch G. Regulation of potassium (K) handling in the renal collecting duct. Pflügers Arch 458: 157–168, 2009 [DOI] [PMC free article] [PubMed] [Google Scholar]
- 57. Wisniewski KE, Golabek AA, Kida E. Increased urine concentration of subunit c of mitochondrial ATP synthase in neuronal ceroid lipofuscinoses patients. J Inherit Metab Dis 17: 205–210, 1994 [DOI] [PubMed] [Google Scholar]
- 58. Wolff SD, Yancey PH, Stanton TS, Balaban RS. A simple HPLC method for quantitating major organic solutes of renal medulla. Am J Physiol Renal Fluid Electrolyte Physiol 256: F954–F956, 1989 [DOI] [PubMed] [Google Scholar]
- 59. Yancey PH. Organic osmolytes as compatible, metabolic and counteracting cytoprotectants in high osmolarity and other stresses. J Exp Biol 208: 2819–2830, 2005 [DOI] [PubMed] [Google Scholar]
- 60. Zhang Z, Cai Q, Michea L, Dmitrieva NI, Andrews P, Burg MB. Proliferation and osmotic tolerance of renal inner medullary epithelial cells in vivo and in cell culture. Am J Physiol Renal Physiol 283: F302–F308, 2002. [DOI] [PubMed] [Google Scholar]