

Abstract
Purpose: To retrospectively determine whether relative cerebral blood volume (CBV) measurements can be used to predict clinical outcome in patients with high-grade gliomas (HGGs) and low-grade gliomas (LGGs) and specifically whether patients who have gliomas with a high initial relative CBV have more rapid progression than those who have gliomas with a low relative CBV.
Materials and Methods: Approval for this retrospective HIPAA-compliant study was obtained from the Institutional Board of Research Associates, with waiver of informed consent. One hundred eighty-nine patients (122 male and 67 female patients; median age, 43 years; range, 4–80 years) were examined with dynamic susceptibility-weighted contrast material–enhanced perfusion magnetic resonance (MR) imaging and were followed up clinically with MR imaging (median follow-up, 334 days). Log-rank tests were used to evaluate the association between relative CBV and time to progression by using Kaplan-Meier curves. Binary logistic regression was used to determine whether age, sex, and relative CBV were associated with an adverse event (progressive disease or death).
Results: Values for the mean relative CBV for patients according to each clinical response were as follows: 1.41 ± 0.13 (standard deviation) for complete response (n = 4), 2.36 ± 1.78 for stable disease (n = 41), 4.84 ± 3.32 for progressive disease (n = 130), and 3.82 ± 1.93 for death (n = 14). Kaplan-Meier estimates of median time to progression in days indicated that patients with a relative CBV of less than 1.75 had a median time to progression of 3585 days, whereas patients with a relative CBV of more than 1.75 had a time to progression of 265 days. Age and relative CBV were also independent predictors for clinical outcome.
Conclusion: Dynamic susceptibility-weighted contrast-enhanced perfusion MR imaging can be used to predict median time to progression in patients with gliomas, independent of pathologic findings. Patients who have HGGs and LGGs with a high relative CBV (>1.75) have a significantly more rapid time to progression than do patients who have gliomas with a low relative CBV.
© RSNA, 2008
Keywords: AA = anaplastic astrocytoma, AOA = anaplastic oligodendroglioma, CBV = cerebral blood volume, FLAIR = fluid-attenuated inversion recovery, GBM = glioblastoma multiforme, HGG = high-grade glioma, LGA = low-grade fibrillary astrocytoma, LGG = low-grade glioma, LGO = low-grade oligodendroglioma, LGOA = low-grade oligoastrocytoma
The existence of multiple approaches to pathologic classification of human glioma implies that there is a lack of consensus among pathology experts as to which is the single best approach (1–5). These multiple grading systems do, however, agree in regard to the histologic parameters that are important in the determination of glioma biology, namely hypercellularity, pleomorphism, vascular endothelial proliferation, mitotic activity, and necrosis. The difficulties in such grading systems are that each classification all too often rests on permissive criteria (ie, histologic features that may or may not be present in tumors in each diagnostic category) and not on rigorous statements containing terms such as “must be present” or “must not be present” and also that some of these criteria are subjectively defined or identified.
Without strictly specified histologic features, diagnoses are often open to subjective interpretations. This dilemma is further compounded by other well-known limitations of neuropathologic assessment of the central nervous system as follows: (a) Only a few small samples of tissue are examined, particularly when the samples are acquired by using stereotactic biopsy, so that the most malignant portion of a tumor may not be sampled (sampling error) (6). (b) A range of samples may be difficult to obtain if the tumor is inaccessible to the surgeon. (c) Interpathologist and intrapathologist variability may be present (7,8). (d) Central nervous system tumors have a dynamic nature, with a substantial proportion of low-grade gliomas (LGGs) progressing to malignant high-grade gliomas (HGGs) or secondary glioblastoma multiforme (GBM); it is the belief of some neurosurgeons that, given time, all LGGs will progress to HGGs (9). (e) Histologically, gliomas that are conferred the same pathologic grade may not only have different biologic behavior but also respond differently to treatment, according to recently discovered molecular (1p19q deletions) and genetic markers (10).
Dynamic susceptibility-weighted contrast material–enhanced perfusion magnetic resonance (MR) imaging is a technique that can provide physiologic information about vascular endothelial proliferation, vascular density, and angiogenesis (11–19). Since vascular proliferation is an important factor in the biology of astrocytomas (20), we hypothesized that dynamic susceptibility-weighted contrast-enhanced MR imaging can provide a means of characterizing tumor biology. The purpose of our study, therefore, was to retrospectively determine whether relative cerebral blood volume (CBV) measurements can be used to predict clinical outcome in patients with HGGs and LGGs and specifically whether patients who have gliomas with a high initial relative CBV have more rapid progression than those who have gliomas with a low relative CBV.
MATERIALS AND METHODS
Patients and Follow-up
Approval for this retrospective, Health Insurance Portability and Accountability Act–compliant study was obtained from the Institutional Board of Research Associates, with waiver of informed consent. One hundred eighty-nine patients with pathologically proved gliomas (World Health Organization classification II–IV) who met the inclusion criteria were derived from our database. Inclusion criteria included the following: (a) The candidate was male or female and was referred for preoperative assessment of intracranial tumors. (b) No evidence of systemic malignancy or immune status compromise was present.
The study included 122 male patients and 67 female patients (median age, 43 years; range, 4–80 years). Within this group of 189 patients, 21 LGGs had been previously reported in investigations of clinical response in LGGs (21,22). Histopathologic evaluation was independently performed by two experienced neuropathologists (D.Z. and D.C.M., with 17 and 25 years of experience with brain disease, respectively) and was based on the World Health Organization four-tier classification of gliomas (3): grade II, low-grade fibrillary astrocytoma (LGA) (n = 28); grade II, low-grade oligoastrocytoma (LGOA) (n = 11); grade II, low-grade oligodendroglioma (LGO) (n = 14); grade III, anaplastic astrocytoma (AA) (n = 72); grade III, anaplastic oligoastrocytoma (n = 12); and grade IV, GBM (n = 52). Juvenile pilocytic astrocytomas (grade I) were excluded from this study, because they have been previously described as having elevated relative CBV that may confound the utility of relative CBV for the prediction of glioma grade (23).
The patients were followed up, with a median follow-up of 334 days (range, 30–3585 days). The patients were assessed clinically, and they were examined with imaging, by using conventional MR imaging, single-dimension measurements of contrast-enhanced T1 enhancement and T2 signal hyperintensity (for tumor size), as well as serial relative CBV measurements. The maximal tumor dimension was determined by using a single measurement of the largest dimension as described for the Response Evaluation Criteria in Solid Tumors technique (24). Each patient was assigned to a different clinical response category on the basis of clinical chart review and findings on MR images (independently reviewed by N.P. and M.L., who each had 8 years of experience reviewing brain MR images). The four response categories were complete response, stable disease, progressive disease, and death. These categories were based, in part, on the methodology described by Levin et al (25). A complete response was defined as no visible tumor on an MR image and no new neurologic deficit. Stable disease was defined as no change in the patient's neurologic examination results and Karnofsky score and a less than 25% change in tumor size on MR images. Progressive disease was defined as a decline in the neurologic status and Karnofsky score or an increase in tumor size of more than 25% on MR images. The patients were assessed by their neuro-oncologist at 3-month intervals, at which time MR imaging also was performed.
Conventional MR Imaging
Imaging was performed with 1.5-T systems (Avanto, Vision, or Symphony; Siemens, Erlangen, Germany). A localizing sagittal T1-weighted MR image was obtained, and then transverse nonenhanced T1-weighted spin-echo MR images (repetition time msec/echo time msec, 600/14), transverse fluid-attenuated inversion-recovery (FLAIR) MR images (repetition time msec/echo time msec/inversion time msec, 9000/110/2500), and T2-weighted MR images (3400/119) were obtained. Transverse contrast-enhanced T1-weighted imaging was performed after the acquisition of the dynamic susceptibility-weighted contrast-enhanced MR imaging data. The section thickness was 5 mm, with a matrix of either 256 × 256 or 512 × 512 by using a 240 × 240-mm field of view. For a 256 × 256 matrix and a 240 × 240-mm field of view, the pixel dimension was 0.9 mm, and for a 512 × 512 matrix, the pixel dimension was 0.46 mm.
Dynamic Susceptibility-weighted Contrast-enhanced MR Imaging
Dynamic susceptibility-weighted contrast-enhanced MR images were acquired with a gradient-echo echo-planar imaging sequence during the first pass of a standard-dose (0.1 mmol/kg) bolus of gadopentetate dimeglumine (Magnevist; Berlex Laboratories, Wayne, NY). Seven to 10 sections were positioned to cover the tumor, on the basis of findings on T2-weighted and FLAIR MR images. Imaging parameters were as follows: 1000/54; field of view, 230 × 230 mm; section thickness, 5 mm; matrix, 128 × 128; in-plane voxel size, 1.8 × 1.8 mm; intersection gap, 0%–30%; flip angle, 30°; and signal bandwidth, 1470 Hz/pixel. Contrast agent was injected at a rate of 5 mL/sec with a power injector (Medrad, Warrendale, Pa), followed by administration of a 20-mL bolus of saline at 5 mL/sec. The injection rate was 5 mL/sec in all patients, except for the three patients in the 0–9-year age group, in whom the injection rate was reduced to 3 mL/sec. A total of 60 images were acquired at 1-second intervals, with the injection occurring at the fifth image so that the bolus would typically arrive at the 15th to 20th image.
Relative CBV Measurements
The procedure used to calculate relative CBV from the dynamic susceptibility-weighted contrast-enhanced MR image data is based on standard algorithms that have been previously described (12,26,27). A summary of the analysis is provided as follows: During the first pass of the bolus of contrast agent, T2* is reduced, and hence the signal intensity on T2*-weighted images decreases. The change in relaxation rate (ΔR2*) (ie, the change in the reciprocal of T2*) can be calculated from the signal intensity with the following equation: ΔR2*(t) = −ln[SI(t)/SI0]/TE, where SI(t) is the signal intensity at time t, SI0 is the nonenhanced signal intensity, and TE is the echo time. ΔR2* is proportional to the concentration of contrast agent in the tissue, and CBV is proportional to the area under the curve of ΔR2*(t), provided there is no recirculation or leakage of contrast agent. In general, these assumptions are violated, but the effects can be reduced by fitting a gamma-variate function to the measured ΔR2* curve. This function approximates the curve that would have been obtained without recirculation or leakage. CBV can then be estimated from the area under the fitted curve rather than from the original data. This analysis does not give an absolute measurement of CBV so that values have to be expressed as a ratio relative to the value measured in some standard tissue, typically normal contralateral white or gray matter, depending on tumor location.
Data processing was performed with an operating system (Unix; Open Software Foundation, Palo Alto, Calif) and programs developed in house by using the Interactive Data Language programming language. Color overlay maps of relative CBV were calculated, but to improve signal-to-noise ratio, relative CBV measurements were calculated from regions of interest that were placed in regions of highest perfusion seen on the relative CBV color overlay maps. Four separate region-of-interest measurements were made, and the maximum value was recorded. Some investigators (28) have demonstrated that this method for the measurement of maximal abnormality provides the highest intra- and interobserver reproducibility in relative CBV measurements. To minimize confounding factors in relative CBV analysis, the size of the regions of interest was kept constant (radius, 3.6 mm). Relative CBV measurements were obtained by a neuroradiologist (R.J.Y.) with 8 years of experience in perfusion data acquisition. The relative CBV measurements, the gathering of the clinical follow-up and imaging data, and the pathologic evaluation were performed independently and in a blinded fashion.
Statistical Analysis
Means, standard deviations, and medians of relative CBV measurements for patients classified in each clinical response category (complete response, stable disease, progressive disease, death) were obtained. The number of observations, the mean ± standard deviation of relative CBV, and the percentage of tumors with a high relative CBV of more than 1.75 stratified according to histologic tumor type also were determined.
Log-rank tests were used to evaluate the association of relative CBV with time to progression, defined as the time from the initial surgical diagnosis to the time of tumor progression. Data for patients who died of disease included uncensored times to progression, whereas data for those patients with a complete response and stable disease at the time of the most recent follow-up were right censored. The analysis was conducted with and without inclusion of pathologic status (AA, anaplastic oligodendroglioma [AOA], GBM, LGA, LGO, LGOA) as a stratification factor and examined the association of time to progression with a binary categorization of relative CBV as high versus low. Patients were classified in groups with low and high relative CBV by using a CBV threshold value of 1.75. This threshold value had previously been found by Law et al (13) to provide the optimal sensitivity and specificity for differentiating LGGs from HGGs in a logistic regression analysis of 120 HGGs and 40 LGGs. Kaplan-Meier survival curves and the log-rank test were used to characterize and compare the groups with high and low relative CBV, as well as groups with different histologic subtypes, in terms of time to progression.
Binary logistic regression was also used to determine whether age, sex, and relative CBV were associated with an adverse event (progressive disease or death). All statistical computations were performed by using software (SAS System for Windows, version 9.0, 2002; SAS Institute, Cary, NC), and results were declared significant at the two-sided 5% comparisonwise significance level (P < .05). Bonferroni adjustment was performed.
RESULTS
Mean relative CBV values for patients with each clinical response were as follows: 1.41 ± 0.13 (standard deviation) for complete response (n = 4), 2.36 ± 1.78 for stable disease (n = 41), 4.84 ± 3.32 for progressive disease (n = 130), and 3.82 ± 1.93 for death (n = 14) (Table 1). Table 2 presents the number of observations (patients) relative CBV values, and percentage of tumors with a high relative CBV of more than 1.75 stratified according to histologic tumor type.
Table 1.
Mean and Median Relative CBV for Patients with Each Clinical Response
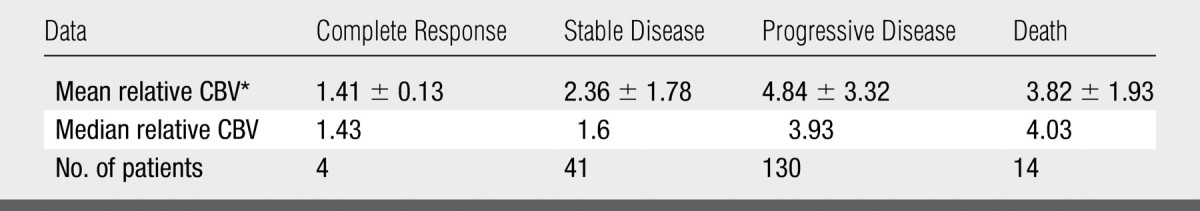
Data are the mean ± standard deviation.
Table 2.
Number of Observations, Relative CBV, and Percentage of Tumors with High Relative CBV Stratified according to Histologic Tumor Type
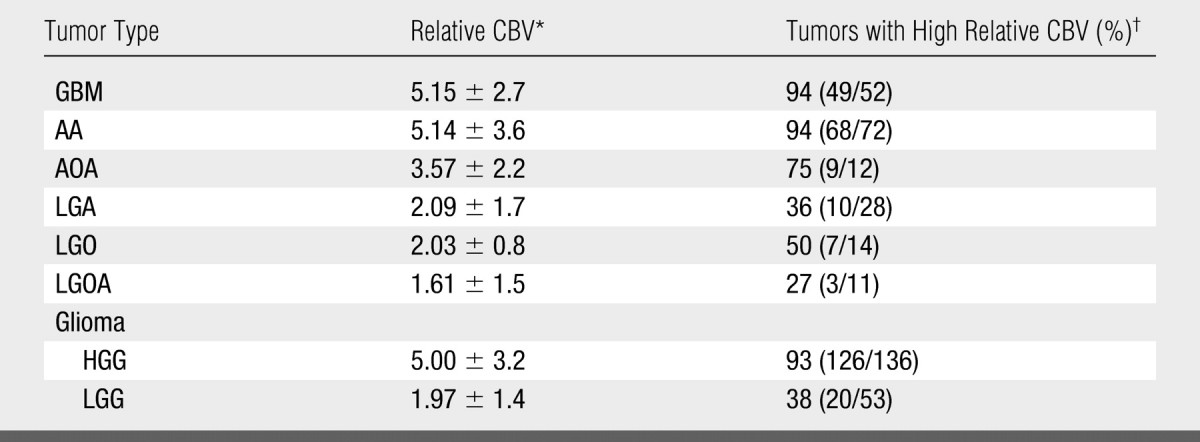
Data are the mean ± standard deviation.
High relative CBV is a relative CBV of more than 1.75. Numbers in parentheses were used to calculate the percentages. Total number of observations (patients) was 189.
Clinical Response: Kaplan-Meier Curves and Log-Rank Tests
The Kaplan-Meier progression-free survival curves for HGGs and LGGs with high and low relative CBV are shown in Figure 1. Patients with a relative CBV of less than 1.75 had a median time to progression of 3585 days, whereas patients with a relative CBV of more than 1.75 had a time to progression of 265 days irrespective of histopathologic tumor type. LGGs with relative CBV of less than 1.75 had a significantly longer time to progression than did LGGs with a relative CBV of more than 1.75 (Fig 2). Similarly, HGGs with a relative CBV of less than 1.75 also had significantly longer time to progression than did HGGs with a relative CBV of more than 1.75 (Figs 1, 3). The Kaplan-Meier progression-free survival curves for gliomas of different histologic tumor type (Fig 4) indicate that the time to progression is concordant with histologic tumor type, with LGO having the longest time to progression, followed by LGA, LGOA, AOA, AA, and GBM. When the Kaplan-Meier curves and log-rank tests were used to evaluate the association of relative CBV with overall survival, it was found that the binary representation of relative CBV was not significantly associated with survival (P > .63), irrespective of whether pathologic status was adjusted and irrespective of whether patients with LGO, LGOA, or AOA were included in the analysis. Because much fewer than 50% of patients died of disease, no valid estimates of median overall survival could be generated.
Figure 1:

Kaplan-Meier survival curves for progression-free survival in LGG group with low relative CBV (<1.75) and LGG group with high relative CBV (>1.75) show significant difference in time to progression in LGGs stratified according to relative CBV alone (P < .0001). When HGGs were compared, there was a significant difference in progression in HGGs with high relative CBV versus low relative CBV (P < .0001). Among subjects with low relative CBV, there was a significant difference between HGGs and LGGs with respect to progression-free survival (P = .047). Among subjects with high relative CBV, time to progression was not significantly different (P = .266) for LGGs and HGGs.
Figure 2:

Pathologically proved low-grade astrocytoma in 22-year-old man. A–D, Transverse T1-weighted contrast-enhanced MR images (600/14) show subtle contrast enhancement in left frontal lobe. Transverse, B, T2-weighted and, C, intermediate-weighted MR images (3400/19) show slight increased signal intensity involving left frontal lobe, consistent with LGG (arrow). D, Transverse gradient-echo dynamic susceptibility-weighted contrast-enhanced MR image (1000/54) with relative CBV color overlay map shows lesion with high initial perfusion (relative CBV, 3.84), more consistent with HGG. E–G, MR images at 6-month follow-up. E, MR image corresponding to A shows increase in contrast enhancement and progression of disease. F, MR image corresponding to B and, G, FLAIR MR image (9000/110/2500) show increased tumor volume and mass effect behaving more like HGG than true LGG.
Figure 3:

Pathologically proved left temporal AA in 65-year-old woman. A, Transverse T1-weighted contrast-enhanced MR image (600/14) shows enhancing lesion (arrow) in left temporal region, consistent with HGG. Transverse, B, FLAIR MR image (9000/110/2500) and, C, T2-weighted MR image (3400/119) show lesion with abnormal T2 signal intensity involving left temporal lobe. D, Transverse gradient-echo (1000/54) dynamic susceptibility-weighted contrast-enhanced MR image with relative CBV color overlay map shows lesion with low perfusion (relative CBV, 1.2) on initial image. E–H, MR images at 9-month follow-up. E, MR image corresponding to A shows dominant enhancing component to be slightly smaller. Disease remains stable, suggesting true low-grade lesion without malignant transformation or components. F, FLAIR MR image corresponding to B and, G, MR image corresponding to C show that signal intensity abnormality within left temporal lobe has slightly decreased in size. Stable-appearing lesion is in concordance with low relative CBV at presentation. H, MR image corresponding to D shows lesion with stable perfusion (relative CBV, 1.1).
Figure 4:

Kaplan-Meier survival curves for progression-free survival for different histologic tumor types show time to progression to be concordant with histologic tumor type. LGO has longest time to progression, followed by LGA, LGOA, AOA, AA, and GBM.
The binary representation of relative CBV was significantly associated with time to progression among all patients (P < .001 without adjustment for pathologic status; P = .0002 with adjustment), among those patients with AA, GBM, or LGA (P < .001 without adjustment; P = .0033 with adjustment), and among those patients with LGO, LGOA, or AOA (P = .020 both with and without adjustment); high relative CBV values were associated with a shorter time to progression in each group.
Age, Sex, and Relative CBV Associations with an Adverse Event with Binary Logistic Regression
P values from binary logistic regression indicated that age (P = .001) and relative CBV (P < .001) were significant predictors of disease progression and death, whereas sex was not (P = .971). The observed percentage of patients who exhibited disease progression, stratified according to age (classified as older than or younger than the median age of 43 years) and relative CBV (Table 3), shows that disease progression is associated with both relative CBV and age. Sex was not considered because it was not observed to be associated with disease progression.
Table 3.
Observed Percentage of Patients Exhibiting Disease Progression Stratified according to Age and Relative CBV
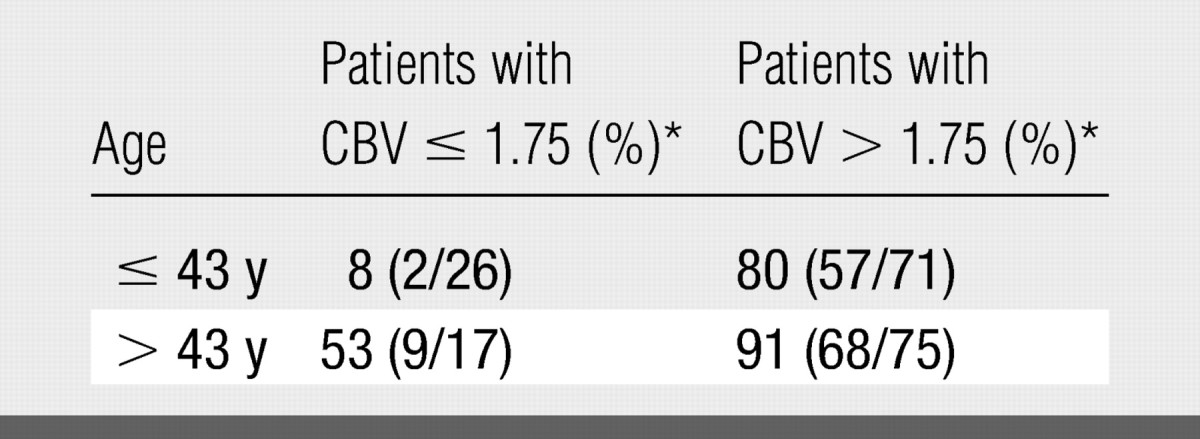
Note.—Sex was not considered because it was not observed to be associated with progression of disease.
Numbers in parentheses were used to calculate the percentages.
DISCUSSION
Theoretically, the extent of resection and the dose and extent of radiation should be determined according to the pathologic tumor grade of the glioma, in addition to prognostic factors such as age, Karnofsky scores, et cetera. Unfortunately, an innate and perhaps unavoidable limitation of the current tumor grading approaches lies in the vagueness of the descriptions used to define each grade. Our study findings indicate that the relative CBV measurement can be used to predict time to progression, clinical outcome, and glioma biology so that, with further optimization and improvements to automate postprocessing and quantitation techniques, the relative CBV measurement may provide an important imaging biomarker of glioma malignancy that may affect therapeutic choices and patient outcome.
In our study, patients with complete response and stable disease had a lower relative CBV than did patients with progressive disease and death. This suggests that the baseline relative CBV value can be used to predict whether a patient is likely to have a poor prognosis. This finding is supported by our finding that Kaplan-Meier estimates of median time to progression indicated that patients with a relative CBV of less than 1.75 had a median time to progression of 3585 days, whereas patients with a relative CBV of more than 1.75 had a time to progression of 265 days irrespective of histopathologic tumor type. When we reviewed both HGGs and LGGs, we found that relative CBV measurements can further aid in the classification of the time to progression. This observation has preoperative implications for the neurosurgeon in that a glioma with the imaging features of an LGG but with a higher relative CBV should perhaps be excised more aggressively, as more extensive resection has been shown to improve survival in glioma patients (29,30). Similarly, after a stereotactic biopsy, subtotal resection, or even gross total resection, an HGG or LGG with a high relative CBV may be treated more aggressively with postoperative radiation therapy and chemotherapeutic regimens.
Researchers in a number of studies have demonstrated the utility of relative CBV in the prediction of patient outcome. In a study of 73 patients with glioma, Schmainda et al (31) were able to correctly classify 96% of HGGs but only 69% of LGGs by using dynamic contrast-enhanced MR imaging. Similarly, Law et al (21) found that relative CBV can help to identify LGGs (with high relative CBV) that will progress more rapidly than will LGGs with low relative CBV and that this subset of LGGs has a propensity for malignant transformation. In view of the findings in these studies, it seems highly likely that if the clinical end point rather than histologic type is considered as the reference standard for tumor grading, relative CBV measurements would demonstrate much greater specificity in the prediction of tumor biology than histologic type alone. That is, tumors that were classified as LGG histologically but as HGG by using dynamic susceptibility-weighted contrast-enhanced MR imaging were likely to be HGG at the time of the study or had undergone malignant transformation after the histologic assessment was performed. This not only has implications at the time of surgery but, as Cao et al (32) showed recently, early temporal changes during radiation therapy in heterogeneous regions of high and low perfusion in gliomas might be used to predict different physiologic responses to radiation therapy. This observation also may provide the opportunity to identify tumor subvolumes that are radioresistant and might benefit from intensity-modulated radiation therapy or dose painting.
A potential limitation in our study was the possible effect of different treatment protocols on the time to progression for HGGs and LGGs. We were not able to control for the effects of radiation dose and extent of radiation or a combination of radiation therapy and chemotherapy. Chemotherapy consisted of temozolomide (Temodar; Schering, Kenilworth, NJ), carboplatin (Paraplatin; Bristol-Myers Squibb, New York, NY), procarbazine hydrochloride (Mutulane; Hoffmann-La Roche, Nutley, NJ), irinotecan (Camptosar; Pfizer, New York, NY), or a combination thereof. Currently, there are also no clear data that indicate that any particular treatment regimen produces radically better outcomes than any other, so that even though we have not controlled for it in this study, differences in the treatment protocol should not result in significant differences in patient outcome. It is well known that some lesions respond to certain therapies, whereas other lesions respond to different therapies and still other lesions respond to no therapy at all, even though they are classified as the same grade of tumor (31).
A second potential limitation was the possible subjectivity and reproducibility of a region-of-interest–based technique of relative CBV measurements. Although Wetzel et al (28) have shown acceptable reproducibility with this method, we and others have explored more objective and semiautomated methods, such as histogram analysis, to further improve the inter- and intraobserver reproducibility of relative CBV measurements. A further confounding factor is the inclusion of gliomas with oligodendroglial components in the analysis. Researchers (15) have well described that oligodendrogliomas generally have increased relative CBV, and our observations also confirm this finding; 50% of LGOs had a relative CBV of more than 1.75 and 36% of LGAs had a relative CBV of more than 1.75. We also analyzed gliomas with and without oligodendroglial components and found that gliomas with oligodendroglial components (LGO, LGOA, AOA) and a high relative CBV of more than 1.75 had a longer time to progression than did gliomas without oligodendroglial components (LGA, AA, GBM) irrespective of tumor grade.
Finally, the definition of progression used in our study was based partly on the use of imaging criteria. With the assumption that some patients underwent radiation therapy, the occurrence of radiation necrosis, misinterpreted as disease progression, may have biased the results. Fortunately, at review of our results, the number of patients that may have biased the results is small, as most patients with progression shown at imaging also had clinical progression.
Current methods for determination of glioma grade, such as the World Health Organization classification, have considerable limitations. A comparison of the reproducibility of the World Health Organization classification versus an automated method for relative CBV measurement, as well as the use of these two methods for the prediction of outcome and survival in patients with gliomas, is under way at our institution. It is likely that improvements in the current World Health Organization classification and incorporation of molecular markers, as well as imaging biomarkers of outcome, in combination will provide the optimal means of predicting glioma biology and, in turn, of determining direct therapy in the future. This is likely to influence the extent of neurosurgical resection, as well as the role of postoperative radiation therapy and chemotherapy, adding relative CBV to current known prognostic factors: age, histologic tumor type, Karnofsky score, and extent of resection (22).
ADVANCE IN KNOWLEDGE
-
•.
Relative cerebral blood volume (CBV) measurements performed by using perfusion MR imaging can be used to predict glioma grade, patient outcome, and time to progression, independent of pathologic findings.
IMPLICATION FOR PATIENT CARE
-
•.
The relative CBV measurement performed by using perfusion MR imaging shows potential for use as a prognostic marker for patients with gliomas.
Our study findings indicate that the relative cerebral blood volume (CBV) measurement can be used to predict time to progression, clinical outcome, and glioma biology so that, with further optimization and improvements to automate postprocessing and quantitation techniques, the relative CBV measurement may provide an important imaging biomarker of glioma malignancy that may affect therapeutic choices and patient outcome.
Footnotes
Author contributions: Guarantors of integrity of entire study, M.L., J.S.B., N.P., M.L.G., D.C.M., J.G.G.; study concepts/study design or data acquisition or data analysis/interpretation, all authors; manuscript drafting or manuscript revision for important intellectual content, all authors; manuscript final version approval, all authors; literature research, M.L., S.C., D.Z., G.J.; clinical studies, M.L., R.J.Y., S.C., M.L.G., J.G.G., D.Z. G.J.; statistical analysis, J.S.B.; and manuscript editing, M.L., R.J.Y., S.C., J.G.G., D.Z., G.J.
Authors stated no financial relationship to disclose.
References
- 1.Burger PC, Vogel FS, Green SB, Strike TA. Glioblastoma multiforme and anaplastic astrocytoma: pathologic criteria and prognostic implications. Cancer 1985;56:1106–1111. [DOI] [PubMed] [Google Scholar]
- 2.Ringertz N Grading of gliomas. Acta Pathol Microbiol Scand 1950;27:51–64. [PubMed] [Google Scholar]
- 3.Kleihues P, Cavanee P. WHO classification of tumors: pathology and genetic of tumours of the nervous system. Lyon, France: International Agency for Research on Cancer, 2000.
- 4.Kleihues P, Soylemezoglu F, Schauble B, Scheithauer BW, Burger PC. Histopathology, classification, and grading of gliomas. Glia 1995;15:211–221. [DOI] [PubMed] [Google Scholar]
- 5.Daumas-Duport C, Scheithauer B, O'Fallon J, Kelly P. Grading of astrocytomas: a simple and reproducible method. Cancer 1988;62:2152–2165. [DOI] [PubMed] [Google Scholar]
- 6.Jackson RJ, Fuller GN, Abi-Said D, et al. Limitations of stereotactic biopsy in the initial management of gliomas. Neuro Oncol 2001;3:193–200. [DOI] [PMC free article] [PubMed] [Google Scholar]
- 7.Prayson RA, Agamanolis DP, Cohen ML, et al. Interobserver reproducibility among neuropathologists and surgical pathologists in fibrillary astrocytoma grading. J Neurol Sci 2000;175:33–39. [DOI] [PubMed] [Google Scholar]
- 8.Coons SW, Johnson PC, Scheithauer BW, Yates AJ, Pearl DK. Improving diagnostic accuracy and interobserver concordance in the classification and grading of primary gliomas. Cancer 1997;79:1381–1393. [DOI] [PubMed] [Google Scholar]
- 9.Gilles FH, Brown WD, Leviton A, et al. Limitations of the World Health Organization classification of childhood supratentorial astrocytic tumors. Children Brain Tumor Consortium. Cancer 2000;88:1477–1483. [PubMed] [Google Scholar]
- 10.Cairncross JG, Ueki K, Zlatescu MC, et al. Specific genetic predictors of chemotherapeutic response and survival in patients with anaplastic oligodendrogliomas. J Natl Cancer Inst 1998;90:1473–1479. [DOI] [PubMed] [Google Scholar]
- 11.Cha S Update on brain tumor imaging: from anatomy to physiology. AJNR Am J Neuroradiol 2006;27:475–487. [PMC free article] [PubMed] [Google Scholar]
- 12.Cha S Perfusion MR imaging: basic principles and clinical applications. Magn Reson Imaging Clin N Am 2003;11:403–413. [DOI] [PubMed] [Google Scholar]
- 13.Law M, Yang S, Wang H, et al. Glioma grading: sensitivity, specificity, and predictive values of perfusion MR imaging and proton MR spectroscopic imaging compared with conventional MR imaging. AJNR Am J Neuroradiol 2003;24:1989–1998. [PMC free article] [PubMed] [Google Scholar]
- 14.Law M, Yang S, Babb JS, et al. Comparison of cerebral blood volume and vascular permeability from dynamic susceptibility contrast-enhanced perfusion MR imaging with glioma grade. AJNR Am J Neuroradiol 2004;25:746–755. [PMC free article] [PubMed] [Google Scholar]
- 15.Lev MH, Ozsunar Y, Henson JW, et al. Glial tumor grading and outcome prediction using dynamic spin-echo MR susceptibility mapping compared with conventional contrast-enhanced MR: confounding effect of elevated rCBV of oligodendrogliomas. AJNR Am J Neuroradiol 2004;25:214–221. [Published correction appears in AJNR Am J Neuroradiol 2004;25(3):B1.] [PMC free article] [PubMed] [Google Scholar]
- 16.Lev MH, Rosen BR. Clinical applications of intracranial perfusion MR imaging. Neuroimaging Clin N Am 1999;9:309–331. [PubMed] [Google Scholar]
- 17.Shin JH, Lee HK, Kwun BD, et al. Using relative cerebral blood flow and volume to evaluate the histopathologic grade of cerebral gliomas: preliminary results. AJR Am J Roentgenol 2002;179:783–789. [DOI] [PubMed] [Google Scholar]
- 18.Sugahara T, Korogi Y, Shigematsu Y, et al. Value of dynamic susceptibility contrast magnetic resonance imaging in the evaluation of intracranial tumors. Top Magn Reson Imaging 1999;10:114–124. [DOI] [PubMed] [Google Scholar]
- 19.Aronen HJ, Perkio J. Dynamic susceptibility contrast MRI of gliomas. Neuroimaging Clin N Am 2002;12:501–523. [DOI] [PubMed] [Google Scholar]
- 20.Burger PC, Vogel FS. The brain: tumors. In: Burger PC, Vogel FS, eds. Surgical pathology of the central nervous system and its coverings. New York, NY: Wiley, 1982; 223–266.
- 21.Law M, Oh S, Babb JS, et al. Low-grade gliomas: dynamic susceptibility-weighted contrast-enhanced perfusion MR imaging—prediction of patient clinical response. Radiology 2006;238:658–667. [DOI] [PubMed] [Google Scholar]
- 22.Law M, Oh S, Johnson G, et al. Perfusion magnetic resonance imaging predicts patient outcome as an adjunct to histopathology: a second reference standard in the surgical and nonsurgical treatment of low-grade gliomas. Neurosurgery 2006;58: 1099–1107. [DOI] [PubMed] [Google Scholar]
- 23.Ball WS Jr, Holland SK. Perfusion imaging in the pediatric patient. Magn Reson Imaging Clin N Am 2001;9:207–230, ix. [PubMed] [Google Scholar]
- 24.Jaffe CC Measures of response: RECIST, WHO, and new alternatives. J Clin Oncol 2006;24:3245–3251. [DOI] [PubMed] [Google Scholar]
- 25.Levin VA, Hess KR, Choucair A, et al. Phase III randomized study of postradiotherapy chemotherapy with combination alpha-difluoromethylornithine-PCV versus PCV for anaplastic gliomas. Clin Cancer Res 2003;9:981–990. [PubMed] [Google Scholar]
- 26.Rosen BR, Belliveau JW, Buchbinder BR, et al. Contrast agents and cerebral hemodynamics. Magn Reson Med 1991;19:285–292. [DOI] [PubMed] [Google Scholar]
- 27.Rosen BR, Belliveau JW, Vevea JM, Brady TJ. Perfusion imaging with NMR contrast agents. Magn Reson Med 1990;14:249–265. [DOI] [PubMed] [Google Scholar]
- 28.Wetzel SG, Cha S, Johnson G, et al. Relative cerebral blood volume measurements in intracranial mass lesions: interobserver and intraobserver reproducibility study. Radiology 2002;224:797–803. [DOI] [PubMed] [Google Scholar]
- 29.Shaw EG, Tatter SB, Lesser GJ, Ellis TL, Stanton CA, Stieber VW. Current controversies in the radiotherapeutic management of adult low-grade glioma. Semin Oncol 2004;31:653–658. [DOI] [PubMed] [Google Scholar]
- 30.Shaw EG, Wisoff JH. Prospective clinical trials of intracranial low-grade glioma in adults and children. Neuro Oncol 2003;5:153–160. [DOI] [PMC free article] [PubMed] [Google Scholar]
- 31.Schmainda KM, Rand SD, Joseph AM, et al. Characterization of a first-pass gradient-echo spin-echo method to predict brain tumor grade and angiogenesis. AJNR Am J Neuroradiol 2004;25:1524–1532. [PMC free article] [PubMed] [Google Scholar]
- 32.Cao Y, Tsien CI, Nagesh V, et al. Survival prediction in high-grade gliomas by MRI perfusion before and during early stage of RT. Int J Radiat Oncol Biol Phys 2006;64:876–885. [Published correction appears in Int J Radiat Oncol Biol Phys 2006;65(3):960.] [DOI] [PubMed] [Google Scholar]