

Abstract
Although short-term disuse does not result in measurable muscle atrophy, studies suggest that molecular changes associated with protein degradation may be initiated within days of the onset of a disuse stimulus. We examined the global gene expression patterns in sedentary men (n = 7, mean age ± SD = 22.1 ± 3.7 yr) following 48 h unloading (UL) via unilateral lower limb suspension and 24 h reloading (RL). Biopsy samples of the left vastus lateralis muscle were collected at baseline, 48 h UL, and 24 h RL. Expression changes were measured by microarray and gene clustering; identification of enriched functions and canonical pathways were performed using the Database for Annotation, Visualization and Integrated Discovery (DAVID) and Ingenuity Pathway Analysis (IPA). Four genes were validated with quantitative RT-PCR (qRT-PCR), and protein levels were measured with Western blot. Of the upregulated genes after UL, the most enriched functional group and highest ranked canonical pathway were related to protein ubiquitination. The oxidative stress response pathway was the second highest ranked canonical pathway. Of the downregulated genes, functions related to mitochondrial metabolism were the most highly enriched. In general, gene expression patterns following UL persisted following RL. qRT-PCR confirmed increases in mRNA for ubiquitin proteasome pathway-related E3 ligase Atrogin1 (but not accompanying increases in protein products) and stress response gene heme oxygenase-1 (HMOX, which showed a trend toward increases in protein products at 48 h UL) as well as extracellular matrix (ECM) component COL4A3. The gene expression patterns were not reversed on RL, suggesting that molecular responses to short-term periods of skeletal muscle inactivity may persist after activity resumes.
Keywords: disuse, atrophy, profiling, heme oxygenase
disuse muscle atrophy occurs in response to immobilization (IM) (26, 52), unloading (UL) (1, 5), bed rest (15, 39), spaceflight (1), and spinal cord injury (SCI) (51). Studies in humans have documented the effects of disuse on skeletal muscle structure and function such as decreases in muscle size and strength as well as increases in rate of muscle fatigue (4). The underlying mechanisms regulating these changes are not well understood, although investigations in IM, UL, and denervation (7–8, 33) in animals have shown that there are coordinated alterations in expression of genes encoding for proteins that may function in the initiation of the muscle atrophy process. Differential gene expression has been detected for molecules related to protein degradation and synthesis (7–8), extracellular matrix (ECM) remodeling (2), oxidative stress response (reviewed in 43), and metabolism (33). Also, it has been proposed that key regulators of muscle atrophy are likely those most sensitive to the disuse stimulus (5).
Recently, studies have been undertaken in humans to investigate the gene expression changes in skeletal muscle associated with disuse (11, 26, 52). As with the animal models, these studies have shown alterations in expression of components of the ubiquitin proteasome pathway (UPP) such as Fbox-only protein 32 (FBXO32, also called Atrogin1) and muscle specific ring finger 1 (MuRF1), ECM components such as collagen, and metabolic enzymes such as NADH dehydrogenase and pyruvate dehydrogenase. With the exception of one study from our laboratory (52) that measured gene expression following 48 h of knee IM, these investigations have measured time points from 5 days to 3 wk of IM (11, 26). However, measurable proteolysis has been detected as early as 72 h postunloading in humans (50), and therefore, molecular atrophy triggers (such as alterations in the transcription of key genes) likely occur before that time point in humans. A small group of genes in the UPP following reloading have also been studied within the context of an exercise program following a longer period of disuse via casting (26). While transcription of Atrogin1 and MuRF1 was upregulated following 2 wk of disuse, these changes were reversed 24 h following cast removal.
This study examined the global gene expression patterns following short-term unloading (48 h UL) and reloading (24 h RL) in human skeletal muscle using a unilateral lower limb suspension (ULLS) model that prevents weight bearing while still allowing the knee joint to move. We hypothesized that 48 h UL would result in increases in expression of UPP-associated genes as well as decreases in expression of ECM components and that 24 h RL would reverse these changes. Microarray technology and high-throughput array analysis [Genespring; Database for Annotation, Visualization and Integrated Discovery (DAVID); and Ingenuity Pathway Analysis] provided us with the tools to analyze the global expression patterns of thousands of genes within each tissue sample and thus allowed us to undertake the exploratory aim of investigating the multifaceted regulation of biological processes associated with unloading and reloading. Although the nature of these high-throughput analyses was more exploratory and computational than statistical, the enrichment algorithms, annotations databases, and knowledge bases at the heart of these software packages provided powerful data-mining tools. By learning more about the molecular events accompanying the earliest stages of disuse and reambulation, we sought to uncover information that may aid in future efforts to prevent or attenuate disuse atrophy and facilitate recovery.
MATERIALS AND METHODS
Subjects.
Seven sedentary men (n = 7, mean age ± SD = 22.1 ± 3.7 yr, mean height ± SD = 1.8 ± 0.1 m, mean weight ± SD = 78.2 ± 3.1 kg) were recruited from the University of Massachusetts community. Those with bleeding problems, known allergies to lidocaine, orthopedic problems, or use of medications that could increase bleeding (such as aspirin) were excluded from the study, as were individuals who are taking muscle-building supplements or restricting caloric intake. All subjects signed an informed consent form and completed a medical history questionnaire and physical activity questionnaire before being enrolled in the study to ensure they met the inclusion/exclusion criteria. These documents and the study protocol were approved by the University of Massachusetts and Hartford Hospital institutional review boards. In addition, each potential subject was carefully screened to ensure that he was aware of the inconvenience inherent in the UL protocol, understood the potential discomfort from the biopsy procedure, and felt confident that he could comply with all study requirements.
Unloading and reloading protocol.
Lower limb UL was achieved using the ULLS model, which required that subjects wear a shoe with a 10-cm sole (Kintec Footlabs, Surrey, BC) on the right foot. The left foot did not have contact with the ground. Therefore, the left lower limb was unloaded for the duration of the 48-h UL protocol. All ambulatory activity was performed on crutches with only the right foot having contact with the ground. Although the UL leg was free to move, no load was placed on it, and any physical activity requiring use of the left quadriceps muscles was restricted. Berg et al. (4) and others have used this ULLS model up to 6 wk. Compliance during the UL phase of the present study was confirmed through the use of activity monitors (model no. 7164, Computer Science and Applications, Shalimar, FL) that were worn on both ankles, and showed a 29–35% reduction in acceleration in the UL leg compared with the loaded leg. Following 48 h UL, subjects were instructed to ambulate normally for 24 h, constituting the RL condition.
Biopsies.
Three biopsies were taken from the left vastus lateralis from each subject over the course of the study. A baseline biopsy was taken 2 wk before UL. Biopsies were also taken immediately following 48 h UL and 24 h RL. Each subsequent incision was taken ∼2 cm proximal to the previous one to avoid effects from the prior biopsies. All biopsy procedures were conducted at Hartford Hospital and were taken at the same time of day to reduce circadian influences. Subjects were fed a standardized meal 3 h before each biopsy because meal patterns alter the activity of certain genes related to muscle atrophy and hypertrophy.
Percutaneous needle muscle biopsies were obtained using a Bergstrom 5-mm biopsy needle (Depuy, Warsaw, IN) in a sterile field. First, skin was lightly anesthetized with 2% lidocaine hydrochloride solution. Next, a small (5–6 mm) incision was made through the skin and muscle fascia, and the biopsy needle was inserted. Up to 150 mg of tissue was removed and divided into three aliquots (up to 50 mg each). Biopsy samples were immediately snap-frozen in liquid nitrogen on excision. All samples were stored at −80°C until analysis. After each biopsy, subjects were escorted home and contacted every 12 h for the next 3 days to ensure the biopsy site was healing properly.
Expression profiling.
Affymetrix Human Genome U133 Plus 2.0 microarrays for analysis of over 47,000 transcripts were used for this study. The procedures including total RNA isolation, cDNA synthesis, cRNA labeling, microarray hybridization, and image acquiring were done as described in our previous publications (12, 50a). Briefly, total RNA was isolated with TRIzol reagent and purified with RNeasy MinElute Cleanup Kit (Qiagen, Valencia, CA). Three micrograms of total RNA from each sample was converted into double-stranded cDNA, then cRNA using one-cycle target labeling and control reagents and protocol (Affymetrix, Santa Clara, CA). After purification using GeneChip Sample Cleanup Module (Affymetrix), biotin-labeled cRNA was then fragmented randomly before hybridizing to the microarrays. Each array was washed and stained on the Affymetrix Fluidics Station 450, and then probe arrays were scanned via the GeneChip Scanner 3000. The quality control criteria developed at Children's National Medical Center Microarray Center for each array were followed (12, 50a).
Absolute analysis of Affymetrix “raw” data was conducted using Affymetrix MAS5.0 and DNA-Chip Analyzer software (dCHIP) (34). The data were then imported into the GeneSpring 7.0 (Silicon Genetics, Redwood City, CA) for data filtering and statistical analysis. First, genes with two “present calls” (∼10% of the total arrays) were selected for statistical analysis. Probe sets showing significant (P < 0.05) expression changes (using Welch's t-test) in both MAS5.0 and dCHIP were retained for hierarchical clustering, functional, and pathway analysis. The microarray dataset is available at http://www.ncbi.nlm.nih.gov/projects/geo (accession no. GSE21496).
Functional and pathway analysis of expression profiles.
To investigate molecular functions associated with gene lists in this study, we used the Database for Annotation, Visualization and Integrated Discovery (DAVID) (17), a web-accessible gene database provided by the National Institutes of Health (http://david.abcc.ncifcrf.gov). DAVID (along with its standalone desktop counterpart, EASE) is currently the most oft-cited publically available gene functional enrichment analysis tool in the scientific literature (18) and is used to systematically link microarray findings to biological function. DAVID maps large gene lists against associated biological annotations (e.g., GO annotation and keywords) and provides enrichment algorithms that statistically emphasize the most overrepresented annotations associated with a given dataset (23). In the present study, Affymetrix probe-set IDs were uploaded into the DAVID online interface, and the annotation tool was used to sort the associated transcripts into functional categories. Benjamini and Hochberg false discovery rates (5% false positive discovery rate) were used to correct for multiple testing. In DAVID, the magnitude of enrichment is represented as a fold change such that the percentage of altered genes in the uploaded dataset belonging to a particular functional group is expressed as a ratio of the percentage of genes belonging to that functional group in the entire human genome. In the present study, functional groups passed filtering if they not only reached statistical significance after multiple testing correction (P < 0.05) but also reached an enrichment level ≥ 1.5-fold as directed by Huang et al. (23). Enrichment values ≥ 1.5 are generally considered biologically relevant.
First, gene lists for each condition (48 h UL and 24 h RL normalized to baseline) were analyzed using DAVID. Next, to visualize and further compare the microarray data for the two conditions, and to manage the large number of transcripts differentially expressed on the genechip, hierarchical clustering was performed and a two-dimensional cluster map was constructed using Genespring 7.0 (Silicon Genetics, Redwood City, CA). These cluster gene lists were uploaded into DAVID, and functional groups for each cluster were identified.
Ingenuity Pathway Analysis (IPA, Ingenuity Systems, Redwood, CA) was used to further investigate the Genespring expression clusters. IPA is a proprietary online software tool that aids researchers in modeling and analyzing the biological significance of microarray datasets. While DAVID maps datasets against functional annotations, IPA can take data analysis a step further by using the Ingenuity Knowledge Base to identify statistically significant canonical pathways. The Knowledge Base consists of millions of relationships (between genes, proteins, small molecules, and complexes) manually extracted from PhD-level scientists from over 200,000 peer-reviewed articles (10). Furthermore, close to 3,000 articles in the biological literature have cited this analysis tool (http://www.ingenuity.com/library/pdf/bibliography.pdf). Cluster gene lists identified by DAVID as containing significant functional groups were uploaded into IPA, which identified canonical pathways associated with each cluster. The significance of the association between the genes in each dataset and the canonical pathway was determined by using Fischer's exact test to calculate a P value determining the probability that the association between the genes in the dataset and the canonical pathway was explained by chance alone. Pathways were then ranked according to P value. Once key pathways were identified, the analysis was expanded to overlay differential gene expression from the entire dataset in these pathways.
RNA isolation and cDNA synthesis.
Total RNA was isolated using TRIZOL reagent (following manufacturer's instructions) and quantified via spectrophotometry (Nanodrop, Wilmington, DE). Equal amounts of total RNA was synthesized into cDNA using a first-strand cDNA Synthesis kit (Fermentas, Hanover, MD). ABgene Absolute qPCR SYBR Green Master Mix (ABgene, Surrey, UK) with ROX dye was used for all PCR protocols. Forward and reverse primers (Integrated DNA Technologies, Coralville, IA) were designed using NCBI gene sequences with IDT DNA SciTools for all genes of interest (Table 1).
Table 1.
PCR primers
| Gene Symbol | GenBank Accession | Forward Primer | Reverse Primer |
|---|---|---|---|
| Atrogin1 | NM_148177.1 | 5′-TCA CAG CTC ACA TCC CTG AG-3′ | 5′-AGA CTT GCC GAC TCT TTG GA-3′ |
| COL4A3 | NM_000091.4 | 5′-GTT CTC TGT GGC AAA GCA GCA ACT-3′ | 5′-ACA ATC ACC GTA GTG ACA GTG CCT-3′ |
| HMOX1 | NM_002133.2 | 5′-ATT GCC AGT GCC ACC AAG TTC AAG-3′ | 5′-ACG CAG TCT TGG CCT CTT CTA TCA-3′ |
| MuRF1 | NM_032588.2 | 5′-TGA GCC AGA AGT TTG ACA CG-3′ | 5′-TGA TGA GTT GCT TGG CAG TC-3′ |
| GAPDH | NM_002046.3 | 5′-CAT TGC CCT CAA CGA CCA CTT TGT-3′ | 5′-TCT CTC TCT TCC TCT TGT GCT CTT GC-3′ |
Gene expression analysis via qRT-PCR.
Reactions were run in 96-well plates with all cDNA samples from each treatment condition run in triplicate for each gene of interest and the reference standard [glyceraldehyde 3-phosphate dehydrogenase (GAPDH)]. The average Ct (comparative threshold) value for triplicate samples was used for data analysis. Ct values were directly related to fluorescence of the respective SYBR-green probe after 40 cycles of amplification on an MX3000p Real-Time PCR System (Stratagene, La Jolla, CA) available in the central Bioinformatics and Genomics Facility at the University of Massachusetts. Differential gene expression was calculated using the 2−ΔΔCT method as described by Livak and Schmittgen (35) and presented as fold change relative to baseline values. At the end of each reaction, a melting curve analysis was run to identify possible primer dimers. The results of the melting curve analysis were confirmed, and appropriate product size was determined via 2% agarose gel electrophoresis with ethidium bromide staining.
Protein quantification.
Protein was isolated using TRIZOL reagent (Invitrogen, Carlsbad, CA) and quantitated through measurement on a FLUostar plate reader (BMG Lab Technologies, Chapel Hill, NC) using NanoOrange reagent (Invitrogen). Target proteins were then quantified via Western blot analysis. Densitometry calculations of protein bands were used to compare changes in the relative amount of protein product between the 48 h UL condition and baseline. Fifteen micrograms of protein from each sample was loaded into 4–15% gradient sodium dodecyl sulfate (SDS) polyacrylamide gels (Bio-Rad Laboratories, Hercules, CA) and separated by electrophoresis (60–90 min at 100 V). Precision Plus Kaleidoscope Protein Standards (Bio-Rad Laboratories) were used as molecular weight markers for each gel.
Following electrophoresis, proteins were transferred onto a polyvinylidene diflouride membrane (Millipore, Billerica, MA) at 100 V for 3 h. Equal loading and protein transfer were confirmed by staining with Ponceau S as well as incubating with GAPDH antibody. Membranes were cut horizontally (based on the placement of the molecular weight markers) so that the membrane could be probed for both the protein of interest at one position in the lane and GAPDH. (In the case of HMOX1, a molecule of similar molecular weight to GAPDH, the membrane was stripped and reprobed). Each membrane was then blocked for 2 h at room temperature with rocking motion in a solution of PBST containing 5% nonfat dry milk (Carnation, Nestle, Wilkes-Barre, PA) and 0.1% Tween-20. The membrane was then washed (3 × 5 min each in 1× PBST) and incubated in primary antibody (HMOX1 or GAPDH), at the appropriate dilution (HMOX1 1:1,000, Atrogin1 1:500, GAPDH 1:3,500) with rocking motion overnight at 4°C. The membrane was then washed (5 × 10 min each with 1× PBST) and incubated in the appropriate horseradish peroxidase (HRP)-labeled secondary antibody for 1.5 h; 4 × 10 washes in 1× PBST followed. Membranes were then treated for 2 min with enhanced chemiluminescence solution (GE Healthcare, Piscataway, NJ) in clear plastic sheet holders and exposed to Kodak film for the appropriate duration. Antibodies for GAPDH (rabbit polyclonal) and HMOX1 (rabbit monoclonal) were obtained from Abcam (Cambridge, MA), as were anti-rabbit, anti-mouse, and anti-goat secondary antibodies. The antibody against Atrogin1 (goat polyclonal) was acquired from Santa Cruz Biotechnology (Santa Cruz, CA).
Bands from each blot were scanned from the respective film using a Fotodyne Transilluminator (Hartland, WI) and quantified via densitometry using ImageJ freeware (National Institutes of Health, Bethesda, MD). To quantify protein products for each time point, densitometer values for protein bands in each condition were normalized to the densitometer value of the GAPDH protein band from the same sample. Although this is an arbitrary value (au), the calculated ratio identifies differences in protein product.
RESULTS
There were 1,811 genes that were differentially expressed at 48 h UL and/or 24 h RL compared with baseline (48 h UL = 635, 24 h RL = 1,287). Although the changes in gene expression for the subclinical intervention in this study were modest compared with those found with pathophysiological muscular conditions (12) or longer disuse perturbations (40) to muscle, the majority of the P values for these transcripts were P < 0.005.
Functional groups.
Functional groups of interest for 48 h UL included chelation, stress response, mRNA processing, ubiquitin conjugation, and acetylation., Groups following 24 h RL also included ubiquitin conjugation, and acetylation, as well as mRNA processing, mitochondrion, transit peptide, repressor, and activator.
The Genespring clustering analysis revealed eight expression clusters; however, only two clusters contained functional groups that reached significance (P < 0.05) via DAVID analysis. Functional groups in cluster 1 (n = 579, Table 2) were enriched 180–330% in this dataset. Ubiquitin conjugation has consistently been identified as an important component of disuse atrophy (7), and this functional group was overrepresented in cluster 1 (Table 3). This functional group contained E2 conjugating enzymes, E3 ligases, ubiquitin-specific proteases, and other proteolytic mediators, suggesting an increase in the activity of the UPP (Fig. 1). A number of these genes were upregulated following both 48 h UL and 24 h RL; furthermore, the number of significantly upregulated transcripts nearly doubled following 24 h RL compared with 48 h UL.
Table 2.
Functional annotations for clusters 1 and 7
| Functional Annotation | Count | Fold Enrichment | Adjusted P Value |
|---|---|---|---|
| Cluster 1 | |||
| Ubiquitin conjugation | 23 | 3.3 | 0.0000 |
| Posttranslational modification | 64 | 1.8 | 0.0003 |
| mRNA metabolism | 21 | 3.1 | 0.0067 |
| Cluster 7 | |||
| Mitochondrion | 56 | 5.3 | 0.0000 |
| Catalytic activity | 87 | 1.5 | 0.0120 |
| Generation of precursor metabolites and energy | 21 | 3.1 | 0.0390 |
Count refers to no. of genes in category; fold enrichment is magnitude of overrepresentation in data set; adjusted P value is Benjamini and Hochberg multiple testing correction. Functional annotations are listed in order of P value.
Table 3.
Cluster 1 upregulated genes associated with ubiquitin conjugation
| Affymetrix Accession | Gene Symbol | Gene Title | 48 h UL | 24 h RL | ANOVA P Value |
|---|---|---|---|---|---|
| 213295_at | CYLD | Cylindromatosis (turban tumor syndrome) | 1.3 | 1.3 | 0.00905 |
| 209943_at | FBXL4b | F-box and leucine-rich repeat protein 4 | 1.4 | 1.3 | 0.00880 |
| 225345_s_at | FBXO32b | F-box protein 32 (Atrogin1) | 1.7 | 1.6 | 0.00001 |
| 203068_at | KLHL21 | Kelch-like 21 (Drosophila) | 1.3 | 1.5 | 0.00077 |
| 242712_x_at | RANBP2 | RAN binding protein 2 | 1.2 | 1.4 | 0.00839 |
| 228980_at | RFFLb | Rififylin (ring finger) | NS | 1.5 | 0.00596 |
| 230599_at | RNF19b | Ring finger protein 19 (dorfin) | 1.1 | 1.3 | 0.00136 |
| 205596_s_at | SMURF2b | SMAD specific E3 ubiquitin protein ligase 2 | NS | 1.3 | 0.01120 |
| 209142_s_at | UBE2D2a | Ubiquitin-conjugating enzyme E2D 1 | NS | 1.6 | 0.01100 |
| 224747_at | UBE2E2a | Ubiquitin-conjugating enzyme E2E 1 | NS | 1.3 | 0.00260 |
| 236107_at | UBE2G1a | Ubiquitin-conjugating enzyme E2G 1 | 1.2 | 1.2 | 0.00222 |
| 221654_s_at | USP3c | Ubiquitin specific peptidase 3 | 1.2 | 1.3 | 0.00465 |
| 226505_x_at | USP32c | Ubiquitin specific peptidase 32 | 1.2 | 1.3 | 0.00192 |
| 233595_at | USP34c | Ubiquitin specific peptidase 34 | NS | 1.3 | 0.00022 |
| 208648_at | VCP | Valosin-containing protein | NS | 1.3 | 0.00032 |
Unloading (UL) and reloading (RL) values are expression relative to baseline;
E2 ligase;
E3 ligase;
ubiquitin protease. P < 0.05. NS, not significant.
Fig. 1.
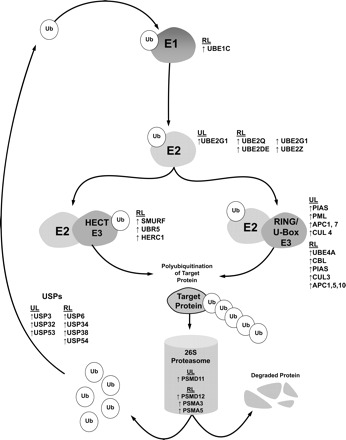
Differential gene expression in the ubiquitin proteasome pathway. This drawing illustrates the transcripts differentially expressed (relative to baseline) at 48 h unloading (UL) and 24 h reloading (RL). Gene symbols are listed in proximity to the pathway component to which they belong and are grouped by condition (i.e.., RL and UL). ↑, gene expression upregulation; ↓, gene expression downregulation; APC, anaphase-promoting complex; CBL, Cas-Br-M ecotropic retroviral transforming sequence (E3 protein ligase CBL); CUL, cullen; HERC1, HECT domain and RCC1-like domain containing protein (probable E3 protein ligase HERC1); PIAS, protein inhibitor of activated STAT; PML, promylocytic leukemia; PSMD, proteasome (prosome, macropain) 26S subunit, non ATPase; PSMA, proteasome (prosome, macropain) 26S subunit, alpha type; SMURF, SMAD specific ubiquitin protein ligase; Ub, ubiquitin; UBE1, ubiquitin activating enzyme E1; UBE2, ubiquitin conjugating enzyme E2; UBE4, ubiquitin factor E4; UBR, ubiquitin protein ligase E3 component recognin; USP, ubiquitin specific peptidase.
Genes in cluster 7 (n = 241) were downregulated, and functional groups were overrepresented in the dataset 150–530% (Table 2). Disuse has been shown to lead to decreases in mitochondrial activity (11), this functional group was overrepresented in cluster 7 (Table 4), and these genes included those involved in mitochondrial metabolism. While the majority of upregulated ubiquitin conjugation genes in cluster 1 were upregulated both at 48 h UL and 24 h RL, only 5 of the 29 downregulated mitochondrial genes were significantly altered at 48 h UL. The remaining genes in the functional group were not significantly altered until the subsequent 24 h RL.
Table 4.
Cluster 7 downregulated genes associated with mitochondrial function
| Affymetrix Accession | Gene Symbol | Gene Title | 48 h UL | 24 h RL | ANOVA P Value |
|---|---|---|---|---|---|
| Cell growth, regeneration, and apoptosis | |||||
| 204824_at | ENDOG | Endonuclease G | NS | −1.2 | 0.00256 |
| 224509_s_at | RTN4IP1 | Reticulon 4 interacting protein 1 (aka NIMP) | −1.3 | −1.4 | 0.00403 |
| 211662_s_at | VDAC2 | Voltage-dependent anion channel 2 | NS | −1.2 | 0.00069 |
| Electron transport, oxidative phosphorylation, and redox | |||||
| 213379_at | COQ2 | Coenzyme Q2 homolog, prenyltransferase (yeast) | NS | −1.2 | 0.01050 |
| 223515_s_at | COQ3 | Coenzyme Q3 homolog, methyltransferase (S. cerevisiae) | −1.3 | −1.4 | 0.00256 |
| 225747_at | COQ10A | Coenzyme Q10 homolog A (S. cerevisiae) | NS | −1.4 | 0.00178 |
| 203858_s_at | COX10 | COX10 homolog, cytochrome c oxidase assembly protein | NS | −1.2 | 0.00554 |
| 202447_at | DECR1 | 2,4-Dienoyl CoA reductase 1, mitochondrial | NS | −1.2 | 0.00221 |
| 239161_at | FDX1 | Ferredoxin 1 | NS | −1.4 | 0.00449 |
| 204041_at | MAOB | Monoamine oxidase B | −1.2 | −1.4 | 0.00318 |
| 203745_at | HCCS | Holocytochrome c synthase (cytochrome c heme-lyase) | −1.2 | −1.3 | 0.00320 |
| 209303_at | NDUFS4 | NADH dehydrogenase (ubiquinone) Fe-S protein 4 | −1.2 | −1.2 | 0.00501 |
| 218160_at | NDUFA8 | NADH dehydrogenase (ubiquinone) 1 alpha subcomplex, 8 | NS | −1.3 | 0.00134 |
| 208969_at | NDUFA9 | NADH dehydrogenase (ubiquinone) 1 alpha subcomplex, 9 | NS | −1.2 | 0.01380 |
| 219195_at | PPARGC1A | Peroxisome proliferative activated receptor, gamma, coactivator 1 alpha | NS | −1.4 | 0.00792 |
| Mitochondrial morphology | |||||
| 226154_at | DNM1L | Dynamin 1-like | NS | −1.2 | 0.01350 |
| 218246_at | MUL1 | Mitochondrial ubiquitin ligase activator of NFKB 1 | NS | −1.2 | 0.00300 |
| Stress response | |||||
| 215792_s_at | DNAJC11 | DnaJ (Hsp40) homolog, subfamily C, member 11 | NS | −1.2 | 0.00840 |
| 225358_at | DNAJC19 | DnaJ (Hsp40) homolog, subfamily C, member 19 | NS | −1.2 | 0.00823 |
| 211538_s_at | HSPA2 | Heat shock 70 kDa protein 2 | NS | −1.2 | 0.00018 |
| Tricarboxylic acid cycle | |||||
| 222572_at | PPM2C | Protein phosphatase 2C, magnesium-dependent, Catalytic subunit | NS | −1.5 | 0.00692 |
| 213149_at | DLAT | Dihydrolipoamide S-acetyltransferase | NS | −1.3 | 0.00897 |
| Transporter activity | |||||
| 203339_at | SLC25A12 | Solute carrier family 25 (mitochondrial carrier, Aralar), member 12 | NS | −1.2 | 0.01110 |
| 227012_at | SLC25A40 | Solute carrier family 25, member 40 | NS | −1.3 | 0.00360 |
| 226059_at | TOMM40L | Translocase of outer mitochondrial membrane 40 homolog (yeast)-like | NS | −1.6 | 0.00261 |
| Miscellaneous and unknown | |||||
| 221069_s_at | CCDC44 | Coiled-coil domain containing 44 | NS | −1.2 | 0.00303 |
| 224415_s_at | HINT2 | Histidine triad nucleotide binding protein 2 | NS | −1.3 | 0.01000 |
| 223154_at | MRPL1 | Mitochondrial ribosomal protein L1 | NS | −1.2 | 0.00005 |
| 56197_at | PLSCR3 | Phospholipid scramblase 3 | NS | −1.2 | 0.00621 |
UL and RL values are expression relative to baseline; P < 0.05.
Canonical pathways.
For cluster 1, 10 canonical pathways reached significance (P < 0.05) via IPA. The top ranking pathway was the protein ubiquitination pathway (P = 0.0007) with the upregulation of 11 participating genes including such genes as ubiquitin specific peptidases (USPs) and proteasome 26S subunit non-ATPase 11 (PSMD11). Hierarchical clustering analysis was first performed to organize groups of probe sets with similar patterns of expression because these transcripts will more likely be related in function (20). Once pathways were identified within these clusters, analysis was expanded to identify all differential expression within these pathways. When the analysis was expanded to include the entire dataset, the number of differentially expressed genes in the pathway increased to 31 (with 7 reaching significance at 48 h UL and 26 reaching significance at 24 h RL). Figure 1 is an illustration showing the molecular interactions of the UPP. Gene names and their differential expression (i.e., up- or downregulation) are listed next to respective molecular categories in the pathway. Transcription of molecules in these pathways was largely upregulated and included ubiquitin-activating enzymes (E1), ubiquitin-conjugating enzymes (E2), ubiquitin ligases (E3), proteasome subunits, and USPs.
The second highest ranked pathway in cluster 1 was the NRF2-mediated oxidative stress response pathway (P = 0.005) with nine participating genes including heme oxygenase-1 (HMOX1), the gene with the most dramatic differential expression in the entire dataset (48 h UL = 15.4-fold, P = 0.002; 24 h RL = 6.5-fold, P = 0.007), as well as heat shock proteins (HSPs). When the analysis was expanded to include the entire dataset, the number of differentially expressed genes in the pathway increased to 28 genes (with 9 reaching significance at 48 h UL and 19 reaching significance at 24 h RL). Figure 2 is an illustration showing the NRF2-mediated antioxidant pathway with upstream regulators of the transcription factor, NRF2, and the downstream detoxifiers, antioxidants, and chaperones. Gene names and their differential expression (i.e., up- or downregulation) are listed next to respective molecular categories in the pathway. Antioxidant proteins were upregulated while chaperones (particularly DNAJ proteins) were downregulated.
Fig. 2.
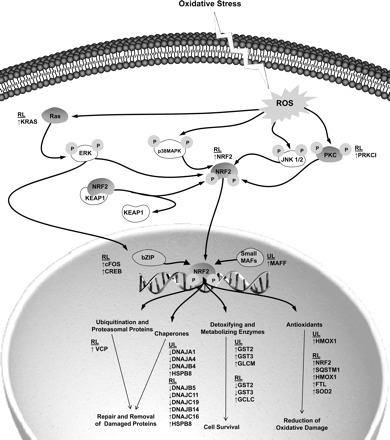
Differential gene expression in the NRF2-mediated oxidative stress response pathway. This drawing illustrates the transcripts differentially expressed (relative to baseline) at 48 h UL and 24 h RL. Gene symbols are listed in proximity to the pathway component to which they belong and are grouped by condition (i.e.., RL and UL). ↑, gene expression upregulation; ↓, gene expression downregulation; bZIP, basic leucine zipper; c-fos, cellular FBJ murine osteosarcoma viral oncogene homolog; CREB, cAMP responsive element binding protein; DNAJ, DnaJ (Hsp40) homolog; ERK, extracellular regulated kinase; FTL, ferritin; GCLC, glutamate-cysteine ligase, catalytic subunit; GST, glutathione S-transferase; HMOX, heme oxygenase; HSP, heat shock protein; JNK, c-Jun NH2-terminal kinase; KEAP, kelch-like ECH-associated protein; KRAS, Kirsten rat sarcoma viral oncogene homolog; MAF, v-maf musculoaponeurotic fibrosarcoma oncogene homolog; MAFF, v-maf musculoaponeurotic fibrosarcoma homolog F; NRF, NF-E2-related factor; p38MAPK, p38 mitogen-activated protein kinases, PKC, protein kinase C; PRKCI, protein kinase C, iota; SOD, superoxide dismutase; SQSTM, sequestosome; VCP, valosin-containing protein; ROS, reactive oxygen species. Created using Pathway Builder (Protein Lounge, San Diego, CA).
For cluster 7, 12 canonical pathways reached significance (P < 0.05). The top three canonical pathways identified in IPA for cluster 7 included the oxidative phosphorylation, ubiquinone biosynthesis, and the citrate cycle pathways. These results were in agreement with the DAVID analysis, which identified mRNA downregulation related to mitochondrial function and especially to electron transport and energy production (Table 4). As with the functional analysis, IPA revealed a greater number of transcripts reaching significance following 24 h RL than following the previous 48 h UL.
Protein synthesis.
It has been proposed that decreased protein synthesis plays an important role in the regulation of disuse muscle atrophy (42, 50). Therefore, the microarray results in this study were screened for key genes related to protein synthesis even though neither protein synthesis functional groups nor canonical pathways reached significance via DAVID or IPA. As a result, it was discovered that protein synthesis mediator, S6 kinase, 70 kDa, polypeptide 1 (S6K1) (19), was upregulated following 24 h RL (1.3-fold; P = 0.029). Other genes associated with S6K1 in muscle growth pathways, such as TORC1 and 4EBP1, were not differentially expressed via microarray.
Gene expression confirmation.
The focus of this experiment was a systems analysis of thousands of genes to reveal global patterns of expression. However, four genes were chosen for analysis via qRT-PCR because they had been previously identified as differentially expressed following other distinct models of disuse [e.g., 48 h immobilization in humans (52) and hindlimb unloading in rodents (7)] and to confirm the gene with the greatest fold change in the present dataset. HMOX1 showed the greatest expression changes via microarray following both 48 h UL and 24 h RL conditions (15.4- and 6.51-fold, respectively). E3 ligase Atrogin1 was previously found to be a key regulator of disuse atrophy and was upregulated via microarray across conditions (UL = 1.4, RL = 1.3). COL4A3, a subunit of collagen-IV (COL4), was also upregulated via microarray (UL = 1.7, RL = 1.3). This was surprising because the downregulation of COL4 has been previously proposed as an early trigger of disuse atrophy (52). Although muscle ring finger-1 (MuRF1) was not shown to be differentially expressed via microarray, it was also chosen for the more sensitive qRT-PCR analysis as it has been identified, along with Atrogin1, as an important atrophy regulator (7). The qRT-PCR experiments verified that mRNA levels for HMOX1, Atrogin1, and COL4 were significantly upregulated following UL (mean ± SE fold change: 12.7 ± 5.25, P = 0.01; 1.4 ± 0.1, P = 0.01; 1.8 ± .2, P < 0.01, respectively) with HMOX1 showing a trend toward remaining upregulated following 24 h RL relative to baseline (mean ± SE fold change: 1.1 ± .2, P = 0.09). Consistent with previous findings in our laboratory following 48 h immobilization (52), there were no significant difference in MuRF1 mRNA levels via pRT-PCR following 48 h UL or 24 h RL.
Protein quantification.
With limited tissue sample available, only two of the genes confirmed via qRT-PCR were chosen for protein quantification: HMOX1 and Atrogin1. Protein was successfully extracted and quantified for four subjects at baseline and 48 h UL. The results of the analysis are presented here. There was a trend toward increased protein products for HMOX1 following 48 h UL (mean ± SE fold change: 2.09 ± 0.51, P = 0.06). Figure 3 presents the individual Western blotting results for each of these four subjects and their corresponding qRT-PCR results. Although both mRNA and protein levels rose for all four subjects following 48 h UL, there appears to be no dose-response relationship between mRNA levels and protein products within subject. There were no significant differences in protein products for Atrogin1 48 h UL relative to baseline (mean ± SE fold change: 1.40 ± 0.70, P = 0.74).
Fig. 3.
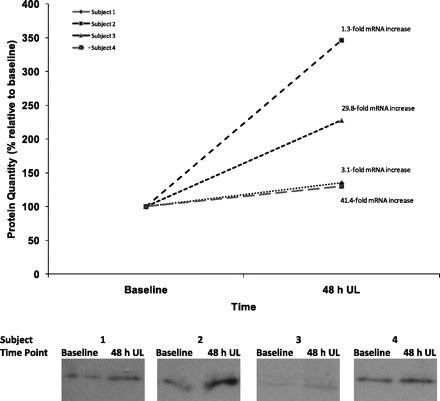
HMOX1 protein and gene expression by individual subject. mRNA levels following 48 h UL listed next to the corresponding protein expression data point. Blots for each subject are depicted below the graph. Lanes were run on the same gel for each subject but were noncontiguous, as indicated by the space imposed between blot images.
DISCUSSION
The major findings in this study are that 1) of the upregulated genes, the most enriched functional group and highest ranked canonical pathway both were related to the UPP, and the oxidative stress response pathway was ranked second to the protein ubiquitination pathway; and 2) contrary to our hypothesis, general patterns showed differential gene expression in the same direction for both the 48 h UL and 24 h RL conditions with greater numbers of significant changes following reloading. qRT-PCR confirmed upregulation of the UPP-related gene Atrogin1 and oxidative stress-related gene HMOX1, while Western blotting showed a trend toward an increase in protein products for HMOX1. Furthermore, COL4 showed an increase in mRNA levels following 48 h UL via microarray, and this was confirmed through qRT-PCR.
The UPP.
Ubiquitination is an important component of the UPP, a pathway by which proteins are tagged for destruction and then degraded by the proteasome. Increases in gene expression related to this pathway have been shown in both animal and human models of skeletal muscle atrophy (7, 26, 52). Furthermore, measurable increases in proteolysis have been shown as early as 72 h post-ULLS (50). Differential UPP gene expression at the very early time point of unloading (48 h) in the present study is consistent with previous work in our laboratory showing changes in expression of genes following 48 h of immobilization (52), a model similar to, yet distinct from, the ULLS model of disuse.
The highest ranked pathway identified via IPA in cluster 1 was the protein ubiquitination pathway with USPs and PSMD11 mRNA increasing. Previous work in our laboratory found PSMD11 (also known as Rpn 6) to be increased at both the mRNA and protein levels following spinal cord injury in humans (51). USPs may play a role in increasing ubiquitin availability during catabolic states (14, 52). Following 24 h reloading, the number of upregulated E2s, E3s, USPs and proteasome subunits increased further, suggesting that there may be a heightened availability of ubiquitin, proteolytic enzymes, and proteolytic machinery for a period following unloading, even after the disuse stimulus is removed. Although PSMD11 was not specifically shown to be increased following UL, another PSMD gene (PSMD12, Rpn 5) was increased following RL.
E3 ligases.
Transcription of E3 ligases and the translation of their encoding mRNAs are believed to be an important means by which proteolysis of skeletal muscle is regulated (7–8). There were six different E3 ligases showing increased mRNA levels with that number increasing to 11 following reloading (Fig. 1). This increase in transcription of E3 ligases even after the removal of the disuse stimulus may contribute to a cellular environment that favors catabolism. Among these genes was Atrogin1, the upregulation of which was confirmed at 48 h UL via qRT-PCR. Atrogin1 is a key mediator of contractile protein proteolysis. Moreover, data of Urso et al. (51) suggested that Atrogin1 may target proteins at the periphery of skeletal muscle cells such as dystrophin, a molecule that anchors myofibular proteins to the cell membrane. In agreement with the present study, Atrogin1 has been found to be upregulated with disuse atrophy in animals (7) and in humans 5 days (11) and 12 days (26) postimmobilization, and as early as 48 h post-spinal cord injury (51). However, previous finding from our laboratory (52) following 48 h immobilization found no significant differences in Atrogin1 gene expression. This discrepancy in findings may be a result of the differences between the experimental models. In both the ULLS model of the present study and the SCI model, there is no load placed on the limb, while in the immobilization model, the knee joint is prevented from flexing (thereby decreasing contraction of the biopsied muscle), but the limb is not prevented from loading. Therefore, while both unloading and immobilization studies in a rodent model have shown measurable changes in protein abundance for MAFbx/Atrogin1 (7), the time course of Atrogin1 expression in humans may be partially load dependent.
Although increased Atrogin1 mRNA was detected in the present study, there were no significant differences in Atrogin1 protein products. Similarly, Urso et al. (51) found that while Atrogin1 mRNA levels were increased for 2 days and 5 days post-spinal cord injury, there was no significant changes at the protein level. Atrogin1 expression may be controlled at the posttranscriptional level so as to prevent active atrophy following transient periods of disuse. Alternative splicing (9) and regulation by micro-RNA (53) have both been demonstrated with Atrogin1 in vitro and in animal models and are examples of potential posttranscriptional mechanisms in humans. Furthermore, it is possible that the activity of Atrogin1 and MuRF1 protein may be altered, as evidenced by the translocation of Atrogin1 to the membrane following 48 h immobilization (52). There was not enough tissue remaining from the present study with which to perform additional assays, but future directions should include measurement of signaling protein activity via analysis (such as Western blot) for phosphorylation of Akt/mammalian target of rapamycin (mTOR) pathway components.
Along with Atrogin1, E3 ligase MuRF1 has also been identified as a key regulator of skeletal muscle atrophy (7). In agreement with findings of Urso et al. (52), there was no significant increase in mRNA levels of MuRF1 in the present study. Although MuRF1 gene expression was recently shown to be upregulated in humans following immobilization (16), measurements were not taken until 10 days postdisuse. The lack of increased gene expression in the present study suggests that if MuRF1 is a key regulator of atrophy in humans, it follows a later time course than Atrogin1.
Additional E3 ligases were identified in the DAVID analysis (Fig. 1). While not previously addressed in literature related to skeletal muscle unloading or reloading, several of them, especially those differentially expressed following 24 h RL, are of particular interest because of their apparent functions. Activity of SMAD-specific E3 ubiquitin protein ligase 2 (SMURF2) has been proposed to inhibit bone formation in inflammatory bone disorders (28) and also to decrease Akt signaling (41), which could potentially promote muscle wasting. Ring finger protein 19 (RNF19, also known as dorfin) is an E3 ligase that has been shown to be increased in neurodegenerative diseases such as ALS (Table 3) (25). It has been previously proposed that remodeling of the neuromuscular junction may be an important component of disuse muscle atrophy (44).
E2 conjugating enzymes.
While E2 ligases are not as selective as E3 ligases, their activity is upstream in the UPP and they have been implicated in skeletal muscle atrophy (19, 72, 75). E2 ligases identified in the present dataset have been found to be associated with dexamethasone-induced skeletal muscle wasting (13) and cardiac cachexia (47) in rats, as well as the degradation of apoptosis- and catabolism-inducing proteins. As with the E3 ligases, the number of E2 ligases showing upregulated transcription increased from 48 h UL to 24 h RL. While they may serve to further compromise muscle tissue, it is also possible they may provide a protective function. For example, one of the E2 ligases that reaches significant upregulation only following 24 h RL, UBE2D2, functions to selectively target p53 for degradation (45), and thus could potentially protect muscle cells from apoptosis following disuse.
Oxidative stress response.
Oxidative stress has been implicated as a potential contributor in the initiation of disuse atrophy (24, 33, 54). Accumulation of reactive oxygen species (ROS) has been proposed to initiate a cascade of events leading to the release of actomyosin complexes from sarcomeres of skeletal muscle fibers with disuse (43). Cellular increases in ROS are accompanied by increases in stress response molecules, which have the role of neutralizing ROS and other reactive molecules, such as reactive iron, and maintaining reduction-oxidation (redox) balance.
In the present study, the canonical pathway NRF2-mediated oxidative stress response was ranked second only to the protein ubiquitination pathway for cluster 1 in IPA, suggesting that oxidative stress accompanied these conditions and that compensatory transcription may have occurred in an attempt to offset the effects of this cellular assault. The gene with the greatest increase in expression via microarray (confirmed through qRT-PCR and also via Western blot) was HMOX1, a component of this pathway.
Increases in stress response proteins following atrophic stimuli have often been observed in animals (24, 33), and HMOX1 is one such molecule (21, 24). A recent study (15) showed that after 8 days of bed rest, HMOX1 protein levels increased twofold. Furthermore, work in our laboratory has shown that HMOX1 mRNA (via microarray) increased 2 days and 5 days following spinal cord injury in humans (M. Urso, unpublished observation). HMOX1 may provide a protective mechanism in addition to its catalytic activity in heme breakdown. It has been shown to activate AKT (37) and therefore may decrease FOXO transcription factor activity. In addition, increases in HMOX1 transcription have been shown to lead to increases in ferritin, a storage protein that binds reactive iron (49), and therefore may serve an antioxidant function.
To provide evidence to support the hypothesis that HMOX1 expression increases antioxidant activity, Falk et al. (22) recently preserved redox balance during disuse (mechanical ventilation) in mice via treatment with hemin, a potent HMOX1 inducer. In the present study, the increase in HMOX1 transcripts was likely a protective strategy in response to oxidative stress associated with these conditions. The relationship between HMOX1 expression and proteolysis has not been established. HMOX1 was the single antioxidant shown to increase transcription following 48 h UL; however, following 24 h RL, increases in transcription were shown in a larger group of antioxidants (Fig. 2). Whether the increase in affected antioxidants following RL represents an “overshoot” effect of unloading or an independent response to reloading is not known.
Additional member genes of the NRF2-mediated oxidative stress response pathway that were differentially expressed in this dataset were heat shock proteins (HSPs) such as HSPB8 and DNAJ subfamily B and C. HSPB8 was upregulated under both the UL and RL conditions and is a member of the superfamily of small HSPs (sHSP) and has been shown to exert cytoprotective and anti-apoptotic effects following insults to muscle tissue such as ischemic/reperfusion injury (31). Although little is known about this newly discovered sHSP, a loss-of-function mutation in the gene has been associated with the neurodegenerative disorder, Charcot-Marie-Tooth disease type 2Lc (31). Conversely, overexpression of HSPB8 has been associated with hypertrophy in cardiac muscle cells (29). Although the mechanism by which HSPB8 exerts its effects is unknown, it is possible that in the present study, subclinical levels of oxidative stress led to compensatory increases in HSPB8 mRNA levels.
Whereas the majority of differentially expressed genes in the NRF2-mediated stress response pathway were upregulated, transcription of some DNAJ genes was downregulated under both UL and RL conditions. Furthermore, the number of affected DNAJ proteins increased following 24 h UL (Fig. 2). DNAJ proteins are chaperones that interact with HSPs, such as HSP70 (30). Studies have shown that induction of HSP70 can attenuate atrophy in rodents (46). Downregulation of a subset of DNAJ genes at both the UL and RL time points in this study could contribute to increased vulnerability of the skeletal muscle. Transcription of DNAJ genes is downstream of NRF2 transcription in the pathway, and it is unknown as to why the pattern of expression for some in this family was downregulated while the rest of the pathway was upregulated.
Extracellular matrix remodeling.
An interesting finding in this study was that a component of COL4 (encoding for collagen protein) was upregulated via microarray and qRT-PCR in contrast to previous studies that consistently found downregulation of collagen proteins with disuse, including previous work in our laboratory (52). COL4 genes encode for multiple subunits of the most abundant ECM collagen protein, and it has been suggested that a decrease in this collagen and others following disuse lead to both a decrease in the integrity of the ECM as well as an increase in the intracellular signaling that regulates protein degradation (52). The present finding would appear to stand in opposition to the previous evidence for a decrease in gene expression related to collagen. However, it is important to note that COL4A3, the gene found to be upregulated in the present study, is not limited to its role as a structural component of collagen. COL4A3 also serves as a precursor for tumstatin. Although the effects of increased tumstatin in muscle have not been studied, we speculate that it serves similar functions as in other tissues. In endothelial tissue, tumstatin functions as an inhibitor of cell proliferation and a promoter of apoptosis (38). The mechanism by which tumstatin exerts its effects is mediated by the Akt/mTOR pathway and leads to protein synthesis inhibition (36). Limited tissue precluded the measurement of proteins other than Atrogin1 and HMOX1 via Western blot. Therefore, it would be valuable in future studies to measure the abundance of tumstatin protein following short-term disuse, especially since its synthesis can result from cleavage of precursor COL4A3 rather than translation from mRNA. Finally, it is also possible that the transcription of COL4A3 may differ among disuse models. While decreases in this gene were documented following 48 h immobilization (52), microarray results following 48 h spinal cord injury have shown twofold downregulation of this transcript, in agreement with the UL results [deposited in the GEO profiles database (3) http://www.ncbi.nlm.nih.gov/projects/geo accession no. GSE21497].
Summary.
Microarray technology and high-throughput software tools have allowed us to examine not only the global patterns of gene expression associated with short-term UL and RL but also the biological significance of these changes. The results of this study suggest that alterations in gene expression associated with atrophy-related functions such as protein degradation and oxidative stress following UL as previously found in the literature may occur as early as 48 h following the introduction of the UL stimulus, although increased magnitude or duration of that stimulus may be necessary to trigger translation of atrophy-related protein products and measurable atrophy. A limitation of this study is that muscle cross-sectional area was not measured, and therefore, it cannot be asserted with certainty that no measurable atrophy took place over the course of the protocol; however, as no significant differences in fiber cross-sectional area were observed following 8 days of bed rest (15), it is unlikely that any measurable atrophy would be observed following 48 h UL. While increases in proteolytic gene expression found in this study suggest that there are similarities between expression patterns following 48 h UL and IM, differences likely exist between the two disuse models as evidenced by decreases in collagen found with UL. Before this study, HMOX1 had emerged as a potential regulator following UL in animals (24, 27, 33, 48), and the present study extends this important finding to humans. Finally, the gene expression patterns with UL were not readily reversed on RL, suggesting that molecular responses to short-term periods of skeletal muscle inactivity in humans may persist even after activity resumes. The high-throughput analysis used in the present study identified genes in pathways and functional groups that can provide a roadmap for future studies of muscle atrophy and reloading.
GRANTS
This research was supported by a National Aeronautics and Space Administration Space Physiology Research Grant from the American College of Sports Medicine Foundation, the NCMRR Integrated Molecular Core for Rehabilitation Medicine, and Sigma Xi.
DISCLOSURES
No conflicts of interest, financial or otherwise, are declared by the authors.
ACKNOWLEDGMENTS
We thank Dr. Rongye Shi for assisting microarray data processing, Cherie Bilbie for arranging and assisting with the muscle biopsies, Dr. Larry Schwartz for providing access to laboratory equipment assisting in data interpretation, and Christine Brown for assistance in protocol development and advice. We also acknowledge Marc McColeman, Ryan Chang, and Fred Advincula of Kintec Footlabs for designing the specialized shoe for this study and donating materials and their services.
REFERENCES
- 1. Adams GR, Caiozzo VJ, Baldwin KM. Skeletal muscle unweighting: spaceflight and ground-based models. J Appl Physiol 95: 2185–2201, 2003 [DOI] [PubMed] [Google Scholar]
- 2. Ahtikoski AM, Koskinen SO, Virtanen P, Kovanen V, Risteli J, Takala TE. Synthesis and degradation of type IV collagen in rat skeletal muscle during immobilization in shortened and lengthened positions. Acta Physiol Scand 177: 473–481, 2003 [DOI] [PubMed] [Google Scholar]
- 3. Barrett T, Troup DB, Wilhite SE, Ledoux P, Rudnev D, Evangelista C, Kim IF, Soboleva A, Tomashevsky M, Marshall KA, Phillippy KH, Sherman PM, Muertter RN, Edgar R. NCBI GEO: archive for high-throughput functional genomic data. Nucleic Acids Res 37: D885–D890, 2009 [DOI] [PMC free article] [PubMed] [Google Scholar]
- 4. Berg HE, Dudley GA, Haggmark T, Ohlsen H, Tesch PA. Effects of lower limb unloading on skeletal muscle mass and function in humans. J Appl Physiol 70: 1882–1885, 1991 [DOI] [PubMed] [Google Scholar]
- 5. Bey L, Akunuri N, Zhao P, Hoffman EP, Hamilton DG, Hamilton MT. Patterns of global gene expression in rat skeletal muscle during unloading and low-intensity ambulatory activity. Physiol Genomics 13: 157–167, 2003 [DOI] [PubMed] [Google Scholar]
- 7. Bodine SC, Latres E, Baumhueter S, Lai VK, Nunez L, Clarke BA, Poueymirou WT, Panaro FJ, Na E, Dharmarajan K, Pan ZQ, Valenzuela DM, DeChiara TM, Stitt TN, Yancopoulos GD, Glass DJ. Identification of ubiquitin ligases required for skeletal muscle atrophy. Science 294: 1704–1708, 2001 [DOI] [PubMed] [Google Scholar]
- 8. Bodine SC, Stitt TN, Gonzalez M, Kline WO, Stover GL, Bauerlein R, Zlotchenko E, Scrimgeour A, Lawrence JC, Glass DJ, Yancopoulos GD. Akt/mTOR pathway is a crucial regulator of skeletal muscle hypertrophy and can prevent muscle atrophy in vivo. Nature Cell Biol 3: 1014–1019, 2001 [DOI] [PubMed] [Google Scholar]
- 9. Bower NI, de la Serrana DG, Johnston IA. Characterisation and differential regulation of MAFbx/Atrogin-1 alpha and beta transcripts in skeletal muscle of Atlantic salmon (Salmo salar). Biochem Biophys Res Commun 396: 265–271, 2010 [DOI] [PubMed] [Google Scholar]
- 10. Calvano SE, Xiao W, Richards DR, Felciano RM, Baker HV, Cho RJ, Chen RO, Brownstein BH, Cobb JP, Tschoeke SK, Miller-Graziano C, Moldawer LL, Mindrinos MN, Davis RW, Tompkins RG, Lowry SF. A network-based analysis of systemic inflammation in humans. Nature 437: 1032–1037, 2005 [DOI] [PubMed] [Google Scholar]
- 11. Chen YW, Gregory CM, Scarborough MT, Shi R, Walter GA, Vandenborne K. Transcriptional pathways associated with skeletal muscle disuse atrophy in humans. Physiol Genomics 31: 510–520, 2007 [DOI] [PubMed] [Google Scholar]
- 12. Chen YW, Zhao P, Borup R, Hoffman EP. Expression profiling in the muscular dystrophies: identification of novel aspects of molecular pathophysiology. J Cell Biol 151: 1321–1336, 2000 [DOI] [PMC free article] [PubMed] [Google Scholar]
- 13. Chrysis D, Underwood LE. Regulation of components of the ubiquitin system by insulin-like growth factor I and growth hormone in skeletal muscle of rats made catabolic with dexamethasone. Endocrinology 140: 5635–5641, 1999 [DOI] [PubMed] [Google Scholar]
- 14. Combaret L, Adegoke OAJ, Bedard N, Baracos V, Attaix D, Wing SS. USP19 is a ubiquitin-specific protease regulated in rat skeletal muscle during catabolic states. Am J Physiol Endocrinol Metab 288: E693–E700, 2005 [DOI] [PubMed] [Google Scholar]
- 15. Dalla Libera L, Ravara B, Gobbo V, Tarricone E, Vitadello M, Biolo G, Vescovo G, Gorza L. A transient antioxidant stress response accompanies the onset of disuse atrophy in human skeletal muscle. J Appl Physiol 107: 549–557, 2009 [DOI] [PubMed] [Google Scholar]
- 16. de Boer MD, Maganaris CN, Seynnes OR, Rennie MJ, Narici MV. Time course of muscular, neural and tendinous adaptations to 23 day unilateral lower-limb suspension in young men. J Physiol 583: 1079–1091, 2007 [DOI] [PMC free article] [PubMed] [Google Scholar]
- 17. Dennis G, Jr, Sherman BT, Hosack DA, Yang J, Gao W, Lane HC, Lempicki RA. DAVID: database for annotation, visualization, and integrated discovery. Genome Biol 4: P3, 2003 [PubMed] [Google Scholar]
- 18. Dopazo J. Formulating and testing hypotheses in functional genomics. Artif Intell Med 45: 97–107, 2009 [DOI] [PubMed] [Google Scholar]
- 19. Drummond MJ, Glynn EL, Lujan HL, Dicarlo SE, Rasmussen BB. Gene and protein expression associated with protein synthesis and breakdown in paraplegic skeletal muscle. Muscle Nerve 37: 505–513, 2008 [DOI] [PMC free article] [PubMed] [Google Scholar]
- 20. Eisen MB, Spellman PT, Brown PO, Botstein D. Cluster analysis and display of genome-wide expression patterns. Proc Natl Acad Sci USA 95: 14863–14868, 1998 [DOI] [PMC free article] [PubMed] [Google Scholar]
- 21. Falk DJ, Deruisseau KC, Van Gammeren DL, Deering MA, Kavazis AN, Powers SK. Mechanical ventilation promotes redox status alterations in the diaphragm. J Appl Physiol 101: 1017–1024, 2006 [DOI] [PubMed] [Google Scholar]
- 22. Falk DJ, Whidden MA, Kavazis AN, Smuder AJ, McClung JM, Powers SK. Hemin administration during mechanical ventilation attenuates redox disturbances in the diaphragm. FASEB J 21: LB117-b, 2007 [Google Scholar]
- 23. Huang DW, Sherman BT, Lempicki RA. Systematic and integrative analysis of large gene lists using DAVID bioinformatics resources. Nat Protocols 4: 44–57, 2008 [DOI] [PubMed] [Google Scholar]
- 24. Hunter RB, Mitchell-Felton H, Essig DA, Kandarian SC. Expression of endoplasmic reticulum stress proteins during skeletal muscle disuse atrophy. Am J Physiol Cell Physiol 281: C1285–C1290, 2001 [DOI] [PubMed] [Google Scholar]
- 25. Ishigaki S, Hishikawa N, Niwa Ji, Iemura Si, Natsume T, Hori S, Kakizuka A, Tanaka K, Sobue G. Physical and functional interaction between dorfin and valosin-containing protein that are colocalized in ubiquitylated inclusions in neurodegenerative disorders. J Biol Chem 279: 51376–51385, 2004 [DOI] [PubMed] [Google Scholar]
- 26. Jones SW, Hill RJ, Krasney PA, O'Conner B, Peirce N, Greenhaff PL. Disuse atrophy and exercise rehabilitation in humans profoundly affects the expression of genes associated with the regulation of skeletal muscle mass. FASEB J 18: 1025–1027, 2004 [DOI] [PubMed] [Google Scholar]
- 27. Kandarian SC, Jackman RW. Intracellular signaling during skeletal muscle atrophy. Muscle Nerve 33: 155–165, 2006 [DOI] [PubMed] [Google Scholar]
- 28. Kaneki H, Guo R, Chen D, Yao Z, Schwarz EM, Zhang YE, Boyce BF, Xing L. Tumor necrosis factor promotes Runx2 degradation through up-regulation of Smurf1 and Smurf2 in osteoblasts. J Biol Chem 281: 4326–4333, 2006 [DOI] [PMC free article] [PubMed] [Google Scholar]
- 29. Kim MV, Seit-Nebi AS, Gusev NB. The problem of protein kinase activity of small heat shock protein Hsp22 (H11 or HspB8). Biochem Biophys Res Commun 325: 649–652, 2004 [DOI] [PubMed] [Google Scholar]
- 30. Ku Z, Yang J, Menon V, Thomason DB. Decreased polysomal HSP-70 may slow polypeptide elongation during skeletal muscle atrophy. Am J Physiol Cell Physiol 268: C1369–C1374, 1995 [DOI] [PubMed] [Google Scholar]
- 31. Laskowska E. [Small heat shock proteins—role in apoptosis, cancerogenesis and diseases associated with protein aggregation]. Postepy Biochem 53: 19–26, 2007 [PubMed] [Google Scholar]
- 32. Lawler JM, Song W, Kwak HB. Differential response of heat shock proteins to hindlimb unloading and reloading in the soleus. Muscle Nerve 33: 200–207, 2006 [DOI] [PubMed] [Google Scholar]
- 33. Lecker SH, Jagoe RT, Gilbert A, Gomes M, Baracos V, Bailey J, Price SR, Mitch WE, Goldberg AL. Multiple types of skeletal muscle atrophy involve a common program of changes in gene expression. FASEB J 18: 39–51, 2004 [DOI] [PubMed] [Google Scholar]
- 34. Liu WM, Mei R, Di X, Ryder TB, Hubbell E, Dee S, Webster TA, Harrington CA, Ho MH, Baid J, Smeekens SP. Analysis of high density expression microarrays with signed-rank call algorithms. Bioinformatics 18: 1593–1599, 2002 [DOI] [PubMed] [Google Scholar]
- 35. Livak KJ, Schmittgen TD. Analysis of relative gene expression data using real-time quantitative PCR and the 2(-Delta Delta C(T)) Method. Methods 25: 402–408, 2001 [DOI] [PubMed] [Google Scholar]
- 36. Maeshima Y, Sudhakar A, Lively JC, Ueki K, Kharbanda S, Kahn CR, Sonenberg N, Hynes RO, Kalluri R. Tumstatin, an endothelial cell-specific inhibitor of protein synthesis. Science 295: 140–143, 2002 [DOI] [PubMed] [Google Scholar]
- 37. Martin D, Rojo AI, Salinas M, Diaz R, Gallardo G, Alam J, De Galarreta CM, Cuadrado A. Regulation of heme oxygenase-1 expression through the phosphatidylinositol 3-kinase/Akt pathway and the Nrf2 transcription factor in response to the antioxidant phytochemical carnosol. J Biol Chem 279: 8919–8929, 2004 [DOI] [PubMed] [Google Scholar]
- 38. Ninichuk V, Gross O, Segerer S, Hoffmann R, Radomska E, Buchstaller A, Huss R, Akis N, Schlondorff D, Anders HJ. Multipotent mesenchymal stem cells reduce interstitial fibrosis but do not delay progression of chronic kidney disease in collagen4A3-deficient mice. Kidney Int 70: 121–129, 2006 [DOI] [PubMed] [Google Scholar]
- 39. Ogawa T, Furochi H, Mameoka M, Hirasaka K, Onishi Y, Suzue N, Oarada M, Akamatsu M, Akima H, Fukunaga T, Kishi K, Yasui N, Ishidoh K, Fukuoka H, Nikawa T. Ubiquitin ligase gene expression in healthy volunteers with 20-day bedrest. Muscle Nerve 34: 463–469, 2006 [DOI] [PubMed] [Google Scholar]
- 40. Ogawa T, Furochi H, Mameoka M, Hirasaka K, Onishi Y, Suzue N, Oarada M, Akamatsu M, Akima H, Fukunaga T, Kishi K, Yasui N, Ishidoh K, Fukuoka H, Nikawa T. Ubiquitin ligase gene expression in healthy volunteers with 20-day bedrest. Muscle Nerve 34: 463–469, 2006 [DOI] [PubMed] [Google Scholar]
- 41. Ohashi N, Yamamoto T, Uchida C, Togawa A, Fukasawa H, Fujigaki Y, Suzuki S, Kitagawa K, Hattori T, Oda T, Hayashi H, Hishida A, Kitagawa M. Transcriptional induction of Smurf2 ubiquitin ligase by TGF-beta. FEBS Lett 579: 2557–2563, 2005 [DOI] [PubMed] [Google Scholar]
- 42. Phillips SM, Glover EI, Rennie MJ. Alterations of protein turnover underlying disuse atrophy in human skeletal muscle. J Appl Physiol 107: 645–654, 2009 [DOI] [PubMed] [Google Scholar]
- 43. Powers SK, Kavazis AN, McClung JM. Oxidative stress and disuse muscle atrophy. J Appl Physiol 102: 2389–2397, 2007 [DOI] [PubMed] [Google Scholar]
- 44. Sacheck JM, Hyatt JP, Raffaello A, Jagoe RT, Roy RR, Edgerton VR, Lecker SH, Goldberg AL. Rapid disuse and denervation atrophy involve transcriptional changes similar to those of muscle wasting during systemic diseases. FASEB J 21: 140–155, 2007 [DOI] [PubMed] [Google Scholar]
- 45. Saville MK, Sparks A, Xirodimas DP, Wardrop J, Stevenson LF, Bourdon JC, Woods YL, Lane DP. Regulation of p53 by the ubiquitin-conjugating enzymes UbcH5B/C in vivo. J Biol Chem 279: 42169–42181, 2004 [DOI] [PubMed] [Google Scholar]
- 46. Senf SM, Dodd SL, Judge AR. FOXO signaling is required for disuse muscle atrophy and is directly regulated by Hsp70. Am J Physiol Cell Physiol 298: C38–C45, 2010 [DOI] [PMC free article] [PubMed] [Google Scholar]
- 47. Steffen BT, Lees SJ, Booth FW. Anti-TNF treatment reduces rat skeletal muscle wasting in monocrotaline-induced cardiac cachexia. J Appl Physiol 105: 1950–1958, 2008 [DOI] [PubMed] [Google Scholar]
- 48. Stevenson EJ, Giresi PG, Koncarevic A, Kandarian SC. Global analysis of gene expression patterns during disuse atrophy in rat skeletal muscle. J Physiol 551: 33–48, 2003 [DOI] [PMC free article] [PubMed] [Google Scholar]
- 49. Suttner DM, Sridhar K, Lee CS, Tomura T, Hansen TN, Dennery PA. Protective effects of transient HO-1 overexpression on susceptibility to oxygen toxicity in lung cells. Am J Physiol Lung Cell Mol Physiol 276: L443–L451, 1999 [DOI] [PubMed] [Google Scholar]
- 50. Tesch PA, von Walden F, Gustafsson T, Linnehan RM, Trappe TA. Skeletal muscle proteolysis in response to short-term unloading in humans. J Appl Physiol 105: 902–906, 2008 [DOI] [PMC free article] [PubMed] [Google Scholar]
- 50a. Tumor Analysis Best Practices Working Group Expression profiling–best practices for data generation, and interpretation in clinical trials. Nat Rev Genet 5: 229–237, 2004 [DOI] [PubMed] [Google Scholar]
- 51. Urso ML, Chen YW, Scrimgeour AG, Lee PC, Lee KF, Clarkson PM. Alterations in mRNA expression and protein products following spinal cord injury in humans. J Physiol 579: 877–892, 2007 [DOI] [PMC free article] [PubMed] [Google Scholar]
- 52. Urso ML, Scrimgeour AG, Chen YW, Thompson PD, Clarkson PM. Analysis of human skeletal muscle after 48 h immobilization reveals alterations in mRNA and protein for extracellular matrix components. J Appl Physiol 101: 1136–1148, 2006 [DOI] [PubMed] [Google Scholar]
- 53. Wada R, Akiyama Y, Hashimoto Y, Fukamachi H, Yuasa Y. miR-212 is downregulated and suppresses methyl-CpG-binding protein MeCP2 in human gastric cancer. Int J Cancer 127:1106–1114, 2009 [DOI] [PubMed] [Google Scholar]
- 54. Whidden MA, Smuder AJ, Wu M, Hudson MB, Nelson WB, Powers SK. Oxidative stress is required for mechanical ventilation-induced protease activation in the diaphragm. J Appl Physiol 108: 1376–1382, 2010 [DOI] [PMC free article] [PubMed] [Google Scholar]