

Abstract
As grasshoppers increase in size during ontogeny, they have mass specifically greater whole body tracheal and tidal volumes and ventilation than predicted by an isometric relationship with body mass and body volume. However, the morphological and physiological bases to this respiratory hypermetry are unknown. In this study, we use synchrotron imaging to demonstrate that tracheal hypermetry in developing grasshoppers (Schistocerca americana) is due to increases in air sacs and tracheae and occurs in all three body segments, providing evidence against the hypothesis that hypermetry is due to gaining flight ability. We also assessed the scaling of air sac structure and function by assessing volume changes of focal abdominal air sacs. Ventilatory frequencies increased in larger animals during hypoxia (5% O2) but did not scale in normoxia. For grasshoppers in normoxia, inflated and deflated air sac volumes and ventilation scaled hypermetrically. During hypoxia (5% O2), many grasshoppers compressed air sacs nearly completely regardless of body size, and air sac volumes scaled isometrically. Together, these results demonstrate that whole body tracheal hypermetry and enhanced ventilation in larger/older grasshoppers are primarily due to proportionally larger air sacs and higher ventilation frequencies in larger animals during hypoxia. Prior studies showed reduced whole body tracheal volumes and tidal volume in late-stage grasshoppers, suggesting that tissue growth compresses air sacs. In contrast, we found that inflated volumes, percent volume changes, and ventilation were identical in abdominal air sacs of late-stage fifth instar and early-stage animals, suggesting that decreasing volume of the tracheal system later in the instar occurs in other body regions that have harder exoskeleton.
Keywords: development, insect, respiration, tracheae
the tracheal respiratory system of insects is a light-weight, tubular system for exchanging gases between atmosphere and tissue. Its basic structure consists of tracheal tubes, which are formed from invaginations of the entire integument of the cuticle. Tracheae connect with the atmosphere through openings called spiracles, which usually have closable valves. Some insects, including grasshoppers, have air sacs that are enlarged tracheae lacking the normal exocuticle and taenidia and are hypothesized to act as bellows to aid convective airflow (for review see Refs. 1 and 8). Tracheae branch into smaller and finer tubes, finally reaching cells as tracheoles, where O2 diffuses across the tracheolar membrane to cells.
Increasing evidence suggests that, among insects, larger animals may invest a greater proportion of their body in tracheal respiratory structures (tracheal hypermetry) (14). For example, tracheal volumes increase with mass1.3 across Tenebrionid beetle species (14). Similarly, in the grasshopper Schistocerca americana, tracheal volume, as measured by an inert gas technique, increased with mass1.3 during ontogeny (18). There is little information on the structural basis to tracheal hypermetry, although it has been shown that tracheae to the leg, but not the head, exhibit hypermetry in interspecific comparisons among beetles (14). Is the proportional increase in tracheal volumes of larger grasshoppers due to changes in air sac or tracheal size or changes in the number of air sacs and/or tracheal structures?
Tracheal hypermetry may be due to the need to overcome increasing diffusion distances in larger insects (9). However, one obvious alternative explanation for tracheal hypermetry in developing grasshoppers is that this occurs to support the increased metabolic demands of flight (which occur only in adults). If this is the case, perhaps tracheal hypermetry during ontogeny of grasshoppers is due to development of thoracic air sacs, which may supply the flight muscles.
In S. americana, larger/older grasshoppers have greater tidal volumes than smaller/younger grasshoppers and show stronger increases in ventilation frequency and tidal volume in response to hypoxia (4). The mechanisms by which larger/older grasshoppers achieve greater mass-specific ventilation than smaller/younger animals are unclear. The greater tracheal volume of larger/older grasshoppers (18) may be associated with larger air sacs, which serve as bellows for this respiratory system. An alternate explanation for greater tidal volumes in larger grasshoppers is that older animals develop stronger abdominal muscles, which allow greater air sac deflation. There are no data on the scaling of air sac size or the degree of air sac volume changes during breathing for any insect.
In addition to growth across instars, insects experience tremendous growth within an instar. During the intramolt period, body mass continues to increase, while external structures exhibit minimal changes in dimensions. In S. americana, body mass nearly doubles within an instar (5), and tracheal system volumes strongly decrease, presumably due to deflation of air sacs by growing tissues (2, 18). The decreased tracheal volumes have been shown to be associated with higher critical Po2 (the Po2 below which metabolism or function can no longer be maintained) at the end of an instar for two species of insect, including S. americana, suggesting that the decreasing volume of the tracheal system inhibits respiratory function (5, 6); however, no direct measures of air sac volume changes exist.
In this study, we used synchrotron X-ray imaging (25, 29) of live grasshoppers to quantify multiple aspects of tracheal system structure and function in S. americana of different ages, body sizes, and developmental stages. Using digital video imaging, we were able to visualize the tracheal system in living grasshoppers with a spatial resolution of <10 μm and a temporal resolution of <0.02 s. To address the structural basis of whole body tracheal hypermetry, we quantified the number of tracheae and air sacs in the head, thorax, and abdomen across grasshoppers of different instars, but at a similar stage within the instar. We also examined the effect of size on the function of the tracheal system by measuring the scaling of the volume change and ventilation in focal air sacs. To test whether the decrease in tracheal system volume at the end of the instar inhibits respiratory system function, we compared the volume and degree of volume changes of focal abdominal air sacs of grasshoppers sampled early or late in the fifth instar, during normoxia and hypoxia. Finally, we measured the effect of the X-ray beam on body temperature, ventilation frequency, and CO2 emission rate to assess the possibility that the X-ray beam had pathological effects on the grasshoppers during our measurements.
MATERIALS AND METHODS
Animals.
S. americana Drury were reared from eggs in culture at Arizona State University, as previously described (10). Experimental animals were haphazardly selected from the animal care facility and shipped overnight to Argonne National Laboratory, where they had ad libitum access to lettuce and water until use. Ambient temperature in the experimental room was 22 ± 2°C. We used only male adults, but the sex of juveniles was not determined. Animals were weighed to the nearest 0.1 mg with an analytical balance (model 245, Mettler) immediately before experimentation. Animals were placed in Lucite chambers, two sides of which were constructed of X-ray-transparent Kapton (DuPont) polyimide film. A drop of low-melting-point glue was used to secure the ventral surface of each animal's thorax to a piece of Kapton to prevent the animal from turning in the chamber, while leaving the abdomen free to contract. Animals were not deeply resting, as evidenced by the lack of discontinuous ventilation (15, 16).
X-ray imaging.
Tracheal systems were visualized using phase-contrast synchronized X-rays, as previously described (25, 29). Grasshoppers were imaged with a Cohu-cooled charge-coupled device video camera, and the digital video was recorded using a TRV 900 camcorder (Sony, Tokyo, Japan). A ×2 objective lens was used for the larger animals, and a ×5 objective was used for the smaller animals. Because the animals were larger than the ∼2- to 5-mm2 image, we used remotely controlled stages to move the animals relative to the beam, allowing us to scan the entire body of each insect. We also scanned a 400-mesh metal grid as a spatial scale. Most animals spent only a few minutes in the X-ray beam, but adult grasshoppers survived up to 30-min exposures to the X-rays; longer exposures were not tested. Grasshoppers are unusually tolerant of X-ray radiation (25). These animals fed and mated after exposure, also suggesting that radiation damage to the animals was insignificant.
CO2 emission rates and thoracic temperature.
The animal chambers were relatively air-tight, allowing measurement of CO2 emission by flow-through respirometry, as previously described (4). Briefly, mass-flow controllers delivered dry, CO2-free air from compressed air tanks via Drierite and Ascarite scrubbers. Thus incurrent CO2 was zero. Flow rates varied depending on animal size and were much higher in adults to achieve breath-by-breath resolution of CO2 emission. Excurrent air was dried with MgClO4, and excurrent CO2 concentration was measured with a CO2 analyzer (model 6251, Li-Cor, Lincoln, NE). Before the experiment, the gas analyzer's linearized output was checked for linearity with a six-point calibration (with test gases generated by mass flowmeters), and the calibration (slope and zero) was adjusted daily during the experiment with a two-point calibration using CO2-free air and gas containing 300 ppm CO2-balance N2. Pressures and temperatures were monitored and maintained constant in the Li-Cor instrument during calibration and animal measurements using mass flowmeters. Using Sable Systems DataCan, we analyzed mean CO2 concentration over 1-min intervals for each animal from the 1st to the 10th min of beam exposure. Resting CO2 emission was recorded from the minute before the beam was turned on, and recovery CO2 emission was recorded during the 1st min after the beam was turned off. Mass-specific CO2 emission rate (μmol·g−1·h−1) was calculated by multiplying the CO2 concentration (μmol/l) by the stp volume flow rate (l/h; Sierra Instruments, Monterey, CA) and dividing by each animal's body mass in grams.
The effect of the X-ray beam on thoracic temperature (Tth, °C) was measured using a copper-constantan thermocouple in three adult grasshoppers. The thermocouple probe was inserted into a small hole in the grasshopper's thorax and secured with a drop of low-melting-point glue. This allowed for continuous recording of Tth before, during, and after exposure to the X-ray beam. The signals from the thermocouple and the CO2 analyzer were digitized and recorded using a data acquisition system (Sable Systems, Las Vegas, NV; Fig. 1). For analysis of Tth data, we used Sable Systems data analysis to obtain 10-s average temperatures at 20 different time points throughout the experiment, before, during, and after exposure to the X-ray beam.
Fig. 1.
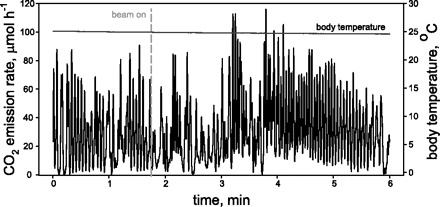
CO2 emission rate overlaid with thoracic temperature data. Dashed line indicates the point at which the X-ray beam was turned on.
Breathing frequency and tracheal system volume changes.
Breathing frequencies (abdominal pumping rate) were counted visually using a standard video camera before X-ray exposure. Abdominal pumps were observed to be correlated with air sac movements in the X-ray images, so we counted breathing frequencies during the X-ray exposure from the rate of air sac inflation frequencies. In addition, for the largest grasshoppers, we used flow rates fast enough to resolve breath-by-breath CO2 emission, so our measures of breathing frequency were also verified by the CO2 emission traces.
Percent air sac volume change (ΔV; see supplemental movie in the online version of this article) was measured using a dorsoventral view for one to three inflations of abdominal air sacs located dorsal and lateral to the gut from 59 animals varying in age/size. We used three criteria to select air sacs for analysis: 1) they were located in abdominal segment 2 or 3, except in the youngest instars, for which air sacs were so scarce that this specificity was impossible, 2) their shape was spherical and consistent across instars to facilitate geometric approximation, and 3) ΔV could be quantified with each abdominal pump. We selected frames that showed abdominal air sacs at their maximum (inflated) and minimum (deflated) sizes and measured air sac areas at these points. Because air sacs appeared similar in shape across size, we measured the depth-to-width ratio for these air sacs for three adult grasshoppers that were tethered to maintain their exact position in the beam and then imaged dorsoventrally and laterally (depth-to-width ratio averaged 1.07 and did not vary significantly between expanded and compressed air sacs). Volumes were calculated from measured air sac images viewed dorsoventrally using this depth-to-width ratio, with the assumption that the air sac was an ellipsoid.
Measurement of tracheal system projection area.
We could not assess tracheal volumes directly from the X-ray images, as done by Kaiser et al. (14), because much of the tracheal system in S. americana is composed of air sacs with complex morphology; thus accurate tracheal volume assessment will require tomographic techniques in this species. Therefore, we used the fraction of the area in the projection image occupied by the animal's tracheal system as a relative measure of tracheal investment across individuals. Digital images of phase-contrast X-rays were captured and printed for 21 animals ranging from first instar to adult (10 mg–1.5 g). One side (half) of each animal was analyzed by point counting (26) to quantify the proportion of the internal body cavity (percent image surface area) devoted to respiratory structures. Specifically, we estimated the fraction of the body image containing tracheae and air sacs for the whole body, head, thorax, and abdomen. The number of images analyzed ranged from three in the smallest animals to eight in the largest adults. Tracheal system structures with length greater than twice the width were classified as tracheae, whereas structures with a length less than twice the width were classified as air sacs.
Statistics.
Values are means ± SE. Statistical analyses were performed using Statistica version 8, SYSTAT version 12, and SPSS version 16.0 software, with our within-experiment type I error ≤5%. We used repeated-measures ANOVA to compare Tth, CO2 emission, and breathing frequencies of animals before, during, and after X-ray exposure. Two-way and factorial ANOVAs were used to identify significant effects of developmental stage and atmospheric O2 and their interaction. We used linear regression to test for a significant effect of body size on the proportional surface areas of tracheae, air sacs, and individual air sac ventilation. We used analysis of covariance to test for effects of body size and atmospheric O2 on air sac volumes and ventilation.
RESULTS
Tth (F9,9 = 0.05, P = 1.0; Fig. 2A), CO2 emission rates (F11,33 = 1.48, P = 0.19; Fig. 2B), and abdominal pumping rates (F12,24 = 0.51, P = 0.88; data not shown) did not differ significantly (by repeated-measures ANOVA) when we compared the several-minute period before the beam was turned on with the period of X-ray exposure and the period of recovery. There was also no variation in these parameters during the recovery period, after the beam was turned off, demonstrating that the X-ray beam did not substantially affect the animal's respiratory physiology or account for the patterns we describe here.
Fig. 2.
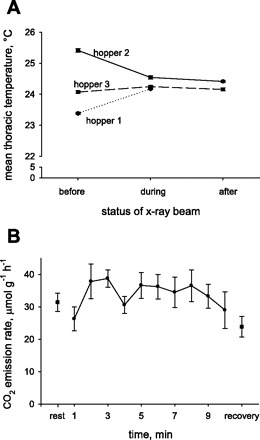
A: thoracic temperature (Tth) before, during, and after beam exposure. Data are shown for each grasshopper's mean Tth for each time period (n = 3 before and during, n = 2 after). B: mean CO2 emission rates of adult grasshoppers over time, before, during, and after exposure to the X-ray beam (n = 6).
Adults had more and larger-diameter tracheae than juveniles and a much more extensive system of air sacs (Fig. 3, B and D). Images of grasshoppers showed that most first instars completely lacked air sacs (Fig. 3, A and C). From point counting, we found that the fraction of tracheae, and especially air sacs, in the image increased strongly with size (Fig. 4). Some of the total measured areas were >1 because of excessive tracheal investment in the adults and overlapping structures (Fig. 4). We compared a variety of transformations of the data (log-log, semilog, ln, and untransformed), and, in all cases, larger animals devoted a significantly greater proportion of their body to respiratory structures. However, the best curve fits resulted from regressing the natural logarithm of the fraction of image on body mass (Fig. 4). Increases in investment in tracheal structures occurred in all regions of the body (Table 1). Regressions for head air sacs and tracheae had intercepts that were significantly less than zero, suggesting that the natural logarithmic fit does not work well in the lowest mass ranges.
Fig. 3.
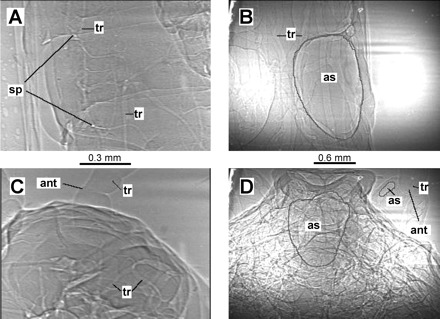
Tracheal system of Schistocerca americana. Images are first instar abdomen (A) and head (C) and adult abdomen (B) and head (D) in a dorsoventral view. Note different scales for juvenile and adult images. A few tracheae (tr) and air sacs (as) are indicated, as well as antennae (ant) and spiracles (sp). In older, larger animals, respiratory structures make up a much greater fraction of the images, and tracheae are proportionally larger in adults. Also, air sacs are abundant in adult, but not first instar grasshoppers.
Fig. 4.
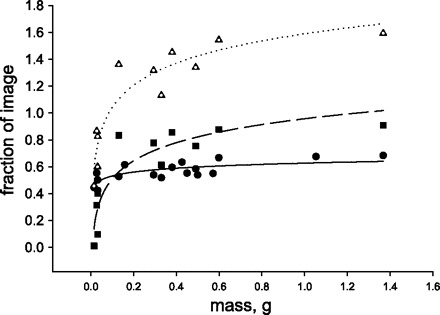
Fraction of X-ray images occupied by respiratory structures in grasshoppers increased nonlinearly with mass. Larger animals had more tracheae [•, solid line; fraction tracheae = 0.627 + 0.041 ln mass (g), r2 = 0.55, F1,15 = 20.9, P < 0.001], air sacs [▪, dashed line; fraction air sacs = 0.957 + 0.195 ln mass (g), r2 = 0.81, F1,15 = 42.6, P < 0.001], and summed respiratory structures [▵, dotted line; fraction total respiratory system = 1.59 + 0.238 ln mass (g), r2 = 0.87, F1,15 = 60.7, P < 0.001]. Fraction is >1 for summed structures because of overlapping tracheae and air sacs.
Table 1.
Linear regressions relating log(fractional image area) to log(mass, g)
| Intercept | Slope | r2 | P | |
|---|---|---|---|---|
| Head | ||||
| Tracheae | −0.284±0.028 | 0.128±0.050 | 0.32 | 0.021 |
| Air sacs | −0.598±0.174 | 0.498±0.105 | 0.16 | 0.005 |
| Thorax | ||||
| Tracheae | −0.221±0.025 | 0.067±0.029 | 0.28 | 0.037 |
| Air sacs | −0.048±0.108 | 0.330±0.123 | 0.34 | 0.018 |
| Abdomen | ||||
| Tracheae | −0.209±0.021 | 0.088±0024 | 0.48 | 0.003 |
| Air sacs | −0.223±0.127 | 1.068±0.156 | 0.77 | 0.001 |
Values are means ± SE, n = 16–18. For all regressions, slopes were significantly different from zero.
Air sac inflation frequency (F1,16 = 0.09, P = 0.775; 48 ± 0.02 min−1) and percent air sac ΔV (46 ± 6%) did not vary significantly with mass for grasshoppers in normoxia. In normoxia, inflated and deflated volumes for air sacs increased hypermetrically with body mass [F1,16 = 329.5, P < 0.001, slope = 1.375, and 95% confidence interval (CI) = 1.21–1.54 for inflated volumes (Fig. 5A), and F1,16 = 29.7, P < 0.001, slope = 1.72, and 95% CI = 1.49–1.94 for deflated volumes (Fig. 5A)]. In 5% O2, inflated volumes of air sacs scaled with mass0.95 (F1,17 = 96.3, P < 0.001; Fig. 5B), not significantly different from mass1 (95% CI of slope = 0.75–1.16). Deflated volumes for air sacs of seven grasshoppers in 5% O2 were near zero, resulting in no relationship between deflated volume and mass in hypoxia (Fig. 5B). Ventilation frequencies increased significantly with size in hypoxia (F1,17 = 5.11, P = 0.038, Fig. 6A). Air sac ventilation (ml/min) was significantly (by analysis of covariance) affected by body size and atmospheric O2 (F1,32 = 32.7 and P < 0.001 for effect of mass, and F1,32 = 9.8 and P < 0.01 for effect of O2). In normoxia, air sac ventilation scaled with mass1.26 (P < 0.01, 95% CI of slope = 0.55–1.98; Fig. 6B). In 5% O2, air sac ventilation increased and scaled with mass1.36 (P < 0.001, 95% CI of slope = 0.78–1.95; Fig. 6B). Thus air sac ventilation tended to scale hypermetrically but could not be distinguished statistically from isometric scaling.
Fig. 5.
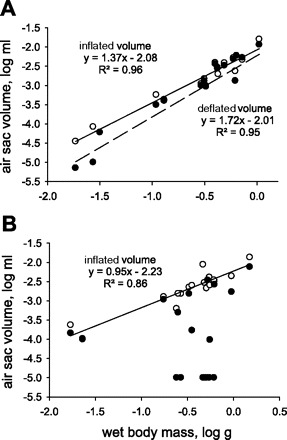
Log-log plot of volumes for individual abdominal air sacs vs. mass. Fully inflated (○, solid line) or deflated (•, dashed line) air sacs increased hypermetrically in volume with body mass in 21% O2 (A); in 5% O2 (B), open volumes increased isometrically with mass, whereas deflated volumes tended to be near zero and unrelated to mass.
Fig. 6.
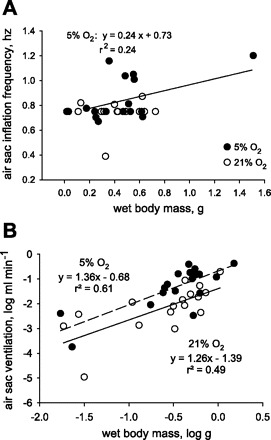
A: ventilation frequencies were independent of size in normoxia but increased with size in hypoxia (5% O2). B: ventilation within individual air sacs scaled hypermetrically with mass and was higher in 5% O2 than in 21% O2.
To determine the effects of intramolt development on air sac function, we compared air sac parameters at the beginning and end of the instar for juvenile grasshoppers in the fifth instar. Inflated volumes of air sacs were unaffected by developmental stage (F1,11 = 0.37, P = 0.55) or O2 level (F1,11 = 0.053, P = 0.82) within the fifth instar (data not shown). Percent air sac ΔV and air sac ventilation were significantly affected by O2, but not by developmental stage (Fig. 7, A and B; F1,17 = 24.02 and P < 0.001 for effect of O2 on ΔV, and F1,17 = 8.66 and P < 0.02 for effect of O2 on ventilation).
Fig. 7.
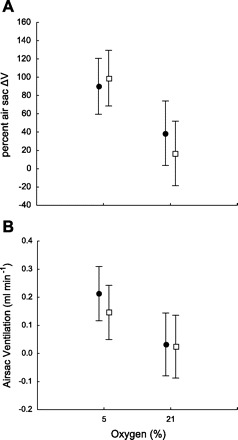
Effect of atmospheric O2 and developmental stage on air sac function. A: percent air sac volume change (ΔV) increased in hypoxia but was not affected by developmental stage. B: air sac ventilation increased in hypoxia but was not affected by developmental stage. Circles, early stage; squares, late stage.
DISCUSSION
Although it has long been assumed that only small insects could achieve adequate gas exchange by diffusion, only recently has it become clear that increasing proportional investment in tracheal structure is an important mechanism by which larger insects are able to support gas exchange (14, 18). In the present study, we have shown that this increased relative investment occurs in tracheae and air sacs and in all regions of the body, supporting the hypothesis that tracheal hypermetry is associated with size, rather than only supporting the increased metabolic rates associated with flight. Air sac volumes scaled hypermetrically, meaning that larger grasshoppers have proportionally larger air sacs. This, combined with higher ventilation frequencies (at least in hypoxia), provides increasing ventilation in larger grasshoppers. This increase in relative ventilation helps explain why larger insects do not have smaller safety margins for O2 delivery and suggests that O2 delivery should not directly limit body size in insects.
Hypermetry across instars.
In striking contrast to the patterns found in vertebrates, our findings (Fig. 4) confirm those of Lease et al. (18), who showed, using an inert gas method, that proportional investment in respiratory structures increases with body size in S. americana. In vertebrates, lung volumes are directly proportional to size, and proportional capillary contents decline in larger animals (3, 12, 27). Finding tracheal hypermetry in the Orthopterans studied here and the distantly related Coleopterans (14) suggests that this pattern of increased investment in respiratory structures in larger individuals may be common among insects. In support of this idea, small stick insects have tracheal volumes <2% of body volume (24), whereas adult grasshoppers have tracheal volumes >30% of body volume (18), and giant flying beetles are qualitatively reported to have tremendous air sacs (20). More comparative studies of disparate insect groups are required to determine whether tracheal hypermetry is the general pattern.
This increased investment in the tracheal system could be correlated with ontogenetic changes in locomotor strategy, since juvenile grasshoppers only hop, whereas adults can also fly. Flight increases metabolic rates 30-fold in S. americana (23), whereas jumping only requires a 4-fold increase over resting metabolism (17). If the rise in tracheal investment were associated simply with development of flight capacity, we would predict significant differences in tracheal investment to be observed only in the thorax, since the vast majority of ventilation during locust flight is due to thoracic autoventilation (28). Contrary to this prediction, the fraction of each image devoted to tracheae or air sacs increased in all segments, with the most dramatic size-related increases occurring for abdominal and head air sacs (Table 1). Furthermore, nonflying juveniles have more tracheae and air sacs than smaller juveniles, supporting the hypothesis that the increase in respiratory structures is not simply related to development of flight capacity and may, indeed, be related to the need for more ventilation to overcome longer diffusion distances (9).
Our data also demonstrate that greater mass-specific ventilation of larger grasshoppers in normoxia (4) is due primarily to larger air sacs. In normoxia, air sac inflated volumes and deflated volumes scaled hypermetrically (Fig. 5A), whereas the percentage of air sac ΔV (not shown) and inflation frequencies were not affected by size (Fig. 6A). Thus the greater tidal volumes (ml/breath) and ventilation rates (ml/min) in S. americana are not due to stronger abdominal contractions, which enhance the degree of air sac deflation, but, instead, can be attributed primarily to the increased size and volume of air sacs in larger grasshoppers.
In hypoxia (5% O2), the pattern of ventilatory frequency differed, with larger grasshoppers exhibiting higher ventilation frequencies (Fig. 6A), as previously reported (4). Also, the grasshoppers nearly completely deflated these air sacs, regardless of size (Fig. 5B), leading to substantially higher ventilation in hypoxia (Fig. 6B). In hypoxia, inflated air sac volumes scaled isometrically, perhaps indicating effects of active inspiration (13).
Our finding that these insects hyperdevelop their tracheal system as they grow provides strong evidence that O2 delivery becomes more challenging in larger insects. Increasing investment in air sacs and tracheae should have greater costs for larger insects, which must eventually constrain size. Kaiser et al. (14) suggested that tracheal filling of the leg coxae may be a key reason for size limitation in beetles. However, because the proportional investment in the tracheae increases in all body segments, other potential mechanisms of size limitation seem plausible.
Tracheal hypermetry can have at least two major consequences for insect morphology and physiology: 1) decreasing density and 2) displacement of other tissues. Decreasing density could lead to enlarged exoskeletons for insects of any given mass, potentially leading to increased nutrient costs and increased susceptibility to breakage. To determine the morphological consequences of tracheal system variation with body size, we used the relationships published in Lease et al. for S. americana (18) to calculate tracheal volume (Vtr, μl) for grasshoppers of arbitrary body mass log (Vtr) = 2.544 + 1.296*log M, where M is wet body mass in grams. We assumed that wet tissues have a density of 1 and that body volume (Vb) = M + Vtr. Actual tissue density will vary between 0.8 and 1.1 depending on fat and water content. Because of tracheal hypermetry, Vb is predicted to increase allometrically with M (log Vb = 1.104 logM + 0.181; r2 = 0.999). Thus 10-mg animals (approximately the smallest extant grasshoppers) would have a body density of 0.92 and Vb of 0.0109 ml, whereas a 10-g grasshopper would have a density of 0.59 (Vb = 16.9 ml), and a 1,000-g grasshopper would have a density of 0.27 and Vb of 3,679 ml. Larger volumes per gram will exacerbate biomechanical problems with the exoskeleton, such as elastic buckling, cuticle deformation during molting, and sensitivity to damage (22), suggesting that insect mass may ultimately be limited by secondary biomechanical consequences of tracheal hypermetry in larger insects. In support of this model, the legs of larger jumping insects contain proportionally similar muscle content but greater exoskeleton content (11, 21). Comparative scaling studies of insect exoskeleton mass, thickness, and biomechanical properties are needed to test the hypothesis that maximal insect size is actually constrained by biomechanical limitations of exoskeletons.
An alternate mechanism by which tracheal hypermetry could limit insect size is via fitness consequences resulting from displacement of other tissues such as brain, ovary, or digestive tract. Finally, it has been suggested that air sacs may displace hemolymph, serving to increase nutrient transport to muscles (19, 30); perhaps tracheal hypermetry reduces hemolymph volumes and circulatory function in larger insects. We calculated the percentage of body volume occupied by nonrespiratory tissues (%NRT) as % NRT = 100*M/Vb. The percentage of Vb occupied by nonrespiratory tissues falls quadratically with M (Fig. 8), from 92% in 10-mg grasshoppers to 59% in 10-g animals to 27% in 1,000-g grasshoppers. Potentially, survival or reproduction of larger grasshoppers could decrease relative to smaller individuals because of reduced locomotory, digestive, or reproductive capacities associated with proportionally smaller (relative to volume) muscles, digestive tract, or ovaries, leading to selection against large insects. Surprisingly, there have been very few scaling studies of tissue and organ sizes in insects to test these models, although these types of studies are quite common for vertebrates.
Fig. 8.
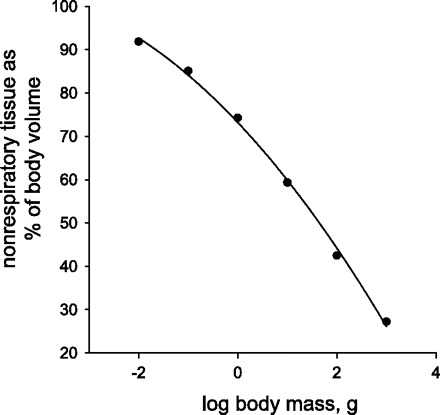
Percentage of nonrespiratory tissue vs. log(M), where M is mass (in grams) for Schistocerca americana, calculated from scaling of tracheal volume with mass as reported by Lease et al. (18). Fraction nonrespiratory tissues = 73.2 − 12.13*log(M) − 1.19*[log(M)]2 (r2 = 0.999).
Within-instar development.
Previous research has documented that insects nearing the molt have difficulty responding to a hypoxic challenge (5, 6). Furthermore, tracheal system volumes decrease near the end of an instar in the grasshopper Locusta migratoria (2). In this study, we tested the hypothesis that the decreased gas exchange capacity and tracheal volume near the end of an instar are due to deflation of air sacs by tissue mass increases. The obvious prediction is that the volume of inflated air sacs would be smaller for insects nearing the molt. However, we detected no difference in inflated air sac volume or degree of deflation or air sac ventilation in the abdominal air sacs we examined (Fig. 7). Since we know that tracheal volumes are negatively correlated with mass in the fifth instar of S. americana (18), our data suggest that other aspects of the tracheal system are compressed at this time. The abdomen expands greatly as the instar proceeds in S. americana (Fig. 9), apparently allowing the abdominal air sacs to retain their sizes and ventilation capacities as the animals grow. It would be very interesting to look for air sac volume changes in other regions of S. americana as grasshoppers grow within an instar. The head and thorax are much more rigid than the abdomen and may be the site of the decrease in tracheal system volume, leading to changes in air flow patterns with age.
Fig. 9.
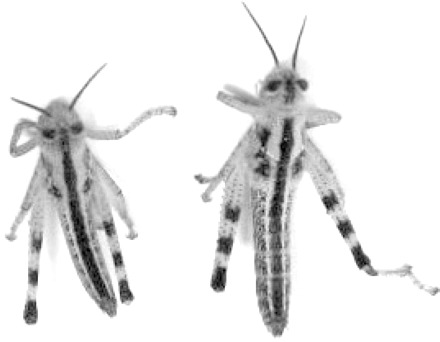
Early-stage (left) and late-stage (right) S. americana in the 5th instar. Note abdominal distension in late-stage animals. (Photo by Charles Kazilek, Arizona State University.)
Perspectives and Significance
In addition to explaining the mechanisms by which larger grasshoppers achieve greater ventilation, our data lend further support to the hypothesis that tracheal hypermetry is associated with greater body sizes in grasshoppers and insects in general, perhaps due to the need for more ventilation to overcome longer diffusion distances. Additionally, increased ventilation may serve primarily to decrease respiratory water loss, which can be greater with diffusive gas exchange (16). Regardless of the ultimate cause, the trend toward increasing investment in tracheae and air sacs could limit the size of extant insects through spatial constraints in specific locations, such as the legs (14), by respiratory structures displacing nonrespiratory tissues in larger insects (Fig. 8) or by secondary biomechanical consequences of body volume expansion. Because the dimensions of the tracheal system correlate negatively with atmospheric O2 level (7), this trend could explain how high atmospheric O2 during the Paleozoic era may have facilitated insect gigantism, inasmuch as insects would be able to grow to larger sizes before reaching spatial or biomechanical constraints.
GRANTS
This research was supported by National Science Foundation Grants IBN-9985857 and IBN 0419704 (to J. F. Harrison) and EPA-U91616501 and EPS-0447679 (to K. J. Greenlee). Use of the Advanced Photon Source at Argonne National Laboratory was supported by the US Department of Energy, Office of Science, Office of Basic Energy Sciences, under Contract DE-AC02-06CH11357. This project was made possible, in part, by NIH Grant 2P20 RR0l5566 from the National Center for Research Resources. Its contents are solely the responsibility of the authors and do not necessarily reflect the views of the NIH.
Supplementary Material
ACKNOWLEDGMENTS
We thank Krystal Pfeiffer for conducting the initial point-counting analyses and Alex Kaiser and Hilary Lease for helpful comments on the manuscript.
REFERENCES
- 1. Chapman RF. The Insects: Structure and Function. Cambridge, UK: Cambridge University Press, 1998. [Google Scholar]
- 2. Clarke KU. On the role of the tracheal system in the post-embryonic growth of Locusta migratoria L. Proc R Entomol Soc Lond A 32: 67–79, 1957. [Google Scholar]
- 3. Gehr P, Mwangi DK, Ammann A, Maloiy GMO, Taylor CR, Weibel ER. Design of the mammalian respiratory system. 5. Scaling morphometric pulmonary diffusing-capacity to body-mass—wild and domestic mammals. Respir Physiol 44: 61–86, 1981. [DOI] [PubMed] [Google Scholar]
- 4. Greenlee KJ, Harrison JF. Development of respiratory function in the American locust, Schistocerca americana. I. Across-instar effects. J Exp Biol 207: 497–508, 2004. [DOI] [PubMed] [Google Scholar]
- 5. Greenlee KJ, Harrison JF. Development of respiratory function in the American locust, Schistocerca americana. II. Within-instar effects. J Exp Biol 207: 509–517, 2004. [DOI] [PubMed] [Google Scholar]
- 6. Greenlee KJ, Harrison JF. Respiratory changes throughout ontogeny in the tobacco hornworm caterpillar, Manduca sexta. J Exp Biol 208: 1385–1392, 2005. [DOI] [PubMed] [Google Scholar]
- 7. Harrison J, Frazier MR, Henry JR, Kaiser A, Klok CJ, Rascon B. Responses of terrestrial insects to hypoxia or hyperoxia. Respir Physiol Neurobiol 154: 1–15, 2006. [DOI] [PubMed] [Google Scholar]
- 8. Harrison JF. Ventilatory mechanism and control in grasshoppers. Am Zool 37: 73–81, 1997. [Google Scholar]
- 9. Harrison JF, Kaiser A, VandenBrooks JM.(Editors). Mysteries of Oxygen and Insect Size. Bologna, Italy: Medimond, 2009,293–302. [Google Scholar]
- 10. Harrison JF, Kennedy MJ. In vivo studies of the acid-base physiology of grasshoppers: the effect of feeding state on acid-base and nitrogen excretion. Physiol Zool 67: 120–141, 1994. [Google Scholar]
- 11. Hartung DK, Kirkton SD, Harrison JF. Ontogeny of tracheal system structure: a light and electron-microscopy study of the metathoracic femur of the American locust, Schistocerca americana. J Morphol 262: 800–812, 2004. [DOI] [PubMed] [Google Scholar]
- 12. Hughes GM. Scaling of respiratory areas in relation to oxygen-consumption of vertebrates. Experientia 40: 519–524, 1984. [DOI] [PubMed] [Google Scholar]
- 13. Hustert R. Neuromuscular coordination and proprioreceptive control of rhythmical abdominal ventilation in intact Locusta migratoria migratorioides. J Comp Physiol 97: 159–179, 1975. [Google Scholar]
- 14. Kaiser A, Klok CJ, Socha JJ, Lee WK, Quinlan MC, Harrison JF. Increase in tracheal investment with beetle size supports hypothesis of oxygen limitation on insect gigantism. Proc Natl Acad Sci USA 104: 13198–13203, 2007. [DOI] [PMC free article] [PubMed] [Google Scholar]
- 15. Kestler P. Cyclic CO2 release as a physiological stress indicator in insects. Comp Biochem Physiol 100C: 207–211, 1991. [Google Scholar]
- 16. Kestler P. Respiration and respiratory water loss. In: Environmental Physiology and Biochemistry of Insects, edited by Hoffmann KH. Berlin: Springer-Verlag, 1985, 296. [Google Scholar]
- 17. Kirkton SD, Niska JA, Harrison JE. Ontogenetic effects on aerobic and anaerobic metabolism during jumping in the American locust, Schistocerca americana. J Exp Biol 208: 3003–3012, 2005. [DOI] [PubMed] [Google Scholar]
- 18. Lease HM, Wolf BO, Harrison JF. Intraspecific variation in tracheal volume in the American locust, Schistocerca americana, measured by a new inert gas method. J Exp Biol 209: 3476–3483, 2006. [DOI] [PubMed] [Google Scholar]
- 19. Miller PL. Respiration-aerial gas transport. In: The Physiology of the Insecta, edited by Rockstein M. New York: Academic, 1964, 557–615. [Google Scholar]
- 20. Miller PL. The supply of oxygen to the active flight muscles of some large beetles. J Exp Biol 45: 285–304, 1966. [DOI] [PubMed] [Google Scholar]
- 21. Prange HD. The scaling and mechanics of arthropod exoskeleton. In: Scale Effects in Animal Locomotion, edited by Pedley TJ. 1977, New York: Academic, 169–183. [Google Scholar]
- 22. Price PW. Insect Ecology New York: Wiley, 1997. [Google Scholar]
- 23. Rascon B, Harrison JF. Oxygen partial pressure effects on metabolic rate and behavior of tethered flying locusts. J Insect Physiol 51: 1193–1199, 2005. [DOI] [PubMed] [Google Scholar]
- 24. Schmitz A, Perry SF. Stereological determination of tracheal volume and diffusing capacity of the tracheal walls in the stick insect Carausius morosus (Phasmatodea, Lonchodidae). Physiol Biochem Zool 72: 205–218, 1999. [DOI] [PubMed] [Google Scholar]
- 25. Socha JJ, Westneat MW, Harrison JF, Waters JS, Lee WK. Real-time phase-contrast x-ray imaging: a new technique for the study of animal form and function. BMC Biol 5: 6, 2007. [DOI] [PMC free article] [PubMed] [Google Scholar]
- 26. Weibel ER. Stereological Methods. London: Academic, 1979. [Google Scholar]
- 27. Weibel ER, Taylor CR, Hoppeler H. The concept of symmorphosis: a testable hypothesis of structure-function relationship. Proc Natl Acad Sci USA 88: 10357–10361, 1991. [DOI] [PMC free article] [PubMed] [Google Scholar]
- 28. Weis-Fogh T. Respiration and tracheal ventilation in locusts and other flying insects. J Exp Biol 47: 561–587, 1967. [DOI] [PubMed] [Google Scholar]
- 29. Westneat MW, Betz O, Blob RW, Fezzaa K, Cooper WJ, Lee WK. Tracheal respiration in insects visualized with synchrotron x-ray imaging. Science 299: 558–560, 2003. [DOI] [PubMed] [Google Scholar]
- 30. Wigglesworth VB. A further function of the air sacs in some insects. Nature 198: 106, 1963. [Google Scholar]
Associated Data
This section collects any data citations, data availability statements, or supplementary materials included in this article.