

Abstract
Patterns of phenotypic variation arise in part from plasticity owing to social interactions, and these patterns contribute, in turn, to the form of selection that shapes the variation we observe in natural populations. This proximate–ultimate dynamic brings genetic variation in social environments to the forefront of evolutionary theory. However, the extent of this variation remains largely unknown. Here, we use a member of the Enchenopa binotata species complex of treehoppers (Hemiptera: Membracidae) to assess how mate preferences are influenced by genetic variation in the social environment. We used full-sibling split-families as ‘treatment’ social environments, and reared focal females alongside each treatment family, describing the mate preferences of the focal females. With this method, we detected substantial genetic variation in social influence on mate preferences. The mate preferences of focal females varied according to the treatment families along with which they grew up. We discuss the evolutionary implications of the presence of such genetic variation in social influence on mate preferences, including potential contributions to the maintenance of genetic variation, the promotion of divergence, and the adaptive evolution of social effects on fitness-related traits.
Keywords: indirect genetic effects, preference functions, vibrational signals, Enchenopa
1. Introduction
Social interactions shape the course of evolution in two main ways. First, through various forms of behavioural and developmental plasticity, social interactions are pervasive causes of variation in phenotypes [1–6]. Second, because of the nature of competition with conspecifics for mates and other resources, social interactions are strong causes of variation in fitness [7–12]. These contributions of social interactions to the evolutionary process share a key feature: in varied ways, the phenotypes of some individuals modify the phenotypes and fitness of other individuals. In such situations, genes expressed in one individual may influence the phenotypes and/or fitness of other individuals; i.e. there may arise indirect genetic effects (IGEs) [13–15].
When social interactions give rise to IGEs, theory predicts important and varied evolutionary consequences [13,14,16,17]. And, because IGEs may arise from many different kinds of interactions, IGEs may be very common in nature [10,17,18]. Nevertheless, empirical work on IGEs has lagged behind theoretical exploration because of the difficulty of the measurements involved, although the available evidence confirms the expectation that IGEs will be taxonomically widespread [19–23]. Here, we report the first measure of IGEs on mate preferences, complex behavioural traits that are sources of strong selection on sexual traits and important causes of reproduction isolation between diverging populations [7–9,12].
We used a method that tests for IGEs according to their formal definition, as instances when the genes expressed by one individual have an effect on the phenotype of other individuals [13,14]. Our goal was to ask whether genetic variation in the social environment shapes the mate preferences of individuals placed in that social environment. We used a novel implementation of a classic quantitative genetics design: we used a sample of full-sibling split-families [24,25] as treatment social environments for randomly collected focal individuals. We described the mate preferences of the focal individuals and estimated variation in the preferences owing to among-treatment family and within-treatment family components. This amounts to measuring the effect of genetic variation in the social environment on the focal individuals.
We tested two hypotheses about the role of social interactions. First, we tested the hypothesis that the social environment influences female mate preferences. This hypothesis predicts that the mate preferences of focal females will differ across various compositions of the social environment. Second, we tested the hypothesis that there is genetic variation in the influence of the social environment on female mate preferences. This hypothesis predicts that the mate preferences of focal females will differ owing to the full-sibling family treatments. In other words, there should be an among-treatment family effect. This result would indicate that the genetic make-up of the full-sibling families is contributing to the differences in the mate preferences of the focal females.
2. Material and methods
(a). General methods
Our study species was a member of the Enchenopa binotata species complex of treehoppers (Hemiptera: Membracidae). These insects communicate with plant-borne vibrational signals, and pair formation occurs through male–female signalling duets [26]. Females exhibit strong mate preferences on the basis of male signals, mainly signal frequency, which is the most divergent adult trait among the members of this species complex [27,28]. Female mate preferences for signal frequency are unimodal (or ‘closed’; i.e. they favour intermediate frequency values), and females from different species in the complex favour different signal frequencies [27,29].
In our study site (Tendick Nature Park, Saukville, WI, USA), there are two species that live on the host plant Viburnum lentago (Caprifoliaceae). These species have not been formally described, but male signal frequency is a reliable trait in determining each species, as well as others in this species complex [28–30]. We used the low-frequency species found on V. lentago (dominant frequency = 185 Hz), and we kept voucher specimens in 95 per cent ethanol.
Our experiment consisted of a social environment manipulation phase and a testing phase. During the social environment phase, we manipulated the social environment in which focal females developed and matured sexually by rearing them with different treatment full-sibling families (i.e. an environment with a describable genetic component). During the testing phase, we described variation in female preferences for the signal frequency of male signals.
(b). Manipulation of the social environment
To manipulate the social environment of the focal female whose mate preferences we aimed to describe, we used a full-sibling split-family (i.e. split-clutch) quantitative genetics design (figure 1; [24,25]). This manipulation mimics natural variation in Enchenopa, where social aggregations consist of varying mixtures of broods developing together [26,31]. These patterns are established as females aggregate during late summer and autumn to lay eggs on the stems of their host plants [26,32]. Females die at the end of the autumn, and the following spring the nymph aggregations develop on the stems on which their eggs were laid [26].
Figure 1.

Experimental design to test if the presence of genetic variation in social neighbours influences the mate preferences of focal individuals reared. A sample of full-sibling families was used as the social genetic component and each family was split onto two replicates to separate social genetic effects from environmental ones. Focal individuals were then added, and we described the mate preferences of these focal individuals.
To create these full-sibling treatment families, we collected mated adult females in August 2010 in the field. We note that Enchenopa females mate only once [31,33]. Consequently, the broods of the females that we collected constitute full-sibling families. We placed each of these field-collected dams on an individually potted plant of V. lentago to allow them to lay eggs in the stem through the autumn. The eggs overwintered in the plants in our outdoors facility. We moved plants into a greenhouse in April 2011 to induce budding and sap flow, which triggers development of Enchenopa embryos [26]. When nymphs eclosed, we transferred them to the experimental rearing plants within a few days. We generated social groups that consisted of full-sibling family members (figure 1). We split each family onto two potted host plant exemplars so that the social genetic effects could be separated from the environmental effects. Each of the two replicates per treatment family was composed of 20 nymphs.
To obtain the focal individuals, we randomly collected egg masses from the same population as the treatment families. We collected egg masses by cutting stems from various host plant individuals spanning a 100 m transect in the field. We placed each stem in a water tube to trigger nymph eclosion, which occurred in late May. We timed this procedure so that focal nymphs were two weeks younger than treatment family nymphs. This manipulation allowed us to introduce an age separation between treatment and focal individuals, permitting us to track them throughout juvenile development. In nature, nymphs developing on any one stem or plant would be closer in age than this, because synchronous eclosion from eggs is prompted by the beginning of sap flow in the spring [26]. This synchrony is not perfect, however, and we have observed a lag of up to 10 days in the greenhouse and in the field (D. Rebar & R. L. Rodríguez 2010, personal observation). Thus, our introduction of an age difference between treatment and focal individuals is artificial, but represents a minor alteration of the natural situation for Enchenopa. Upon adult moult, we painted the pronotum of all treatment individuals.
We placed 20 focal individuals with each replicate of the family treatments. Focal and treatment individuals were reared together on the plant from the time focal individuals were first instars until their adult moult. Enchenopa males become sexually mature and begin to signal approximately two weeks after the adult moult, and females become sexually responsive about two weeks later [26]. We, therefore, removed all treatment individuals when treatment males reached two weeks after the adult moult (as the focal individuals were reaching the adult moult). Focal males remained on the plant for two weeks more. At that point, just focal females remained on each plant. Thus, the social environment phase occurred from when focal females were first instar nymphs through adulthood, and ended approximately two weeks before they became sexually receptive, at which point we described their mate preferences.
(c). Assessing variation in mate preferences
Mate preferences are function-valued traits [34–36]. That means that a female's sexual response is a function of the signals she encounters. We described mate preferences by presenting individual females with a range of male signals and quantifying their responses to create mate preference functions [27,37]. We presented females with these stimuli using vibrational playback experiments. Stimuli spanned the range in male signal frequency for the population, with all other features set to the population mean. Each stimulus consisted of a bout of three signals, which is the mean number of signals per bout in the population. We presented each female with a full complement of stimuli in random sequences, with each stimulus separated from the next by 15 s of silence. We randomized testing across treatments and replicates over the course of the testing phase to control, as best as possible, for the time between the social environment and testing phases. Signals were 2, 4, 6, 8, 10, 15, 20, 30 and 40 Hz different in each direction from the mean (185 Hz), resulting in 19 different playback stimuli being presented to each female. We created and delivered all synthetic stimuli using a custom MATLAB script (v. 7.11, Mathworks, Inc., Natick, MA, USA; available upon request). Stimuli were delivered to the plant stem through a piezo-electric actuator attached with accelerometer wax and controlled by a piezo controller (Thorlabs, NJ, USA, models AE0505D16 and MDT694A, respectively) from an iMac computer at an amplitude of 0.10 mm s−1. We recorded the stimuli and female responses using a laser vibrometer (Polytec, Inc., Auburn, MA, USA, model CLV-2534) connected to an iMac computer and the sound recording software AUDACITY at a sampling rate of 44.1 kHz (v. 1.2.5; http://audacity.soundforge.net). We isolated the setup from noise owing to building vibrations by placing it on shock-absorbing sorbothane (Edmund Scientifics, Tonawanda, NY, USA) on top of an iron plank (approx. 135 kg) resting on partially inflated bicycle inner tubes on top of a slate table (approx. 1 m × 2 m). We placed vibration dampening pads (Polymer Dynamics, Inc., Allentown, PA, USA, model 3291–22-PM-50) under the table legs for further isolation. All females were recorded from July to August 2011.
To assay female response, we took advantage of Enchenopa duetting behaviour. Males produce an advertisement signal, and if a female finds that signal attractive, she responds with her own signal [27,29]. A female's likelihood of responding is strongly correlated to the number of responses she gives to a signalling bout [29,34,35]. Thus, the number of times a female responds is a reliable indicator of male signal attractiveness. We scored the number of female responses to each stimulus from the recordings (0–3 responses).
We first tested the receptivity of each female by playing back a recording of a live male to her. If she responded to this signal, we then presented her with a sequence of the 19 signal models. Females that failed to respond to the recording of a live male were returned to their host plant and tested at a later date. Some females stopped responding during the playback sequence, which can result if a female becomes habituated. Therefore, we replayed the recording of a live male at the very end of the sequence to those females. If a female responded, we considered her still receptive and she was included in the subsequent analyses. Females that failed to respond to this recording at the end were excluded from the analyses. In total, 89 females reached the testing phase of the experiment. Of those, 65 females were receptive to the live male recording, resulting in 41 females that completed the playback sequence (corresponding to n = 7 full-sibling treatment families) being included in the analyses.
(d). Description of female preference functions
We constructed mate preference functions with non-parametric regression by generating cubic splines with a program created by D. Schluter (glms40 cubic spline program; http://www.zoology.ubc.ca/~schluter/wordpress/software/). Cubic splines make no assumption about the shape of the preference other than it is smooth. We used the GCV statistic provided by the glms40 program to choose the smoothing value lambda for each individual preference function. In three instances, we manually adjusted the lambda value to increase smoothness because these splines contained sharp angles between data points. This adjustment did not qualitatively change our results. We calculated the splines for each female using 1000 bootstraps to generate confidence intervals for each spline.
We described variation in female mate preferences in terms of peak preference and preference selectivity. Peak preference is the signal frequency that elicits the greatest response from a female. Preference selectivity describes how strongly a female disfavours signals as they deviate from her peak preference [34,38]. Following established methods, preference selectivity was a composite derived from measurements of three aspects of the shape of the mate preference functions: responsiveness, tolerance and strength [34,35]. Responsiveness describes the overall elevation of the curves and was calculated as the mean of an individual's responses. Tolerance describes the shape of the curves as they fall away from peak preference, measured as the width of the preference function at two-thirds the height of the peak preference. Strength describes the steepness of the curve's descent from peak preference, measured as the square of the coefficient of variation [34,35,38]. These three measurements are strongly correlated, so we performed a principal component analysis to generate the composite trait we term preference selectivity. This first principal component, which we used in our analysis, had an eigenvalue of 2.37 that explained 79.10 per cent of the variance, with responsiveness, tolerance and strength loading similarly on this axis (0.58, 0.58 and −0.57, respectively).
(e). Statistical analysis
We adopted a function-valued approach to describe variation in the female preferences [34–36]. This approach uses the entire preference function as the trait of interest; thus, each female contributes one preference function to the analysis. We performed a linear mixed effects analysis to address differences in the shape of preference functions. Family, replicate nested within family, and focal individual nested within replicate and family were random effects. The model included linear and quadratic terms for stimulus frequency and for their interaction with family. The family term describes differences in the overall responsiveness or mean elevation of the preference functions [34,38]. The family × quadratic stimulus frequency interaction describes differences in the shape of the preference functions. Therefore, this interaction term was of particular interest to us.
The significant family × quadratic stimulus frequency interaction (see below) prompted us to explore how the preference functions of focal females varied among treatment families. We used peak preference and preference selectivity as response variables in a linear mixed model with family and replicate as random effects and replicate nested within family. We performed all statistical analyses in JMP v. 7.0 (SAS Institute Inc., Cary, NC, USA).
3. Results
(a). Social influence on mate preference functions
The social environment influenced Enchenopa mate preferences, and there was genetic variation in this social influence. The preference functions of focal females varied among and within treatment full-sibling families (figures 2 and 3). The significant effect of treatment family (table 1) indicates genetic variation in social influence on mean responsiveness of focal females; and the significant family × quadratic stimulus frequency interaction indicates genetic variation in social influence on the shape of the preference functions (figure 2 and table 1). There were no significant within-treatment family (i.e. replicate) differences in preference functions. Visual inspection of the preference functions indicates social influence on among-treatment family variation in the peak and overall shape of the preferences (figure 2).
Figure 2.

Genetic variation in social influence on the mate preference functions of Enchenopa focal females. The preference functions of the two replicates of focal females that developed with seven full-sibling treatment families are shown. The dotted line represents the mean peak preference in the population.
Figure 3.

Example of individual preference functions of focal females from two replicates of two representative full-sibling treatment families. The dotted line represents the mean peak preference of all females tested.
Table 1.
Linear mixed-model testing for differences in the shape of the preference functions of focal females. Family, replicate and individual are random terms, with replicate nested within family and individual nested within replicate and family. The family × quadratic term tests for genetic variation in social influence on the mate preference functions (see §2). Significant values are in italics.
| source of variation | d.f. | F | p |
|---|---|---|---|
| whole model | 54, 724 | 38.46 | <0.0001 |
| family | 6, 7.62 | 5.11 | 0.0212 |
| replicate (family) | 7, 27 | 0.67 | 0.6968 |
| linear | 1, 724 | 32.51 | <0.0001 |
| family × linear | 6, 729.99 | 9.64 | <0.0001 |
| quadratic | 1, 6.25 | 113.74 | <0.0001 |
| family × quadratic | 6, 724 | 6.17 | <0.0001 |
| individual (replicate, family) | 27, 724 | 26.27 | <0.0001 |
(b). Social influence on peak preference and on preference selectivity
The social environment influenced both traits describing the shape of Enchenopa mate preferences. Specifically, we found substantial and significant genetic variation in social influence on peak preference and on preference selectivity (figure 4 and table 2).
Figure 4.
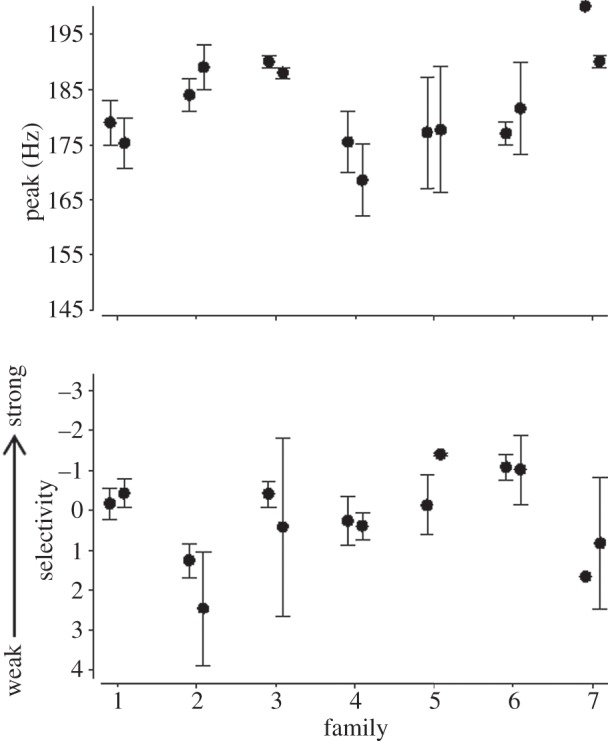
Genetic variation in social influence on two traits describing the mate preference functions of Enchenopa focal females. The y-axis for the traits represents the phenotypic range observed in this study for each trait. Mean ± s.e. are displayed for both replicates of focal females reared in each family.
Table 2.
Linear mixed models of social influence on peak preference and on preference selectivity with family and replicate as random terms with replicate nested within family. Significant values are in italics.
| trait | factor | d.f. | F | p |
|---|---|---|---|---|
| peak preference | family | 6, 8.44 | 7.85 | 0.0044 |
| replicate | 7, 27 | 0.15 | 0.993 | |
| preference selectivity | family | 6, 7.41 | 5.12 | 0.0223 |
| replicate | 7, 27 | 0.51 | 0.8192 |
4. Discussion
Here, we demonstrate that the social environment influences mate preferences and that there is a substantial genetic component of variation in this social influence. Importantly, by using a split-family design for the treatment families and rearing randomized, unrelated focal individuals with them, we are able to disentangle whether the effects are due to among-family differences or additional environmental effects. We demonstrate that these effects are due to family differences and that the within-family component of variation was minimal, indicating the presence of consistent among-family variation in their social influence on mate preferences. Moreover, we show that two traits describing these mate preference functions, peak preference and preference selectivity, are influenced by their social neighbours. Of note is our detection of IGEs on peak preference, whereas previous studies addressing plasticity owing to social experience during adulthood have not resulted in shifts of peak preference [34,35].
IGEs on mate preferences may influence the course of sexual selection in various ways. First, the presence of IGEs may help maintain genetic variation under selection [39]. Because the mate preferences of females shifted according to the genetic make-up of their social neighbours, the relative attractiveness of different males to females may vary according to the social environment. Thus, any one female genotype may favour different male phenotypes (and genotypes) according to variation in the social environment, thereby promoting the maintenance of genetic variation in male mating signals. In addition, recent work in Enchenopa has demonstrated direct genetic variation in mate preferences [40], social influence on mate preferences [34,35,40] and genetic variation in this influence [this study]. In concert with previous theoretical and empirical work highlighting genetic components of variation in both sides of social interactions [14,20,23,41], genetic variation within populations may be sustained by the interplay between how plastic individuals are due to social interactions and how much influence social neighbours can exert on individual plasticity.
Second, the presence of IGEs on mate preferences may impact a population's potential to respond to selection [41,42]. Recall that the social environment is both a determinant of reproductive success [8,10,14] and a cause of phenotypic plasticity in traits such as mate preferences [1–6]. This double-role of the social environment can generate feedback loops between the causes of variation in phenotypes and the causes of selection on phenotypes. That is to say, the patterns of phenotypic variation arising from the influence of the social environment are themselves sources of selection that influence the subsequent patterns of phenotypic variation of other individuals [15,16,43].
Third, our demonstration of IGEs on mate preferences suggests that the composition of social neighbours can influence the rate and direction of evolutionary change. For example, variance in the social environment can promote divergent sexual selection pressures because of how mate preferences shift across these social environments [17]. These shifted female mate preferences alter how selection acts on variation in male signals, resulting in new patterns of variation in phenotypes. As a result, IGEs on mate preferences may subsequently increase the rate of trait elaboration in a particular direction and could promote Fisherian runaway processes on the basis of the IGE components of variation [17]. Furthermore, one social environment may promote preferences one way and another social environment in the other direction. Gene flow between the social groups may be restricted, and divergence between them promoted.
Finally, an important potential consequence of IGEs is that both sides of the social environment dynamic, social plasticity and influences on the plastic response to social environments, may evolve: selection may shape not only how phenotypes adjust to social environments [34,35,44], but also how individual and social phenotypes influence other individuals' phenotypes. That is to say, with genetic variation in social influence on fitness-related traits such as mate preferences, selection may have the ability to shape the extent and form to which individuals exert influence on their neighbours' phenotypes. Whether this actually occurs in nature remains to be examined with theoretical and empirical work, but the potential for it to occur adds an interesting dimension to the nature of the competitive dynamics that may arise in social and sexual selection.
In short, social interactions influence the shape of mate preferences, and there can be substantial components of genetic variation to this influence. Such IGEs on mate preferences can have a broad range of evolutionary consequences, from promoting the maintenance of genetic variation to accelerating evolutionary divergence. Exploration of the patterns that IGEs take in nature will help elucidate their evolutionary consequences. For example, which aspects of social interactions are responsible for the variation that is generated in, say, mate preferences? We find that, for Enchenopa females, experimental manipulation of social groupings has stronger effects than manipulation in the experience of signals alone ([32,33], this study). What is the cause of these differences? Much can be learned from further exploring the patterns of variation that arise from these social interactions.
Data deposited in the Dryad Repository: http://dx.doi.org/10.5061/dryad.nm021.
Acknowledgements
We thank T. Schuck for help with plant care, and A. Hallett and M. Al-Wathiqui for help with playbacks. We also thank F. A. Barbosa, P. O. Dunn, K. D. Fowler-Finn, G. Höbel, J. Kilmer, D. Kim, L. A. Whittingham and two anonymous reviewers for helpful feedback on the manuscript. R. B. Cocroft kindly provided the MATLAB script. This research was funded by NSF grants IOS-0919962 to R.L.R. and IOS-1120790 to R.L.R. and K. D. Fowler-Finn; and by the Society for the Study of Evolution Rosemary Grant Award, UWM Ruth Walker and James D. Anthony awards, and a UWM Distinguished Graduate Student Fellowship to D.R.
References
- 1.Greenfield MD. 2002. Signalers and receivers: mechanisms and evolution of arthropod communication. New York, NY: Oxford University Press. [Google Scholar]
- 2.Danchin É, Giraldeau L-A, Valone TJ, Wagner RH. 2004. Public information: from nosy neighbors to cultural evolution. Science 305, 487–491. 10.1126/science.1098254 (doi:10.1126/science.1098254) [DOI] [PubMed] [Google Scholar]
- 3.West-Eberhard MJ. 2003. Developmental plasticity and evolution. New York, NY: Oxford University Press. [Google Scholar]
- 4.Hebets EA, Sullivan-Beckers L. 2010. Mate choice and learning. In Encyclopedia of animal behavior (eds Breed MD, Moore J.), pp. 389–393. Amsterdam, The Netherlands: Elsevier B. V. [Google Scholar]
- 5.Verzijden MN, Ten Cate C, Servedio MR, Kozak GM, Boughman JW, Svensson EI. 2012. The impact of learning on sexual selection and speciation. Trends Ecol. Evol. 27, 511–519. 10.1016/j.tree.2012.05.007 (doi:10.1016/j.tree.2012.05.007) [DOI] [PubMed] [Google Scholar]
- 6.Rodríguez RL, Rebar D, Fowler-Finn KD. 2013. The evolution and evolutionary consequences of social plasticity in mate preferences. Anim. Behav. 85, 1041–1047. 10.1016/j.anbehav.2013.01.006 (doi:10.1016/j.anbehav.2013.01.006) [DOI] [Google Scholar]
- 7.Darwin C. 1871. The descent of man and selection in relation to sex. London, UK: John Murray. [Google Scholar]
- 8.West-Eberhard MJ. 1983. Sexual selection, social competition, and speciation. Q. Rev. Biol. 58, 155–183. 10.1086/413215 (doi:10.1086/413215) [DOI] [Google Scholar]
- 9.Andersson MB. 1994. Sexual selection. Princeton, NJ: Princeton University Press. [Google Scholar]
- 10.Lyon BE, Montgomerie R. 2012. Sexual selection is a form of social selection. Phil. Trans. R. Soc. B 367, 2266–2273. 10.1098/rstb.2012.0012 (doi:10.1098/rstb.2012.0012) [DOI] [PMC free article] [PubMed] [Google Scholar]
- 11.Siepielski AM, DiBattista JD, Evans JA, Carlson SM. 2011. Differences in the temporal dynamics of phenotypic selection among fitness components in the wild. Proc. R. Soc. B 278, 1572–1580. 10.1098/rspb.2010.1973 (doi:10.1098/rspb.2010.1973) [DOI] [PMC free article] [PubMed] [Google Scholar]
- 12.Coyne JA, Orr HA. 2004. Speciation. Sunderland, MA: Sinauer Associates. [Google Scholar]
- 13.Moore AJ, Brodie ED, III, Wolf JB. 1997. Interacting phenotypes and the evolutionary process. I. Direct and indirect genetic effects of social interactions. Evolution 51, 1352–1362. 10.2307/2411187 (doi:10.2307/2411187) [DOI] [PubMed] [Google Scholar]
- 14.Wolf JB, Brodie ED, III, Cheverud JM, Moore AJ, Wade MJ. 1998. Evolutionary consequences of indirect genetic effects. Trends Ecol. Evol. 13, 64–69. 10.1016/S0169-5347(97)01233-0 (doi:10.1016/S0169-5347(97)01233-0) [DOI] [PubMed] [Google Scholar]
- 15.Wolf JB, Brodie ED, III, Moore AJ. 1999. Interacting phenotypes and the evolutionary process. II. Selection resulting from social interactions. Am. Nat. 153, 254–266. 10.1086/303168 (doi:10.1086/303168) [DOI] [PubMed] [Google Scholar]
- 16.McGlothlin JW, Moore AJ, Wolf JB, Brodie ED., III 2010. Interacting phenotypes and the evolutionary process. III. Social evolution. Evolution 64, 2558–2574. 10.1111/j.1558-5646.2010.01012.x (doi:10.1111/j.1558-5646.2010.01012.x) [DOI] [PubMed] [Google Scholar]
- 17.Bailey NW, Moore AJ. 2012. Runaway sexual selection without genetic correlations: social environments and flexible mate choice initiate and enhance the Fisher process. Evolution 66, 2674–2684. 10.1111/j.1558-5646.2012.01647.x (doi:10.1111/j.1558-5646.2012.01647.x) [DOI] [PMC free article] [PubMed] [Google Scholar]
- 18.Bleakley BH, Wolf JB, Moore AJ. 2010. Evolutionary quantitative genetics of social behaviour. In Social behaviour: genes, ecology and evolution (eds Székely T, Komdeur J, Moore AJ.), pp. 29–54. Cambridge, UK: Cambridge University Press. [Google Scholar]
- 19.Agrawal AF, Brodie ED, III, Brown J. 2001. Parent–offspring coadaptation and the dual genetic control of maternal care. Science 292, 1710–1712. 10.1126/science.1059910 (doi:10.1126/science.1059910) [DOI] [PubMed] [Google Scholar]
- 20.Kent C, Azanchi R, Smith B, Formosa A, Levine JD. 2008. Social context influences chemical communication in D. melanogaster males. Curr. Biol. 18, 1384–1389. 10.1016/j.cub.2008.07.088 (doi:10.1016/j.cub.2008.07.088) [DOI] [PubMed] [Google Scholar]
- 21.Bleakley BH, Brodie ED., III 2009. Indirect genetic effects influence antipredator behavior in guppies: estimates of the coefficient of interaction psi and the inheritance of reciprocity. Evolution 63, 1796–1806. 10.1111/j.1558-5646.2009.00672.x (doi:10.1111/j.1558-5646.2009.00672.x) [DOI] [PubMed] [Google Scholar]
- 22.Danielson-François AM, Zhou Y, Greenfield MD. 2009. Indirect genetic effects and the lek paradox: inter-genotypic competition may strengthen genotype x environment interactions and conserve genetic variance. Genetica 136, 27–36. 10.1007/s10709-008-9297-z (doi:10.1007/s10709-008-9297-z) [DOI] [PubMed] [Google Scholar]
- 23.Biscarini F, Bovenhuis H, van der Poel J, Rodenburg T, Jungerius A, van Arendonk J. 2010. Across-line SNP association study for direct and associative effects on feather damage in laying hens. Behav. Genet. 40, 715–727. 10.1007/s10519-010-9370-0 (doi:10.1007/s10519-010-9370-0) [DOI] [PubMed] [Google Scholar]
- 24.Roff DA. 1997. Evolutionary quantitative genetics. New York, NY: Chapman & Hall. [Google Scholar]
- 25.Lynch M, Walsh B. 1998. Genetics and analysis of quantitative traits. Sunderland, MA: Sinauer Associates. [Google Scholar]
- 26.Cocroft RB, Rodríguez RL, Hunt RE. 2008. Host shifts, the evolution of communication and speciation in the Enchenopa binotata species complex of treehoppers. In Specialization, speciation and radiation: the evolutionary biology of herbivorous insects (ed. Tilmon KJ.), pp. 88–100. Berkeley, CA: University of California Press. [Google Scholar]
- 27.Rodríguez RL, Ramaswamy K, Cocroft RB. 2006. Evidence that female preferences have shaped signal evolution in a clade of specialized plant-feeding insects. Proc. R. Soc. B 273, 2585–2593. 10.1098/rspb.2006.3635 (doi:10.1098/rspb.2006.3635) [DOI] [PMC free article] [PubMed] [Google Scholar]
- 28.Cocroft RB, Rodríguez RL, Hunt RE. 2010. Host shifts and signal divergence: mating signals covary with host use in a complex of specialized plant-feeding insects. Biol. J. Linn. Soc. 99, 60–72. 10.1111/j.1095-8312.2009.01345.x (doi:10.1111/j.1095-8312.2009.01345.x) [DOI] [Google Scholar]
- 29.Rodríguez RL, Sullivan LM, Cocroft RB. 2004. Vibrational communication and reproductive isolation in the Enchenopa binotata species complex of treehoppers (Hemiptera: Membracidae). Evolution 58, 571–578. [PubMed] [Google Scholar]
- 30.Hamilton K, Cocroft RB. 2009. Establishing the identity of existing names in the North American Enchenopa binotata species complex of treehoppers (Hemiptera: Membracidae). Entomol. News 120, 554–565. 10.3157/021.120.0513 (doi:10.3157/021.120.0513) [DOI] [Google Scholar]
- 31.Wood TK. 1993. Speciation of the Enchenopa binotata complex (Insecta: Homoptera: Membracidae). In Evolutionary patterns and processes (eds Lees DR, Edwards D.), pp. 299–317. New York, NY: Academic Press. [Google Scholar]
- 32.Wood TK. 1993. Diversity in the New World Membracidae. Ann. Rev. Entomol. 38, 409–435. 10.1146/annurev.en.38.010193.002205 (doi:10.1146/annurev.en.38.010193.002205) [DOI] [Google Scholar]
- 33.Sullivan-Beckers L, Cocroft RB. 2010. The importance of female choice, male–male competition, and signal transmission as causes of selection on male mating signals. Evolution 64, 3158–3171. 10.1111/j.1558-5646.2010.01073.x (doi:10.1111/j.1558-5646.2010.01073.x) [DOI] [PubMed] [Google Scholar]
- 34.Fowler-Finn KD, Rodríguez RL. 2012. Experience-mediated plasticity in mate preferences: mating assurance in a variable environment. Evolution 66, 459–468. 10.1111/j.1558-5646.2011.01446.x (doi:10.1111/j.1558-5646.2011.01446.x) [DOI] [PubMed] [Google Scholar]
- 35.Fowler-Finn KD, Rodríguez RL. 2012. The evolution of experience-mediated plasticity in mate preferences. J. Evol. Biol. 25, 1855–1863. 10.1111/j.1420-9101.2012.02573.x (doi:10.1111/j.1420-9101.2012.02573.x) [DOI] [PubMed] [Google Scholar]
- 36.Stinchcombe JR, Group F-VTW, Kirkpatrick M. 2012. Genetics and evolution of function-valued traits: understanding environmentally responsive phenotypes. Trends Ecol. Evol. 27, 637–647. 10.1016/j.tree.2012.07.002 (doi:10.1016/j.tree.2012.07.002) [DOI] [PubMed] [Google Scholar]
- 37.Ritchie MG. 1996. The shape of female mating preferences. Proc. Natl Acad. Sci. USA 93, 14 628–14 631. 10.1073/pnas.93.25.14628 (doi:10.1073/pnas.93.25.14628) [DOI] [PMC free article] [PubMed] [Google Scholar]
- 38.Bailey NW. 2008. Love will tear you apart: different components of female choice exert contrasting selection pressures on male field crickets. Behav. Ecol. 19, 960–966. 10.1093/beheco/arn054 (doi:10.1093/beheco/arn054) [DOI] [Google Scholar]
- 39.Miller CW, Moore AJ. 2007. A potential resolution to the lek paradox through indirect genetic effects. Proc. R. Soc. B 274, 1279–1286. 10.1098/rspb.2006.0413 (doi:10.1098/rspb.2006.0413) [DOI] [PMC free article] [PubMed] [Google Scholar]
- 40.Rodríguez RL, Hallett AC, Kilmer JT, Fowler-Finn KD. 2013. Curves as traits: genetic and environmental variation in mate preference functions. J. Evol. Biol. 26, 434–442. 10.1111/jeb.12061 (doi:10.1111/jeb.12061) [DOI] [PubMed] [Google Scholar]
- 41.Bijma P, Muir WM, Van Arendonk JAM. 2007. Multilevel selection 1: quantitative genetics of inheritance and response to selection. Genetics 175, 277–288. 10.1534/genetics.106.062711 (doi:10.1534/genetics.106.062711) [DOI] [PMC free article] [PubMed] [Google Scholar]
- 42.Kazancioğlu E, Klug H, Alonzo SH. 2012. The evolution of social interactions changes predictions about interacting phenotypes. Evolution 66, 2056–2064. 10.1111/j.1558-5646.2012.01585.x (doi:10.1111/j.1558-5646.2012.01585.x) [DOI] [PubMed] [Google Scholar]
- 43.Formica VA, McGlothlin JW, Wood CW, Augat ME, Butterfield RE, Barnard ME, Brodie ED., III 2011. Phenotypic assortment mediates the effect of social selection in a wild beetle population. Evolution 65, 2771–2781. 10.1111/j.1558-5646.2011.01340.x (doi:10.1111/j.1558-5646.2011.01340.x) [DOI] [PubMed] [Google Scholar]
- 44.Qvarnström A. 2001. Context-dependent genetic benefits from mate choice. Trends Ecol. Evol. 16, 5–7. 10.1016/S0169-5347(00)02030-9 (doi:10.1016/S0169-5347(00)02030-9) [DOI] [PubMed] [Google Scholar]