

Abstract
Ghrelin is a gastric peptide hormone that controls appetite and energy homeostasis. Plasma ghrelin levels rise before a meal and fall quickly thereafter. Elucidation of the regulation of ghrelin secretion has been hampered by the difficulty of directly interrogating ghrelin cells diffusely scattered within the complex gastric mucosa. Therefore, we generated transgenic mice with ghrelin cell expression of green fluorescent protein (GFP) to enable characterization of ghrelin secretion in a pure population of isolated gastric ghrelin-expressing GFP (Ghr-GFP) cells. Using quantitative RT-PCR and immunofluorescence staining, we detected a high level of expression of the long-chain fatty acid (LCFA) receptor GPR120, while the other LCFA receptor, GPR40, was undetectable. In short-term-cultured pure Ghr-GFP cells, the LCFAs docosadienoic acid, linolenic acid, and palmitoleic acid significantly suppressed ghrelin secretion. The physiological mechanism of LCFA inhibition on ghrelin secretion was studied in mice. Serum ghrelin levels were transiently suppressed after gastric gavage of LCFA-rich lipid in mice with pylorus ligation, indicating that the ghrelin cell may directly sense increased gastric LCFA derived from ingested intraluminal lipids. Meal-induced increase in gastric mucosal LCFA was assessed by measuring the transcripts of markers for tissue uptake of LCFA, lipoprotein lipase (LPL), fatty acid translocase (CD36), glycosylphosphatidylinositol-anchored HDL-binding protein 1, and nuclear fatty acid receptor peroxisome proliferator-activated receptor-γ. Quantitative RT-PCR studies indicate significantly increased mRNA levels of lipoprotein lipase, glycosylphosphatidylinositol-anchored HDL-binding protein 1, and peroxisome proliferator-activated receptor-γ in postprandial gastric mucosa. These results suggest that meal-related increases in gastric mucosal LCFA interact with GPR120 on ghrelin cells to inhibit ghrelin secretion.
Keywords: appetite, metabolism, hormone, regulation
ghrelin is an acylated 28-amino acid peptide hormone secreted primarily from gastric endocrine cells (6, 24). Ghrelin administration to humans and rodents induces acute food-seeking/intake behaviors and chronic adiposity (39, 43). Deletion of ghrelin and/or ghrelin receptor genes protects mice from diet-induced obesity (32, 42, 46) and improves the diabetic phenotype of ob/ob mice (37). While the function of ghrelin has been intensively investigated, its physiological function remains unknown. Similarly, little is known about the regulation of ghrelin secretion. Understanding of ghrelin regulation has been hampered in part by the difficulty of directly interrogating ghrelin cells, which are diffusely scattered within the complex gastric mucosa.
More than 80% of circulating ghrelin is produced from gastric oxyntic mucosa (6). Gastric ghrelin-secreting cells appear as a closed-type endocrine cell but lie within close proximity to the gastric lumen (6, 24). Plasma ghrelin levels rise before a meal and fall quickly thereafter (5, 28), suggesting that a meal or nutrients play an important role in regulating ghrelin secretion. The effect of nutrient sensing (30, 40) and hormonal and neuronal regulation (16, 21, 25–27, 40, 41) on ghrelin secretion has been extensively evaluated with largely inconsistent results. This is due to varying study designs and the inability to distinguish direct from indirect effects on ghrelin secretion in a complex neurohormonal system. Most recently, two ghrelin cell lines derived from transgenic mice with SV40 large T-antigen-induced ghrelinoma were reported. Both cell lines produced measurable levels of acylated ghrelin after addition of octanoate, an eight-carbon saturated fatty acid, to the culture medium (18, 45). One group reported that administration of insulin (Ins) and somatostatin (Sst) to the culture medium suppressed ghrelin secretion. In addition, Ins (but not Sst) decreased the ghrelinoma cell mRNA levels of ghrelin and ghrelin O-acyltransferase, a specific enzyme for acylation of ghrelin on serine-3 (14, 18, 44), whereas oxytocin, dopamine, and adrenergic agonists stimulated ghrelin secretion (17). The stimulatory effect of adrenergic agonists on ghrelin secretion, not the inhibitory effects of Ins and Sst, were confirmed on the other ghrelinoma cell line and fasted mice (45).
These inconsistencies between the two ghrelinoma cell lines indicate that the transformed ghrelinoma cells may not fully represent the characteristics of native gastric ghrelin cells. To overcome this limitation and understand the mechanisms directly modulating ghrelin secretion, we generated transgenic mice in which green fluorescent protein (GFP) was expressed in gastric ghrelin cells. Using fluorescence-associated cell sorting (FACS), we isolated a pure population of ghrelin-expressing GFP (Ghr-GFP) cells that were characterized for cell surface receptor expression and ligand-regulated ghrelin secretion in primary cell culture. We found that the long-chain fatty acid (LCFA) receptor GPR120 was highly expressed in gastric Ghr-GFP cells and LCFA inhibited ghrelin secretion from cultured pure primary Ghr-GFP cells. The physiological relevance of LCFA inhibition on ghrelin secretion was further investigated in animal studies which suggest that gastric mucosal exposure to LCFA from the lumen and uptake from the circulation inhibit ghrelin secretion. Taken together, these results suggest that meal-related increases in gastric mucosal LCFAs directly inhibit ghrelin cell secretion through GPR120.
MATERIALS AND METHODS
Materials
DMEM with 4.5 g/l d-glucose, l-glutamine, and 110 mg/l sodium pyruvate, phenol red-free DMEM, and FBS were obtained from GIBCO (Carlsbad, CA); Dulbecco's PBS (DPBS) and HBSS from Mediatech (Herndon, VA); 16% paraformaldehyde (PFA) and Tissue-Tek OCT compound from Electrical Microscopy Sciences (Hatfield, PA); TRIzol from Invitrogen (Carlsbad, CA); rat tail collagen type I from BD Bioscience (Bedford, MA); Spectra/Mesh nylon filters from Spectrum Laboratories (Miami, FL); docosadienoic acid, linolenic acid (LLA), palmitoleic acid, methyl linolenate, dodecanoic acid, valeric acid (VLA), butyric acid (BTA), leptin (Lep), glucagon (Gcg), and Ins from Sigma (St. Louis, MO); and Sst, oxyntomodulin/glucagon 37 (Oxyn), Gcg-like peptide 1-(7–36) (GLP), glucose-dependent insulinotropic polypeptide (GIP), octreotide (Oct), and growth hormone (GH) from American Peptide (Sunnyvale, CA).
Ghrelin-GFP Transgene Construction
The vector for constructing ghrelin-GFP transgene was pEGFP-1 (Clontech). To overcome potential positional effects, a 250-bp insulator from the chicken β-globin locus was introduced into the transgene construct (4). Two copies of chicken β-globin insulator were amplified by PCR from the vector containing β-globin insulator (kindly provided by Suming Huang and Gary Felsenfield, Physical Chemistry Section, National Institute of Diabetes and Digestive and Kidney Diseases) and inserted into the plasmid pEGFP-1 at the 5′ and 3′ ends of the enhanced GFP gene between XhoI and SalI and between AflI and AflI, respectively. A second XhoI site was introduced at the end of the 3′ insulator. This new vector was referred to as pInsulator-GFP (Fig. 1A). Early studies demonstrated that up to 5 kbp of the 5′-flanking region of the human ghrelin gene from the translational start site contains the necessary regulatory sequences (22). A mouse genomic DNA sequence from −5543 to +18 bp of the ghrelin gene translation start site was amplified by PCR. Primers used for the PCR amplification were Ghre5′Kpn1-s and Ghre3'Sma1-anti (5′-CATAGGTACCTGCACCAAGTGCAC and 5′-GTCCCGGGTGCCTGAAGACAGCATGGTC, respectively). This 5,561-bp PCR amplicon was inserted into the vector pInsulator-GFP in frame with the GFP sequence between the KpnI and SmaI sites to generate the transgene construct Pghrelin-GFP (Fig. 1B). The sequence of Pghrelin-GFP was verified by DNA sequencing. GFP expression was tested by subcloning the ghrelin-GFP transgene into pcDNA 3.1(+) plasmid (Invitrogen) and in vitro transfection in HEK-293 cells. The final 7.6-kbp transgene (Fig. 1), including the flanking insulator sequences, was excised with the enzyme XhoI and used for pronuclear injection.
Fig. 1.
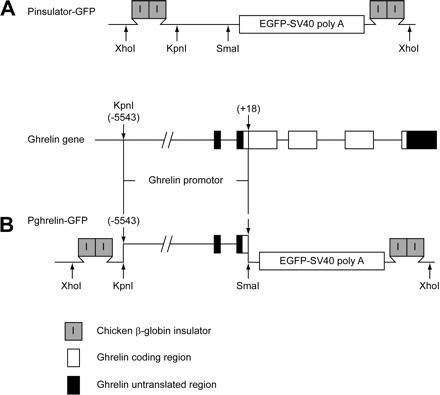
Schematic illustrations of ghrelin-green fluorescent protein (GFP) transgene construct. A: construct of pInsulator-GFP. Two copies of β-globin insulator were inserted at 5′ and 3′ sides of the coding sequence for enhanced GFP (EGFP) and SV40 poly(A) sequences. B: final construct of ghrelin-GFP transgene, Pghrelin-GFP. Mouse ghrelin gene sequence −5543 to +18 bp upstream of the translational start site was amplified by PCR and then inserted in frame with the GFP gene sequences between restriction enzyme KpnI and SmaI sites.
Experimental Animals
Mice were housed and maintained on a regular rat chow diet in compliance with National Institutes of Health Guidelines, and animal protocols were approved by the Animal Care and Use Committee of the National Institute of Diabetes and Digestive and Kidney Diseases.
Isolation of Gastric Glands
Mouse stomach tissue was dissected from the ghrelin-GFP transgenic mice, opened along the lesser curvature, cleaned with cold DPBS, and incubated in DPBS with 30 mM EDTA for 30 min at 37°C with constant shaking (100 rpm). The stomach tissue was subsequently transferred to a new container with fresh DPBS and shaken vigorously by hand. Single and multiple gastric glands were dissociated from underlying tissue. The glands were briefly precipitated by centrifugation and fixed with 4% PFA overnight. On the following day, the gastric glands were precipitated and mounted on glass slides and viewed under a Zeiss LSM 510 Meta confocal microscope.
Immunofluorescence in Gastric Tissue Sections
Mice were euthanized by CO2 inhalation and perfused with 20 ml of DPBS followed by 30 ml of 4% PFA in DPBS via cardiac perfusion. The whole stomach and 1 cm of proximal duodenum were dissected, cleaned with DPBS, fixed in 4% PFA (3 h to overnight) and incubated in 30% sucrose solution (24 h). Tissues were embedded in Tissue-Tek OCT compound and frozen on dry ice. Cryostat tissue sections (7–9 μm) on positive-charged glass slides were air-dried and stored at 4°C. For immunofluorescence staining, slides were fixed in 4% PFA for 30 min at room temperature, permeabilized in 0.2% Triton X-100 in DPBS for 5 min at room temperature, blocked in 5% FBS and 1% BSA in DPBS for 60 min at room temperature, incubated with primary antiserum for 60 min at room temperature or overnight at 4°C, and detected following incubation with Alexa Fluor-conjugated secondary antiserum for 60 min at room temperature.
Immunofluorescence in Dispersed and Isolated Gastric Cells
Cells dispersed from gastric tissue or collected from FACS were washed once in DPBS, fixed in 4% PFA for 30 min at room temperature, washed once in DPBS, seeded on a positive-charged glass slide (5 μl per slide), and air-dried for 30 min at room temperature. The dried cells were fixed again in 4% PFA for 10 min at room temperature, permeabilized in 0.1% Triton X-100 for 5 s at room temperature, blocked in 1% BSA and 5% FBS in DPBS for 30 min at room temperature, incubated with primary antibody for 60 min at room temperature or overnight at 4°C, and detected following incubation with Alexa Fluor-conjugated secondary antibody for 60 min at room temperature.
Antibodies
Primary antibody working dilution and source were as follows: rabbit anti-acylated ghrelin (1:500 dilution; Yuxiang Sun, Baylor College of Medicine, Houston, TX); rabbit anti-histidine decarboxylase (HDC, 1:1,000 dilution; Alpco, Salem, NH), rabbit anti-Sst and rabbit anti-serotonin (1:100 dilution; Invitrogen), goat anti-Sst (1:1,000 dilution; Santa Cruz Biotechnology, Santa Cruz, CA), rabbit anti-GFP (1:1,000; Abcam, Cambridge, MA), and rabbit anti-GPR120 (1:2,000–8,000 dilution; catalog no. LS-A2004, Lifespan Biosciences, Seattle, WA). Secondary antibody working dilution and source were as follows: Alexa Fluor 594 goat anti-rat IgG specific for heavy and light chains (H+L), Alexa Fluor 488 chicken anti-goat IgG (H+L), Alexa Fluor 594 donkey anti-goat IgG (H+L), and Alexa Fluor 633 donkey anti-goat IgG (H+L) (1:1,000 dilution; Invitrogen).
Isolation of Ghr-GFP Cells
Ghrelin-GFP transgenic mice were euthanized by CO2 inhalation and flushed with 20 ml of DPBS via cardiac perfusion. The stomach body was dissected, cut open along the lesser curvature, and washed with cold DPBS. Food residues were gently scraped from the surface of the mucosa. Stomach tissues were incubated in 10 ml of DMEM with 2 mg/ml Pronase at 37°C with constant shaking (100 rpm) for 1 h, incubated in 10 ml of fresh Pronase medium for 20 min, and then transferred to 30 ml of phenol red-free DMEM with 10% FBS and shaken to release single cells. Cells were precipitated at 400 g for 5 min at 4°C. The cell pellet was resuspended in phenol red-free DMEM with 10% FBS and filtered through a 20-μm nylon mesh. The dispersed single cells were resuspended in phenol red-free DMEM with 10% FBS at a density of 107 cells/ml for cell sorting.
A FACSAria (BD Biosciences, San Jose, CA) sorter was used to separate Ghr-GFP cells from a mixed population of gastric cells. The excitation wavelength was 488 nm, emission wavelengths were 530 nm (filtration 530/30) and 575 nm (filtration 575/26), and the nozzle size was 100 μm. Single cells were selected by forward scatter (FSC) and side scatter (SSC); then GFP-expressing (GFP) cells were isolated on the basis of their relative fluorescence intensity, and non-GFP-expressing cells were isolated by a gate that excluded cells expressing green fluorescence. Sorted cells were collected into 1 ml of DMEM with 60% FBS on ice.
Ghrelin Release Assay
FACS-sorted cells were washed twice, suspended in HBSS supplemented with 20 mM HEPES and 1.2 mM CaCl2, pH 7.4, seeded as 1,000 cells/well in 100 μl in 96-well round-bottom cell culture plates precoated overnight with 0.1 mg/ml of rat-tail collagen type I, and incubated at 37°C in 5% CO2. Approximately 99%, 95%, and 90% of cultured cells were viable, as assessed by Trypan blue staining after 1, 2, and 4 h of incubation, respectively. Therefore, the ghrelin secretory responses were measured after 1 h of incubation. Different ligands with various concentrations were added to the reaction buffer in triplicate and incubated for 1 h. The plates were centrifuged at 700 g for 10 min at 4°C, and 25 μl of supernatant were immediately sampled from each well for acylated ghrelin measurement using a Rat Acylated Ghrelin Enzyme Immunoassay Kit (Cayman, Ann Arbor, MI). The secretory response of ghrelin cells to administered ligands was expressed as a percentage of released acylated ghrelin from cells exposed to buffer alone.
RNA Extraction and Quantitative RT-PCR
Gastric tissue.
C57BL/6 mice fed standard rodent chow ad libitum or only water for 16 h were euthanized, and the stomach was dissected and cleaned in cold DPBS. Gastric oxyntic mucosa was scraped for RNA extraction and quantitative RT-PCR analysis.
FACS-sorted cells.
GFP cells and non-GFP cells (1 × 10⁴–1 × 10⁶ cells) collected following FACS were precipitated and dissolved in 0.8–1 ml of TRIzol, and total RNA was extracted according to the manufacturer's instructions. Synthesis of cDNA from 0.1–1 μg of RNA was accomplished using High-Capacity cDNA Reverse Transcription Kits [Applied Biosystems (ABI), San Jose, CA] followed by quantitative RT-PCR (qRT-PCR) using a StepOnePlus Real-Time PCR System (ABI). Mouse β-actin was used as the housekeeping gene to normalize RNA sample input variability. Gene expression was analyzed using the comparative cycle number at threshold (CT) method (ABI User Bulletin No. 2). Gene expression was normalized by the constitutively expressed gene β-actin to obtain a ΔCT value. The gene expression relative to β-actin was expressed as 2−ΔCT and used graphically to demonstrate gene expression.
Pylorus Ligation and Gastric Gavage
Twelve 3-mo-old male C57BL/6 mice were fasted for 16 h with access to water. On the following morning, under isoflurane anesthesia, all mice underwent pylorus ligation; then the abdominal wound was closed. Mice with pylorus ligation randomly received no gavage (sham control, n = 4), water gavage (0.5 ml, n = 4), or olive oil gavage (0.5 ml, n = 4). Blood was sampled from the retroorbital sinus for ghrelin measurement prior to pylorus ligation (−15 min), 15 min after pylorus ligation but just prior to gastric gavage (0 min), and 30 and 60 min postgavage.
Data Analysis
Values are means ± SE. Significant differences between means were analyzed by one- or two-way ANOVA followed by Tukey's post hoc test and Student's t-test using GraphPad Prism version 5 software.
RESULTS
Generation of Ghrelin-GFP Transgenic Mice
A total of 25 litters were generated by pronuclear injection of the ghrelin-GFP transgene (Fig. 1). Two founders with high transgene copy numbers displayed GFP expression along the gastrointestinal epithelium. All the founders and their progeny were viable, healthy, and fertile and exhibited no phenotypic difference compared with their wild-type littermates. GFP cells decreased in density from the stomach to the distal small intestine, with the highest density in the gastric oxyntic mucosa (Fig. 2), where most GFP cells were distributed at the bottom two-thirds of the gastric gland, while some presented near the surface of the gastric mucosa (Fig. 2A, left). There were fewer GFP cells in the gastric antrum (Fig. 2B) and proximal small intestine (Fig. 2C) than in the gastric oxyntic mucosa, and GFP cells were rare in the distal small intestine and colon (data not shown). In the small intestine, the majority of GFP cells were located in the crypts; few were present in the villi (Fig. 2C). Most GFP cells at the gastric oxyntic mucosa were spherical to oval in shape; at the gastric antrum and intestine, GFP cells were teardrop in shape, with thin processes extending to the gut lumen. Since the density, morphology, and distribution of GFP cells between the two founders were indistinguishable, the founder line with the higher transgene copy number was selected and used for subsequent evaluation.
Fig. 2.
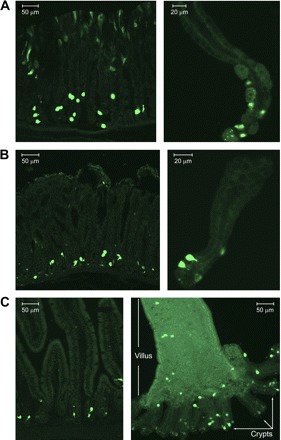
Expression of GFP at the gastrointestinal epithelium in ghrelin-GFP transgenic mice. A: GFP expression (green) in gastric oxyntic mucosa from a frozen tissue section (left) and an isolated gastric oxyntic gland (right). B: GFP expression (green) in gastric antrum mucosa from a frozen tissue section (left) and an isolated antral gland (right). C: GFP expression (green) in small intestine frozen tissue section (left) and isolated villus and attached crypts (right).
GFP Cells With High Fluorescence Intensity in the Gastric Oxyntic Gland Are Ghr-GFP Cells
To determine whether the GFP cells are ghrelin cells, tissue sections from the stomach were stained for acylated ghrelin. Consistent with published data (6, 24), ghrelin-immunoreactive (IR) cells are located at the lower two-thirds of the gastric oxyntic gland. Nearly all ghrelin-IR cells were GFP-positive. Approximately 90% of GFP cells were ghrelin-IR (Fig. 3A), appearing as spherical to oval shape with high fluorescence intensity. The remaining GFP cells were not ghrelin-IR and displayed an irregular shape with low fluorescence (Fig. 3A, arrows). The GFP cells near the surface of gastric mucosa showed faint fluorescence and were not ghrelin-IR.
Fig. 3.
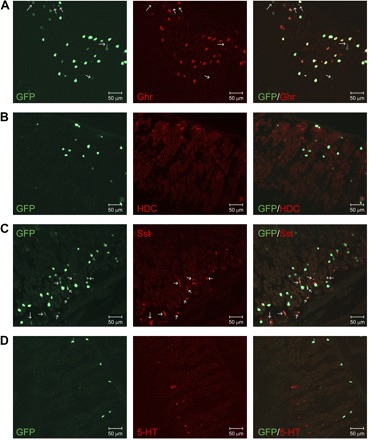
Confirmation of GFP expression in gastric oxyntic mucosal ghrelin cell. A: ∼90% of GFP cell (green) at the lower two-thirds of the gastric gland are ghrelin (Ghr)-immunoreactive (IR; red), and remaining GFP cells are not ghrelin-IR (arrow). GFP cells near the top surface of the gastric mucosa are not ghrelin-IR. B: GFP cells (green) do not colocalize with histidine decarboxylase (HDC)-immunopositive enterochromaffin-like cells (red). C: most GFP cells (green) are not somatostatin (Sst)-IR. Sst-IR cells (red) express a low green fluorescence (green, arrow) compared with Sst-negative GFP cells. D: GFP cells (green) do not colocalize with serotonin (5-HT)-producing enterochromaffin cells (red). All tissue sections for immunofluorescence staining are representative of multiple sections prepared from ≥3 mice.
To specify the GFP cells that were ghrelin-IR-negative, gastric tissue sections were immunostained for HDC, an enterochromaffin-like cell-specific enzyme; Sst, a D cell-specific peptide; and serotonin, an enterochromaffin cell-specific hormone/neurotransmitter. As shown in Fig. 3B, there was no overlap between HDC-IR cells and GFP cells, except a few (<1%) HDC-positive cells showed faint green fluorescence. There were nearly three times more GFP cells than Sst-IR cells. The majority of the Sst cells displayed faint green fluorescence, and >95% of GFP cells with low fluorescence intensity and small irregular shape were Sst-positive (Fig. 3C, arrow). Unlike the other gastric endocrine cells, enterochromaffin cells were predominantly located at the top one-third of the gastric mucosa and did not overlap with GFP cells (Fig. 3D).
Isolation of a Pure Population of Gastric Ghrelin Cells
Cells dispersed from the stomachs of the ghrelin-GFP transgenic mice were a mixed single-cell population. The first attempt to isolate these Ghr-GFP cells on the basis of fluorescence emissions did not allow a clear separation because of the low-level expression of GFP in Sst cells and other gastric mucosa cells. To characterize and separate the Ghr-GFP cells from Sst cells and other non-Ghr-GFP cells by FACS, ghrelin and Sst cells in the mixed-cell population were labeled, respectively, by immunofluorescence with Alexa 630 fluorophore. This allowed clear separation of ghrelin cells from non-ghrelin cells (Fig. 4B1, red) and Sst-IR cells from non-Sst cells (Fig. 4C1, blue). In addition, the ghrelin cells (Fig. 4B2) and the Sst cells (Fig. 4C2) presented different distributions on FSC and SSC. Most ghrelin cells displayed higher fluorescence intensity than the Sst cells (Fig. 4, B3 and C3). Therefore, on the basis of these differences between ghrelin cells and Sst cells, Ghr-GFP cells were first separated from Sst cells by FSC and SSC (Fig. 4D) and subsequently isolated and collected on the basis of fluorescence intensity (Fig. 4E). Success of these two separating steps in achieving a highly enriched Ghr-GFP cell population was demonstrated by 17- and 10-fold greater mRNA expression levels of ghrelin and ghrelin O-acyltransferase, respectively, in Ghr-GFP cells than in Sst-expressing GFP (Sst-GFP) cells. Conversely, Sst gene expression was fourfold higher in Sst-GFP cells than in Ghr-GFP cells (Fig. 4F). Immunostaining confirmed that all isolated Ghr-GFP cells were ghrelin-IR and not Sst-IR (Fig. 4G). However, only 30–40% of presumed Sst-GFP cells were Sst-IR, and 15% were ghrelin-IR (Fig. 4H); the remaining non-ghrelin and non-Sst GFP cells may represent the GFP cells near the surface of the gastric mucosa (Fig. 2A). This pure population of gastric Ghr-GFP cells was subsequently used to study the regulation of ghrelin secretion.
Fig. 4.
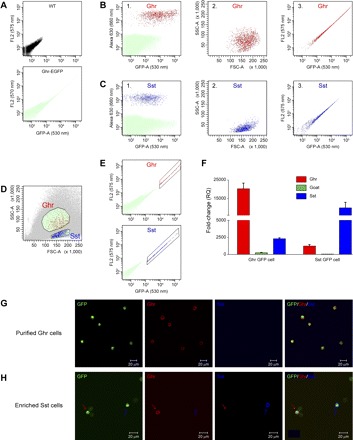
Flow cytometric analysis and isolation of gastric ghrelin-expressing GFP (Ghr-GFP) cells by fluorescence-associated cell sorting (FACS). A: fluorescence of dispersed gastric cells in wild-type (WT) mice and GFP cells in ghrelin-GFP transgenic mice. B: flow cytometric analysis of dispersed gastric cells immunostained for ghrelin. Presorted gastric cells from ghrelin-GFP transgenic mice were immunostained with anti-ghrelin antibody and Alexa Fluor 630-conjugated secondary antibody. B1: ghrelin-positive cells (red) were separated from non-ghrelin cells (green) on the basis of 630-nm emission. B2: ghrelin cells (red, identified in B1) were plotted on the basis of FACS forward scatter (FSC) and side scatter (SSC). B3: ghrelin-positive cells (red, identified from B1) were plotted on the basis of fluorescence intensity of GFP (530- and 575-nm emission). C: flow cytometric analysis of dispersed gastric cells immunostained for Sst. Presorted gastric cells from ghrelin-GFP transgenic mice were immunostained with anti-Sst antibody and Alexa Fluor 630-conjugated secondary antibody. C1: Sst-positive cells (blue) were separated from non-Sst cells (green) on the basis of 630-nm emission. C2: Sst cells (blue, identified in C1) were plotted on the basis of FSC and SSC. C3: Sst-positive cells (blue, identified from C1) were plotted on the basis of fluorescence intensity of GFP. D and E: FACS isolation of gastric Ghr-GFP cells. D: separation of ghrelin cells from Sst cells on the basis of SSC and FSC (B2 and C2). E: isolation of Ghr-GFP cells (red) and Sst-GFP cells (blue) on the basis of fluorescence intensity of GFP (B3 and C3). F: assessment of Ghr-GFP cell purification using quantitative RT-PCR of ghrelin, Sst, and ghrelin O-acyltransferase (GOAT). Transcript levels from isolated Ghr-GFP and Sst-GFP cells were compared with non-GFP cells. RQ, relative quantitation. G: demonstration that almost all isolated GFP cells (green) are Ghr-GFP cells. Parameters outlined in D and E were used to confirm that sorted cells were Ghr-GFP cells by specific immunoreactivity for ghrelin (red) and not Sst (blue). H: heterogeneity of Sst-GFP cells. Isolation of GFP cells using parameters for Sst cells, as outlined in D and E, resulted in only 30% Sst-IR (blue) and 15% ghrelin-IR (red) cells.
mRNA Expression of Peptide Hormone Receptors in Isolated Gastric Ghr-GFP Cells
Various peptide hormones have been reported to regulate gastric ghrelin secretion (18, 21, 26, 27). To verify whether these peptide hormones have effects on ghrelin secretion, the mRNA expression levels of each receptor for these peptide hormones were measured in isolated pure Ghr-GFP cells. As shown in Fig. 5A, expression of Gcg receptor (GcgR), Ins receptor (InsR), and type 2 Sst receptor (SstR2) was not significantly different between Ghr-GFP and non-GFP cells, and Lep receptors (LepR) were barely detectable in Ghr-GFP cells. However, the Ghr-GFP cells had a significantly greater (12-fold) expression of GIP receptor (P < 0.05) and a 38-fold lower expression of GLP-1 receptor (P < 0.01) than non-GFP cells. Of the five SstR subtypes, expression of SstR1 (P < 0.01) and SstR3 and SstR5 (P < 0.05) was significantly higher in Ghr-GFP cells, while expression of SstR4 was significantly lower (16-, 18-, 2.6-, and −225-fold, respectively). GH has been reported to feed back negatively on ghrelin secretion (34); however, expression of the GH receptor in Ghr-GFP cells was not significantly different from that in non-GFP cells.
Fig. 5.
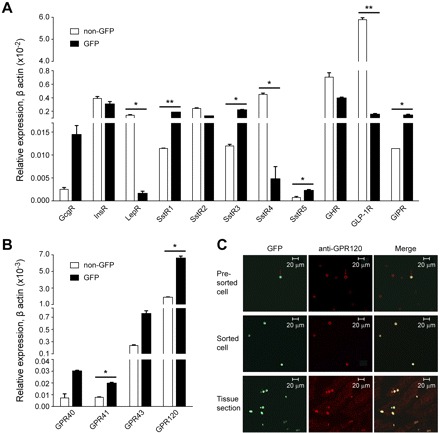
Gene and protein expression of cell surface receptors in Ghr-GFP and non-GFP cells. A and B: relative gene expression in Ghr-GFP cells vs. non-GFP cells for peptide hormone receptors for glucagon (GcgR), leptin (LepR), insulin (InsR), Sst (SstR), growth hormone (GHR), glucagon-like peptide 1 (GLP-1R), and glucose-dependent insulinotropic polypeptide (GIPR) (A) and short-chain free fatty acid receptors GPR41 and GPR43 and long-chain fatty acid (LCFA) receptors GPR40 and GPR120 (B). Data were normalized using internal β-actin gene expression. Values are means ± SE from 3 separate experiments performed in duplicate. *P < 0.05, **P < 0.01. C: colocalization of GFP (green) with GPR120 (red) immunoreactivity in presorted gastric oxyntic cells (top), FACS-isolated Ghr-GFP cells (middle), and frozen stomach tissue sections (bottom) from Ghr-GFP mice.
mRNA Expression of Free Fatty Acid Receptors in Isolated Gastric Ghr-GFP Cells
Intravenous infusion of intralipid increases plasma free fatty acid (FFA) concentration and reduces plasma ghrelin levels (12). Two LCFA receptors, GPR40 and GPR120, and two short-chain fatty acid receptors, GPR41 and GPR43, have been identified (15). To determine whether FFAs directly regulate ghrelin secretion, the mRNA expression levels of FFA receptors in isolated gastric Ghr-GFP cells were determined. GPR40 and GPR41 were undetectable in Ghr-GFP and non-GFP cells. GPR43 and GPR120 were expressed in both cell populations. The expression of GPR43 and GPR120 was threefold greater in Ghr-GFP cells than in non-GFP cells, but GPR120 showed much higher expression levels than GPR43 (Fig. 5B). The expression of GPR120 was confirmed at the protein level by immunofluorescence colocalization of GPR120, with highly expressing GFP cells in presorted and sorted gastric cells as well as gastric tissue sections (Fig. 5C).
Ghrelin Secretion From Isolated Short-Term-Cultured Pure Ghr-GFP Cells
The functional significance of the ghrelin cell surface receptors identified by qRT-PCR was assessed by ghrelin secretion in vitro using acutely isolated cultured gastric Ghr-GFP cells. Consistent with the hormone receptor expression profile, the short-term-cultured Ghr-GFP cells showed no secretory response to Ins (10 nM), Gcg (100 nM), and Lep (10 nM) (Fig. 6A). GH, GIP, and Oxyn, at 10 nM, had no effect on ghrelin release. In contrast, the Sst agonist Oct decreased ghrelin secretion by 10.9 ± 2.1% at 10 nM and 19.9 ± 3.3% at 100 nM (Fig. 6A). The LCFAs docosadienoic acid, LLA, and palmitoleic acid, at 2 μM, significantly decreased ghrelin release to 31.5 ± 2.9%, 25.2 ± 3.6%, and 26.2 ± 3.6% of baseline, respectively (Fig. 6B). No effect on ghrelin secretion was observed from methyl linolenate, a pharmacologically inactive form of LLA, the medium-chain fatty acid dodecanoic acid, or the short-chain fatty acids VLA and BTA (Fig. 6B). To ensure consistent secretory competency, the depolarizing effect of 50 mM KCl was used for each preparation of Ghr-GFP cells (Fig. 6C).
Fig. 6.
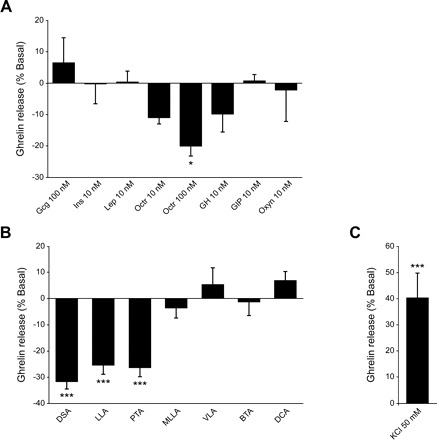
Ghrelin secretion from isolated and short-term cultured gastric Ghr-GFP cells. A: response to peptide hormones glucagon (Gcg), leptin (Lep), insulin (Ins), octreotide (Oct), growth hormone (GH), Gcg-like peptide-1 (GLP-1), glucose-dependent insulinotropic peptide (GIP), or oxyntomodulin (Oxyn). B: response to 2 μM free fatty acids: docosadienoic acid (DSA), linolenic acid (LLA), palmitoleic acid (PTA), linolenate acid methyl ester (MLLA), dodecanoic acid (DCA), valeric acid (VLA), and butyric acid (BTA). C: response to 50 mM KCl. Values are means ± SE from ≥3 experiments performed in triplicate: n = 6–18 (A), n = 9–18 (B), and n = 15 (C). Data are expressed as percent ghrelin release relative to basal (buffer alone). Significantly different from basal: *P < 0.05, ***P < 0.001.
Effect of Lipid Gavage on Ghrelin Secretion
To test whether gastric luminal LCFA inhibited gastric ghrelin secretion, pure olive oil, an oleic acid-rich lipid, was introduced into the stomach of wild-type mice by gastric gavage. To avoid the interference of intestinal and postabsorptive LCFA on ghrelin secretion, the passage of stomach luminal content to the intestine was blocked by pylorus ligation. Pylorus ligation induced a sharp drop of serum acylated ghrelin levels to 50% of baseline (preligation) levels (from 598.4 ± 59.1 to 286.2 ± 17.7 ng/ml) in 15 min (Fig. 7), after which serum ghrelin levels started to rise. Therefore, gastric gavage was performed 15 min after pylorus ligation (0 time point for gastric gavage). As shown in Fig. 7, gastric gavage of water had no effect on serum ghrelin levels at 30 min (420 ± 52 ng/ml) and 60 min (657.1 ± 59.8 ng/ml) after gavage compared with mice with only pylorus ligation. In contrast, gastric gavage of olive oil caused a delayed recovery of serum ghrelin levels at 30 min (248.2 ± 42.1 ng/ml) compared with sham and water gavage control mice (P < 0.05). At 60 min, ghrelin secretion had recovered to a baseline level comparable to the control groups. This result suggests that gastric luminal lipids cause a transient inhibition of ghrelin secretion.
Fig. 7.
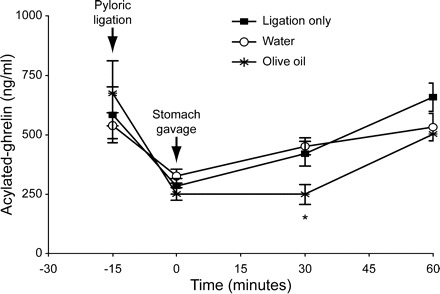
Effect of stomach intraluminal lipid on gastric ghrelin release. After anesthesia and pylorus ligation, blood was drawn prior to gavage (−15 min and 0 min) and 30 and 60 min after gavage. Pylorus-ligated mice were randomized for ligation only (n = 4) vs. water (n = 4) or olive oil (n = 4) gavage. Values are mean ± SE. *P < 0.05, oil vs. ligation-only (sham) and water gavage.
Increased Prandial Gastric Mucosal Uptake of LCFA
LCFA within the gastric mucosa could also interact directly with the ghrelin cell surface receptor GPR120 and inhibit ghrelin secretion. To identify whether a meal increases gastric mucosal LCFA, gene expression of markers for LCFA uptake, LPL (9, 19), glycosylphosphatidylinositol-anchored HDL-binding protein 1 (GPIHBP1) (2), peroxisome proliferator-activated receptor-γ (PPARγ) (7), and CD36 (11, 13), was measured by qRT-PCR in gastric tissue. As expected, the mRNA levels of mouse gastric mucosal LPL, GPIHBP1, and PPARγ increased significantly in fed mice, while CD36 was slightly, but not significantly, higher (Fig. 8) than in fasted mice. These results suggest that, in the fed state, more LCFAs would be taken up into the gastric mucosa, where they could interact with GPR120 to inhibit ghrelin secretion.
Fig. 8.
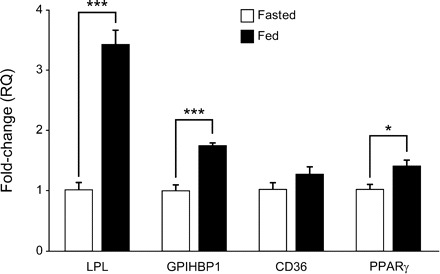
Gene expression of gastric mucosal proteins for uptake of LCFA from circulating triglygerides in fasted and fed mice. Gastric tissue transcripts for lipoprotein lipase (LPL), glycosylphosphatidylinositol-anchored HDL-binding protein 1 (GPIHBP1), CD36, and peroxisome proliferator-activated receptor-γ (PPARγ) were measured using quantitative RT-PCR in mice that had been fasted (except water) for 16 h or fed regular chow ad libitum. Data, normalized to β-actin, are expressed as fold change. Values are means ± SE. *P < 0.05, ***P < 0.001.
DISCUSSION
By generating transgenic mice with ghrelin cell-specific expression of GFP, a pure population of Ghr-GFP cells could be isolated and the regulation of ghrelin secretion could be directly characterized. Studies in these isolated Ghr-GFP cells allowed identification of expression of the LCFA receptor GPR120 and LCFA inhibition of ghrelin secretion. Gastric gavage of LCFA-rich lipid to mice with pylorus ligation induced transient reduction of serum ghrelin levels, and feeding significantly increased the gene expression of proteins involved in gastric mucosa uptake of LCFA from circulating triglycerides (TG).
Others have successfully used ghrelin cell-specific transgenic expression of GFP to detect ghrelin cell distribution but have not addressed regulation of ghrelin cell secretion (20). Still others have used transgenic expression of fluorescent proteins to isolate pure populations of enteroendocrine cells, which have a scattered distribution that hinders their characterization, similar to ghrelin cells (31, 33). However, in these studies, the fluorescent-labeled cells could only be characterized within a mixed population of intestinal epithelial cells in short-term culture, which, unlike our study, obscures the ability to distinguish direct from indirect effects.
Because of the orexigenic and energy homeostatic properties of ghrelin, much effort has been focused on the effects of peptide hormones on ghrelin secretion. Published results indicate that Gcg increases ghrelin secretion, while Ins and Lep decrease it (21, 23, 26, 27, 35). We demonstrated that receptors for Gcg and Lep were nearly undetectable in Ghr-GFP cells. As expected, functional studies on short-term-cultured Ghr-GFP cells demonstrated no effects of Glu and Lep on ghrelin secretion. Expression of receptors for Ins, GH, and GLP-1 was lower in Ghr-GFP cells than in non-GFP cells. Consistent with the low receptor expression, these peptide hormones, as well as GIP and Oxyn, had no effect on ghrelin secretion. The inconsistency between the published data and our results indicate that the reported effects of multiple hormones on ghrelin secretion are probably indirect. Among the receptors for enteroendocrine peptide hormones, only SstR1 and SstR3 were highly expressed in Ghr-GFP cells. Their functional expression was confirmed by the significant inhibition of ghrelin secretion from short-term-cultured Ghr-GFP cells by the Sst long-acting analog Oct. Sst is a strong inhibitor for most endocrine cells through endocrine and paracrine effects and is released after ingestion of a meal (3, 8). Sst and its analog inhibit ghrelin secretion in humans (36), and Sst null mice exhibit elevated total ghrelin and stomach ghrelin mRNA levels (29). Therefore, consistent with the findings of others, our results suggest that Sst acts at least in part as a postprandial, direct negative regulator of ghrelin secretion.
The gastric location of ghrelin cells indicates their potential for direct sensing of luminal nutrients and/or postprandial elevation of absorbed nutrients in gastric tissue. In support of a chemosensory role for ghrelin cells, we demonstrate that the LCFA receptor GPR120, and not GPR40, is highly expressed in Ghr-GFP cells and that ghrelin secretion from isolated Ghr-GFP cells is significantly and directly inhibited by LCFAs. Even though Ghr-GFP cells express GPR43, cultured Ghr-GFP cells had no response to short-chain fatty acids (VLA and BTA). The stomach lumen maintains a high concentration of LCFA following ingestion of a fatty meal (1). Our data show that gastric gavage of LCFA-rich olive oil in mice with pylorus ligation transiently decreased plasma ghrelin levels possibly via the direct interaction with ghrelin cell surface GPR120. However, an indirect mechanism cannot be excluded. While the transient inhibitory effect of gavaged olive oil on ghrelin secretion demonstrated in our study is consistent with the transient reduction of serum ghrelin levels after a meal (5, 28), the morphologically closed-type ghrelin cells observed in our study as well as by others (6, 24) do not support the proposed direct communication to intraluminal nutrients. Therefore, we investigated whether there is an increase in gastric mucosal LCFA following intestinal absorption of TG in fed mice. Ninety percent of LCFAs in plasma are delivered as a component of TG (10). Tissue LCFAs, a major energy supply for cell metabolism, are extracted from circulating TG. Uptake of LCFA by individual tissues is regulated by energy utilization under the control of LPL, CD36, GPIHBP1, and PPARγ. We hypothesized that the energy requirement for the majority of gastric cells is low in the fasting state and increases with a meal to support gastric secretion and motility necessary for digestion. Consistent with this hypothesis, we found that mouse stomach mucosa LPL levels are significantly higher in fed than fasted mice, suggesting an increased LCFA uptake by gastric mucosa with feeding. Increased LPL activity in the tissue capillary bed enhances lipolysis of TG and increases local LCFA concentration (38). PPARγ expression is enhanced by glucose and LCFA, and PPARγ activates GPIHBP1 expression. The expression of GPIHBP1, an endothelial cell-binding site for LPL and chylomicrons, is induced by PPARγ (7). The increase in stomach mucosa PPARγ and GPIHBP1 gene expression with feeding is consistent with upregulation of LPL activity. Taken together, food ingestion increases stomach mucosal LPL activity, resulting in increased LCFA concentration available to the gastric interstitial space, where it may directly interact with GPR120 and inhibit ghrelin secretion.
In conclusion, the presence of the Ghr-GFP cell surface LCFA receptor GPR120 and the inhibition of LCFA on ghrelin secretion in vitro indicate that GPR120 may mediate LCFA inhibition on ghrelin secretion. Additionally, the direct action of luminal LCFA and meal-induced increases in transcripts for proteins mediating gastric mucosal uptake of circulating LCFA indicate that GPR120 may play an important role in mediating prandial LCFA inhibition of ghrelin secretion in vivo. These results support the need for future investigation of the therapeutic control of ghrelin-related appetite through the modulation of GPR120 activity.
DISCLOSURES
No conflicts of interest, financial or otherwise, are declared by the authors.
AUTHOR CONTRIBUTIONS
X.L. and S.A.W. are responsible for conception and design of the research; X.L., X.Z., J.F., S.A., S.P., Y.S., and H.L. performed the experiments; X.L., A.P.L., and S.A.W. analyzed the data; X.L. and S.A.W. interpreted the results of the experiments; X.L. and S.A.W. prepared the figures; X.L. and S.A.W. drafted the manuscript; X.L., Y.S., and S.A.W. edited and revised the manuscript; X.L. and S.A.W. approved the final version of the manuscript.
REFERENCES
- 1. Armand M, Borel P, Dubois C, Senft M, Peyrot J, Salducci J, Lafont H, Lairon D. Characterization of emulsions and lipolysis of dietary lipids in the human stomach. Am J Physiol Gastrointest Liver Physiol 266: G372–G381, 1994 [DOI] [PubMed] [Google Scholar]
- 2. Beigneux AP, Davies BS, Bensadoun A, Fong LG, Young SG. GPIHBP1, a GPI-anchored protein required for the lipolytic processing of triglyceride-rich lipoproteins. J Lipid Res 50 Suppl: S57–S62, 2009 [DOI] [PMC free article] [PubMed] [Google Scholar]
- 3. Binimelis J, Webb SM, Mones J, Serrano J, Casamitjana R, Elena M, Peinado MA, Vilardell F, De Leiva A. Circulating immunoreactive somatostatin in gastrointestinal diseases. Decrease after vagotomy and enhancement in active ulcerative colitis, irritable bowel syndrome, and duodenal ulcer. Scand J Gastroenterol 22: 931–937, 1987 [DOI] [PubMed] [Google Scholar]
- 4. Chung JH, Bell AC, Felsenfeld G. Characterization of the chicken β-globin insulator. Proc Natl Acad Sci USA 94: 575–580, 1997 [DOI] [PMC free article] [PubMed] [Google Scholar]
- 5. Cummings DE, Purnell JQ, Frayo RS, Schmidova K, Wisse BE, Weigle DS. A preprandial rise in plasma ghrelin levels suggests a role in meal initiation in humans. Diabetes 50: 1714–1719, 2001 [DOI] [PubMed] [Google Scholar]
- 6. Date Y, Kojima M, Hosoda H, Sawaguchi A, Mondal MS, Suganuma T, Matsukura S, Kangawa K, Nakazato M. Ghrelin, a novel growth hormone-releasing acylated peptide, is synthesized in a distinct endocrine cell type in the gastrointestinal tracts of rats and humans. Endocrinology 141: 4255–4261, 2000 [DOI] [PubMed] [Google Scholar]
- 7. Davies BS, Waki H, Beigneux AP, Farber E, Weinstein MM, Wilpitz DC, Tai LJ, Evans RM, Fong LG, Tontonoz P, Young SG. The expression of GPIHBP1, an endothelial cell binding site for lipoprotein lipase and chylomicrons, is induced by peroxisome proliferator-activated receptor-γ. Mol Endocrinol 22: 2496–2504, 2008 [DOI] [PMC free article] [PubMed] [Google Scholar]
- 8. Ensinck JW, Vogel RE, Laschansky EC, Francis BH. Effect of ingested carbohydrate, fat, and protein on the release of somatostatin-28 in humans. Gastroenterology 98: 633–638, 1990 [DOI] [PubMed] [Google Scholar]
- 9. Fielding BA, Frayn KN. Lipoprotein lipase and the disposition of dietary fatty acids. Br J Nutr 80: 495–502, 1998 [DOI] [PubMed] [Google Scholar]
- 10. Frayn KN, Coppack SW, Fielding BA, Humphreys SM. Coordinated regulation of hormone-sensitive lipase and lipoprotein lipase in human adipose tissue in vivo: implications for the control of fat storage and fat mobilization. Adv Enzyme Regul 35: 163–178, 1995 [DOI] [PubMed] [Google Scholar]
- 11. Goldberg IJ, Eckel RH, Abumrad NA. Regulation of fatty acid uptake into tissues: lipoprotein lipase- and CD36-mediated pathways. J Lipid Res 50 Suppl: S86–S90, 2009 [DOI] [PMC free article] [PubMed] [Google Scholar]
- 12. Gormsen LC, Nielsen C, Gjedsted J, Gjedde S, Vestergaard ET, Christiansen JS, Jorgensen JO, Moller N. Effects of free fatty acids, growth hormone and growth hormone receptor blockade on serum ghrelin levels in humans. Clin Endocrinol 66: 641–645, 2007 [DOI] [PubMed] [Google Scholar]
- 13. Goudriaan JR, den Boer MA, Rensen PC, Febbraio M, Kuipers F, Romijn JA, Havekes LM, Voshol PJ. CD36 deficiency in mice impairs lipoprotein lipase-mediated triglyceride clearance. J Lipid Res 46: 2175–2181, 2005 [DOI] [PubMed] [Google Scholar]
- 14. Gutierrez JA, Solenberg PJ, Perkins DR, Willency JA, Knierman MD, Jin Z, Witcher DR, Luo S, Onyia JE, Hale JE. Ghrelin octanoylation mediated by an orphan lipid transferase. Proc Natl Acad Sci USA 105: 6320–6325, 2008 [DOI] [PMC free article] [PubMed] [Google Scholar]
- 15. Hirasawa A, Hara T, Katsuma S, Adachi T, Tsujimoto G. Free fatty acid receptors and drug discovery. Biol Pharm Bull 31: 1847–1851, 2008 [DOI] [PubMed] [Google Scholar]
- 16. Hosoda H, Kangawa K. The autonomic nervous system regulates gastric ghrelin secretion in rats. Regul Pept 146: 12–18, 2008 [DOI] [PubMed] [Google Scholar]
- 17. Iwakura H, Ariyasu H, Hosoda H, Yamada G, Hosoda K, Nakao K, Kangawa K, Akamizu T. Oxytocin and dopamine stimulate ghrelin secretion by the ghrelin-producing cell line MGN3–1 in vitro. Endocrinology 152: 2619–2625, 2011 [DOI] [PubMed] [Google Scholar]
- 18. Iwakura H, Li Y, Ariyasu H, Hosoda H, Kanamoto N, Bando M, Yamada G, Hosoda K, Nakao K, Kangawa K, Akamizu T. Establishment of a novel ghrelin-producing cell line. Endocrinology 151: 2940–2945, 2010 [DOI] [PubMed] [Google Scholar]
- 19. Jensen MD. Fate of fatty acids at rest and during exercise: regulatory mechanisms. Acta Physiol Scand 178: 385–390, 2003 [DOI] [PubMed] [Google Scholar]
- 20. Kageyama H, Kitamura Y, Hosono T, Kintaka Y, Seki M, Takenoya F, Hori Y, Nonaka N, Arata S, Shioda S. Visualization of ghrelin-producing neurons in the hypothalamic arcuate nucleus using ghrelin-EGFP transgenic mice. Regul Pept 145: 116–121, 2008 [DOI] [PubMed] [Google Scholar]
- 21. Kamegai J, Tamura H, Shimizu T, Ishii S, Sugihara H, Oikawa S. Effects of insulin, leptin, and glucagon on ghrelin secretion from isolated perfused rat stomach. Regul Pept 119: 77–81, 2004 [DOI] [PubMed] [Google Scholar]
- 22. Kanamoto N, Akamizu T, Tagami T, Hataya Y, Moriyama K, Takaya K, Hosoda H, Kojima M, Kangawa K, Nakao K. Genomic structure and characterization of the 5′-flanking region of the human ghrelin gene. Endocrinology 145: 4144–4153, 2004 [DOI] [PubMed] [Google Scholar]
- 23. Katayama T, Shimamoto S, Oda H, Nakahara K, Kangawa K, Murakami N. Glucagon receptor expression and glucagon stimulation of ghrelin secretion in rat stomach. Biochem Biophys Res Commun 357: 865–870, 2007 [DOI] [PubMed] [Google Scholar]
- 24. Kojima M, Hosoda H, Date Y, Nakazato M, Matsuo H, Kangawa K. Ghrelin is a growth-hormone-releasing acylated peptide from stomach. Nature 402: 656–660, 1999 [DOI] [PubMed] [Google Scholar]
- 25. Lee HM, Wang G, Englander EW, Kojima M, Greeley GH., Jr Ghrelin, a new gastrointestinal endocrine peptide that stimulates insulin secretion: enteric distribution, ontogeny, influence of endocrine and dietary manipulations. Endocrinology 143: 185–190, 2002 [DOI] [PubMed] [Google Scholar]
- 26. Lippl F, Erdmann J, Atmatzidis S, Schusdziarra V. Direct effect of leptin on gastric ghrelin secretion. Horm Metab Res 37: 123–125, 2005 [DOI] [PubMed] [Google Scholar]
- 27. Lippl F, Kircher F, Erdmann J, Allescher HD, Schusdziarra V. Effect of GIP, GLP-1, insulin and gastrin on ghrelin release in the isolated rat stomach. Regul Pept 119: 93–98, 2004 [DOI] [PubMed] [Google Scholar]
- 28. Liu J, Prudom CE, Nass R, Pezzoli SS, Oliveri MC, Johnson ML, Veldhuis P, Gordon DA, Howard AD, Witcher DR, Geysen HM, Gaylinn BD, Thorner MO. Novel ghrelin assays provide evidence for independent regulation of ghrelin acylation and secretion in healthy young men. J Clin Endocrinol Metab 93: 1980–1987, 2008 [DOI] [PMC free article] [PubMed] [Google Scholar]
- 29. Luque RM, Gahete MD, Hochgeschwender U, Kineman RD. Evidence that endogenous SST inhibits ACTH and ghrelin expression by independent pathways. Am J Physiol Endocrinol Metab 291: E395–E403, 2006 [DOI] [PubMed] [Google Scholar]
- 30. Overduin J, Frayo RS, Grill HJ, Kaplan JM, Cummings DE. Role of the duodenum and macronutrient type in ghrelin regulation. Endocrinology 146: 845–850, 2005 [DOI] [PubMed] [Google Scholar]
- 31. Parker HE, Habib AM, Rogers GJ, Gribble FM, Reimann F. Nutrient-dependent secretion of glucose-dependent insulinotropic polypeptide from primary murine K cells. Diabetologia 52: 289–298, 2009 [DOI] [PMC free article] [PubMed] [Google Scholar]
- 32. Pfluger PT, Kirchner H, Gunnel S, Schrott B, Perez-Tilve D, Fu S, Benoit SC, Horvath T, Joost HG, Wortley KE, Sleeman MW, Tschop MH. Simultaneous deletion of ghrelin and its receptor increases motor activity and energy expenditure. Am J Physiol Gastrointest Liver Physiol 294: G610–G618, 2008 [DOI] [PubMed] [Google Scholar]
- 33. Reimann F, Habib AM, Tolhurst G, Parker HE, Rogers GJ, Gribble FM. Glucose sensing in L cells: a primary cell study. Cell Metab 8: 532–539, 2008 [DOI] [PMC free article] [PubMed] [Google Scholar]
- 34. Seoane LM, Al-Massadi O, Barreiro F, Dieguez C, Casanueva FF. Growth hormone and somatostatin directly inhibit gastric ghrelin secretion. An in vitro organ culture system. J Endocrinol Invest 30: RC22–RC25, 2007 [DOI] [PubMed] [Google Scholar]
- 35. Shimada M, Date Y, Mondal MS, Toshinai K, Shimbara T, Fukunaga K, Murakami N, Miyazato M, Kangawa K, Yoshimatsu H, Matsuo H, Nakazato M. Somatostatin suppresses ghrelin secretion from the rat stomach. Biochem Biophys Res Commun 302: 520–525, 2003 [DOI] [PubMed] [Google Scholar]
- 36. Silva AP, Bethmann K, Raulf F, Schmid HA. Regulation of ghrelin secretion by somatostatin analogs in rats. Eur J Endocrinol 152: 887–894, 2005 [DOI] [PubMed] [Google Scholar]
- 37. Sun Y, Asnicar M, Saha PK, Chan L, Smith RG. Ablation of ghrelin improves the diabetic but not obese phenotype of ob/ob mice. Cell Metab 3: 379–386, 2006 [DOI] [PubMed] [Google Scholar]
- 38. Teusink B, Voshol PJ, Dahlmans VE, Rensen PC, Pijl H, Romijn JA, Havekes LM. Contribution of fatty acids released from lipolysis of plasma triglycerides to total plasma fatty acid flux and tissue-specific fatty acid uptake. Diabetes 52: 614–620, 2003 [DOI] [PubMed] [Google Scholar]
- 39. Tschop M, Smiley DL, Heiman ML. Ghrelin induces adiposity in rodents. Nature 407: 908–913, 2000 [DOI] [PubMed] [Google Scholar]
- 40. Williams DL, Cummings DE, Grill HJ, Kaplan JM. Meal-related ghrelin suppression requires postgastric feedback. Endocrinology 144: 2765–2767, 2003 [DOI] [PubMed] [Google Scholar]
- 41. Williams DL, Grill HJ, Cummings DE, Kaplan JM. Vagotomy dissociates short- and long-term controls of circulating ghrelin. Endocrinology 144: 5184–5187, 2003 [DOI] [PubMed] [Google Scholar]
- 42. Wortley KE, del Rincon JP, Murray JD, Garcia K, Iida K, Thorner MO, Sleeman MW. Absence of ghrelin protects against early-onset obesity. J Clin Invest 115: 3573–3578, 2005 [DOI] [PMC free article] [PubMed] [Google Scholar]
- 43. Wren AM, Seal LJ, Cohen MA, Brynes AE, Frost GS, Murphy KG, Dhillo WS, Ghatei MA, Bloom SR. Ghrelin enhances appetite and increases food intake in humans. J Clin Endocrinol Metab 86: 5992, 2001 [DOI] [PubMed] [Google Scholar]
- 44. Yang J, Brown MS, Liang G, Grishin NV, Goldstein JL. Identification of the acyltransferase that octanoylates ghrelin, an appetite-stimulating peptide hormone. Cell 132: 387–396, 2008 [DOI] [PubMed] [Google Scholar]
- 45. Zhao TJ, Sakata I, Li RL, Liang G, Richardson JA, Brown MS, Goldstein JL, Zigman JM. Ghrelin secretion stimulated by β1-adrenergic receptors in cultured ghrelinoma cells and in fasted mice. Proc Natl Acad Sci USA 107: 15868–15873, 2010 [DOI] [PMC free article] [PubMed] [Google Scholar]
- 46. Zigman JM, Nakano Y, Coppari R, Balthasar N, Marcus JN, Lee CE, Jones JE, Deysher AE, Waxman AR, White RD, Williams TD, Lachey JL, Seeley RJ, Lowell BB, Elmquist JK. Mice lacking ghrelin receptors resist the development of diet-induced obesity. J Clin Invest 115: 3564–3572, 2005 [DOI] [PMC free article] [PubMed] [Google Scholar]