

Abstract
The laboratory mouse is a facultative daily heterotherm in that it experiences bouts of torpor under caloric restriction. Mice are the most frequently studied laboratory mammal, and often, genetically modified mice are used to investigate many physiological functions related to weight loss and caloric intake. As such, research documenting the cardiovascular changes during fasting-induced torpor in mice is warranted. In the current study, C57BL/6 mice were implanted either with EKG/temperature telemeters or blood pressure telemeters. Upon fasting and exposure to an ambient temperature (Ta) of 19°C, mice entered torpor bouts as assessed by core body temperature (Tb). Core Tb fell from 36.6 ± 0.2°C to a minimum of 25.9 ± 0.9°C during the fast, with a concomitant fall in heart rate from 607 ± 12 beats per minute (bpm) to a minimum of 158 ± 20 bpm. Below a core Tb of 31°C, heart rate fell exponentially with Tb, and the Q10 was 2.61 ± 0.18. Further, mice implanted with blood pressure telemeters exhibited similar heart rate and activity profiles as those implanted with EKG/temperature telemeters, and the fall in heart rate and core Tb during entrance into torpor was paralleled by a fall in blood pressure. The minimum systolic, mean, and diastolic blood pressures of torpid mice were 62.3 ± 10.2, 51.9 ± 9.2, 41.0 ± 7.5 mmHg, respectively. Torpid mice had a significantly lower heart rate (25–35%) than when euthermic at mean arterial pressures from 75 to 100 mmHg, suggesting that total peripheral resistance is elevated during torpor. These data provide new and significant insight into the cardiovascular adjustments that occur in torpid mice.
Keywords: hibernation, heart rate, systolic, diastolic, fasting, radiotelemetry
the laboratory mouse (mus musculus) is well equipped to deal with limitations of caloric intake in that it readily enters into a state of torpor during short-term limitations in caloric intake in the wild (24, 25). This adaptation persists in laboratory-generated strains of Mus musculus (1, 3, 8, 13, 15, 16, 27, 33, 36, 38–40), allowing for more mechanistic studies in a controlled laboratory environment. Torpor is characterized by both a metabolic rate that is well below that of basal metabolic rate and a low core body temperature (Tb). A simple overnight fast at 22°C, a typical housing temperature for laboratory mice, will induce torpor typically within 7–8 h of the fast. While the laboratory mouse has such widespread usage in medical research, virtually nothing is known about the cardiovascular adjustments that occur during a bout of torpor in this animal.
Maintaining sufficient blood pressure to perfuse organs for delivery of fuels and removal of waste is requisite to life in mammals. While metabolic rate is diminished in torpor, there remains a metabolic demand that requires adequate blood flow. During both deep bouts of torpor in hibernation and in shallow bouts seen in daily heterotherms, heart rate sharply declines (5–7, 14, 17–21, 23, 32, 43–45). The heart rate in deep hibernators can be as low as a few beats per minute (bpm), while animals in a shallow bout of torpor (Tb ∼20°C) exhibit minimum heart rates near 70 bpm (4, 6, 17, 20, 22, 23, 44). The minimum heart rate in the torpid laboratory mouse, however, and its regulation during entrance and emergence from torpor has not been reported. Further, the relationship between heart rate and Tb during torpor in laboratory mice has not been assessed. Moreover, almost no information concerning blood pressure and its control during torpor bouts is available. Only a handful of studies have measured blood pressure throughout a torpor bout. Using a tethering system, Lyman and O'Brien (17, 18) found blood pressure drops to ∼20 mmHg in the deep hibernating ground squirrel. The blood pressure of mice has been reported three times with telemetry in a fasted state. In one study, mean arterial pressure appears to fall to ∼65 mmHg in a fasted mouse (42). A second study shows an individual calorically restricted ob/ob mouse with a minimum mean arterial pressure of 70 mmHg (32), while the third study opted to exclude times of day that would have encompassed torpor (41). Because a quantitative assessment of heart rate, core Tb, and blood pressure during torpor in M. musculus is not currently available in the literature, we aimed to characterize the cardiovascular characteristics during euthermia and torpor in the lab mouse. The inbred C57BL/6 strain of mouse was chosen for study because it is a very common strain of mouse used in the laboratory. Also, genetically modified mice have the C57BL/6 genetic background, so these data provide baseline information for future research on torpor in studies that use genetically modified mice. The results from this set of experiments are consistent with the cardiovascular changes that occur in other mammals that undergo daily torpor. Further, these results highlight the need for awareness of the extent of the cardiovascular and autonomic changes that occur in the fasted state that may confound interpretation of feeding studies in the genetically modified mouse.
MATERIALS AND METHODS
Animals.
C57BL/6J female mice (6 mo old, ∼22 g) were purchased from Jackson Laboratories. Female mice were chosen because we have found that they are more likely than male mice to enter a torpor bout when fasted (unpublished observations). Animals were maintained on a 12:12-h light-dark phases, dark from 10 AM to 10 PM. Mice were housed at 29°C until surgeries were performed. All animal studies were approved by the Williams College Institutional Animal Care and Use Committee.
Implantation of blood pressure telemeters.
Mice (n = 7) were anesthetized initially with 5% isoflurane in an oxygen stream, and maintained on 1–2% isoflurane. Mice were kept on a heating pad (38°C) throughout implantation of blood pressure transducers (PAC10; Data Sciences International) in the left common carotid artery, as described previously (32). The telemeter body was tunneled subcutaneously, placed in the peritoneal cavity, and sutured into the body wall. The blood pressure telemeters were calibrated with a manometer at four pressures and validated at a fifth pressure. Mice were maintained on a heating pad for 48 h following the surgery, and then housed individually at 29°C for 10 days to allow time for recovery.
Implantation of EKG/temperature telemeters.
Mice (n = 14) were anesthetized as above. The body of the telemeter (ETAF20), calibrated at temperatures between 20°C and 40°C, was placed in the peritoneal cavity. EKG leads from the telemeter were placed subcutaneously on either side of the heart, and sutured in place, as described previously (30). Mice were allowed to recover as above.
Cardiovascular data collection.
Waveforms from the implanted telemeters were collected once per minute, for 10 s at a time, at a sampling rate of 500 Hz. From the EKG/temperature waveforms, heart rate and core Tb were calculated. From the blood pressure waveforms, the following cardiovascular variables were calculated: heart rate, systolic pressure, diastolic pressure, mean arterial pressure, and pulse pressure. Activity of each mouse was also calculated by the change in signal strength coming from the telemeter as the mouse moved about its cage.
Experimental setup.
Mice were moved from an ambient temperature (Ta) of 29°C to cages kept at 19°C, ∼10°C below their thermoneutral zone (16), for data acquisition. After 24 h of acclimation to a Ta of 19°C, waveforms were acquired at the onset of the dark phase for a total of 23 h (12 h in the dark phase and 11 h in the light phase). During this time, the mice had free access to food and water. Mice were then fasted at the onset of the dark phase, with free access to water. Waveforms were acquired at the onset of the fast (and dark phase) for 23 h, at which point the mice were refed. The last hour of the light phase during both the ad libitum period and the fasting period was used for mouse care. Waveforms were not obtained during this hour.
Statistics.
Data for the variables studied are reported as means ± SE. Paired t-tests were used for all analyses reported (dark vs. light phase, entrance vs. emergence from torpor, minimum pressures in euthermic vs. torpid state, heart rates at mean blood pressure ranges). The 0.05 level of confidence was accepted for statistical significance.
RESULTS
EKG/temperature measurements.
While fed ad libitum and housed at a Ta of 19°C, female mice implanted with EKG/temperature telemeters exhibited a mean heart rate of 607 ± 12 bpm over 23 h and a mean core Tb of 36.6 ± 0.2°C. The mice showed significantly higher values for heart rate, core Tb, and activity in the dark phase than during the light phase (Table 1). When the mice were fasted at a Ta of 19°C, all mice experienced a bout of torpor (for a typical example, see Fig. 1), with the minimum core Tb of 25.9 ± 0.9°C over the 23-h fasted period. Torpor bouts in mice typically initiated near the end of the dark phase and continued for multiple hours into the light phase, as shown previously (37). Individual minimum core Tbs ranged from 21.1 to 30.8°C. The decrease in activity (Fig. 1A) coincided with the fall in both core Tb (Fig. 1A) and heart rate (Fig. 1B). When plotted as a function of core Tb, heart rate showed a complex relationship with core Tb that can be roughly separated into four regions (Fig. 2). The first region [labeled as (a) in Fig. 2] comprises a fall of ∼2°C in core Tb with a concurrent fall in heart rate from ∼600 to ∼300 bpm. The second region [labeled as (b) in Fig. 2] showed a much more gradual fall in heart rate as a function of core Tb as the mouse entered into a bout of torpor. The third region [labeled as (c) in Fig. 2] showed an increase in heart rate with virtually no change in core Tb. Finally, the fourth region [labeled as (d) in Fig. 2] showed a gradual increase in heart rate as the animal aroused from the torpor bout. At any given core Tb during the torpor bout, heart rate was slower during entrance into the bout than during emergence from the bout. For example, when core Tb was in the range of 29.5°C–30.5°C during entrance into torpor, the average heart rate for each mouse was only 40% of the heart rate measured over the same core Tb range as the mouse emerged from torpor (194 ± 15 bpm vs. 501 ± 11 bpm, for entrance and emergence, respectively). The minimum heart rate obtained throughout the 23-h period was 158 ± 20 bpm, with a minimum heart rate range of 78–335 bpm. The relationship between heart rate and core Tb was analyzed between the core Tbs of 31°C, the threshold core Tb for torpor (16), and the lowest measured core Tb. This relationship was quantified during both cooling [region (b) of Fig. 2] and rewarming [region (d) of Fig. 2] for the six mice that entered the deepest torpor bouts. When calculated for each individual mouse, heart rate during cooling displayed temperature dependence with a Q10 of 2.61 ± 0.18, and rewarming showed temperature dependence with a Q10 of 2.03 ± 0.07, with the rewarming coefficient significantly less than the cooling coefficient. When heart rate was averaged for these mice during entrance into torpor at core Tbs between 22°C and 31°C, the aggregate curve also showed a significant exponential relationship between core Tb and heart rate, with a Q10 of 2.52 (Fig. 3).
Table 1.
Baseline heart rate, core Tb, and activity of C57BL/6J mice during the dark and light phases while housed at 19°C
| Heart rate, beats/min | Core Tb, °C | Activity, AU | |
|---|---|---|---|
| Dark phase | 631±14* | 36.9±0.2* | 11.7±1.9* |
| Light phase | 579±12 | 36.2±0.2 | 5.0±0.8 |
P < 0.05 vs. light phase. AU, arbitrary units.
Fig. 1.
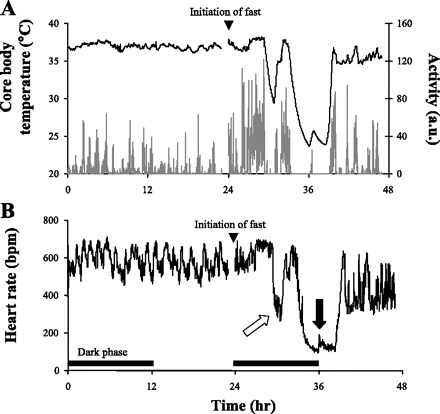
Typical core body temperature (Tb), activity, and heart rate response to fasting in a C57BL/6J female adult mouse. This mouse was implanted with a telemeter that detects core Tb (black line in A), activity (gray line in A), and electrical activity of the heart, from which heart rate was derived (B). The tracing spans 48 h, with the dark phases noted in B. Ambient temperature (Ta) was 19°C over both days. The mouse was fasted at the beginning of the dark phase of the second 24-h period. This mouse experienced a very shallow torpor bout ∼6 h after the initiation of the fast, as marked by the white arrow in B, and a much deeper bout a few hours later, as marked by the black arrow in part B.
Fig. 2.
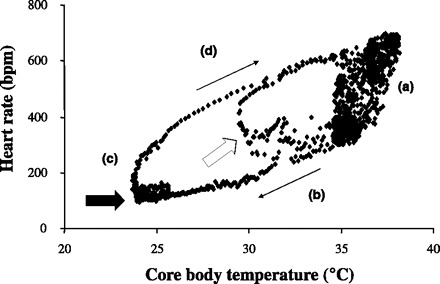
Heart rate/core Tb relationship during torpor in the mouse. The data from the mouse shown in Fig. 1 are shown here. When heart rate is plotted as a function of core Tb, a complex relationship is observed with four different regions, labeled (a), (b), (c), and (d). Please see text for discussion of heart rate control in each of these regions. The white and black arrows correspond to the same arrows in B of Fig. 1. The thin arrows show the progression of the torpor bout in time.
Fig. 3.
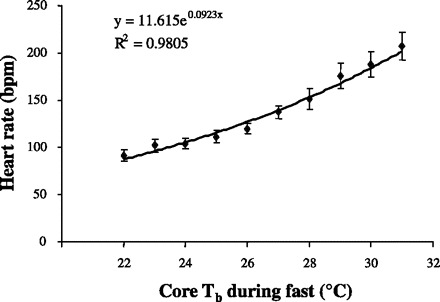
The heart rate in torpid mice shows a strong core Tb dependence. Mice implanted with EKG/temperature telemeters were fasted. The average heart rate was calculated at Tbs between 22°C and 31°C. Heart rate showed a significant exponential relationship with core Tb, with a Q10 of 2.52 for the torpid mice.
Blood pressure measurements.
While fed ad libitum and housed at a Ta of 19°C, the 23 h systolic arterial pressure of euthermic mice was 118.6 ± 3.2 mmHg, mean arterial pressure was 106.4 ± 3.0 mmHg, diastolic arterial pressure was 92.1 ± 4.0 mmHg, and the heart rate was 612 ± 6 bpm. These mice showed daily rhythms in all measurements (Table 2). When the mice were fasted, all entered torpor bouts, as assessed by similar heart rate tracings as obtained from the fasted mice implanted with EKG/temperature telemeters. Fig. 4 shows the blood pressure, heart rate, and general cage activity responses to fasting in a typical mouse. Blood pressures fell during torpor with the minimum pressures during torpor significantly lower than the minimum pressures observed while in euthermia (Fig. 5). The lowest recorded diastolic pressure under either condition (35.3 mmHg) was obtained from a torpid mouse. When heart rate was plotted as a function of mean arterial pressure (Fig. 6A), it was observed that at any given mean arterial pressure between 75 and 100 mmHg, the mean heart rate was lower, 25–35%, in the torpid state. No measurements of mean arterial pressures below 75 mmHg were observed in euthermic mice.
Table 2.
Baseline cardiovascular measurements and activity of C57BL/6J mice during the dark and light phases while housed at 19°C
| Heart rate, beats/min | Systolic BP, mmHg | Mean BP, mmHg | Diastolic BP, mmHg | Pulse P, mmHg | Activity, AU | |
|---|---|---|---|---|---|---|
| Dark phase | 658±3* | 126.8±4.1* | 114.5±2.8* | 99.8±2.5* | 30.4±3.7* | 8.1±1.3* |
| Light phase | 562±10 | 109.7±3.8 | 97.5±4.5 | 83.7±6.0 | 28.6±3.3 | 3.1±0.7 |
P < 0.05 vs. light phase.
Fig. 4.
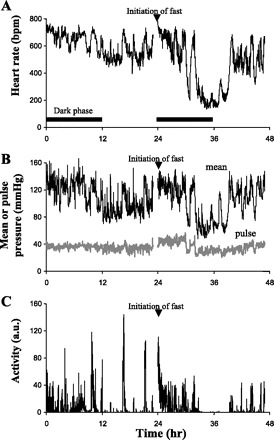
Heart rate, mean arterial pressure, pulse pressure, and activity of a fasted mouse over a 23-h period. These typical tracings were obtained over 48 h from a C57BL/6J mouse implanted with a blood pressure telemeter. A: dark phases are shown. The mouse was fasted at the beginning of the dark phase on the second day. Ta was 19°C over both days. These tracings show a similar pattern of heart rate (A) and activity (C) as seen in Fig. 1. Mean arterial blood pressure (B) declines with both heart rate and inactivity. Minimum heart rate and minimum mean arterial pressure in this mouse was 135 bpm and 48 mmHg, respectively.
Fig. 5.
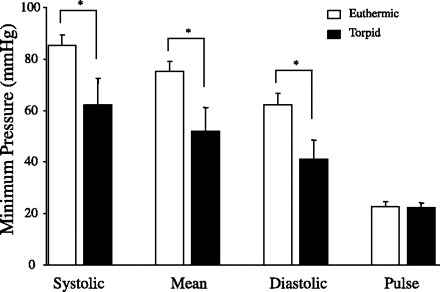
Minimum arterial pressures in the mouse over two 23-h periods. Mice were housed at a Ta of 19°C for 1 day while fed (euthermic, open bars). The following day, the mice were fasted and all entered bouts of torpor (torpid, solid bars). Minimum pulse pressure was not significantly different between the two states, whereas minimum systolic, mean, and diastolic arterial pressures were all significantly lower in the torpid state than the minimum pressures in the euthermic state. *P < 0.05 in euthermic vs. torpid.
Fig. 6.

Heart rate, mean arterial pressure, and an index of total peripheral resistance during a torpor bout. A: heart rate and mean arterial pressure data are shown from mice over two different 23-h periods: in a euthermic state and torpid state. Heart rate was calculated for each mouse in each condition over the mean blood pressure ranges shown. Mean blood pressure did not fall below 75 mmHg in the euthermic state. Mice in torpor displayed a significantly lower heart rate than the heart rate over the same mean arterial pressure range in euthermia. Data are expressed as means ± SE. *P < 0.05 vs. euthermic state. B: index of TPR is plotted over two 23-h periods for the same mouse. During “euthermia,” the mouse had access to food and water. The torpid trace corresponds to a fasted state (starting at time 0) and corresponds to the same data set shown in Fig. 4. Note the three-fold increase in the TPR index during torpor relative to the euthermic state. The TPR index was calculated using the equation: TPR = mean blood pressure / [heart rate × pulse pressure].
DISCUSSION
The laboratory mouse is nearly ubiquitous in medical research and is often used in fasting research, yet the cardiovascular consequences of fasting in a mouse are poorly understood. M. musculus will enter a bout of torpor during negative energy balance, where core Tb and metabolic rate fall dramatically (27), but only when fasted at a relatively cool Ta, and not when housed near or within their thermoneutral zone (42). The mice used in the current study entered a bout of torpor within ∼6 h of the initiation of the fast (e.g., see Figs. 1 and 4). Three previous investigations have examined heart rate and blood pressure in fasted M. musculus (32, 41, 42). While two of these investigations (one from our laboratory) obtained data, which very likely occurred in torpor bouts (32, 42), neither investigation provided quantitative data concerning the magnitude of the changes, nor were any relationships drawn between heart rate, blood pressure, and Tb (32, 42). The third investigation excluded any measurements made during torpor (41). Therefore, the data presented here describe the first quantitative assessment of core Tb, heart rate, and blood pressure that occur in mice during bouts of fasting-induced torpor.
Heart rate control.
It is well known that heart rate falls during entrance into a torpor bout in both deep hibernators and daily heterotherms (21). This is true for C57BL/6 mice as well [current study and ref (42)]. When housed at a relatively cool Ta of 19°C, these mice had elevated resting heart rates (Table 1) compared with resting heart rates when housed near or within their thermoneutral zone (35). An elevated heart rate in mice at this Ta has been shown to be mediated by the sympathetic nervous system (34). Before a significant drop in core Tb (to ∼35°C) occurred in the fasted mouse, heart rate rapidly declined from ∼600 bpm to 300 bpm. That is, this initial decline in heart rate, designated as region (a) in Fig. 2, occurred before the decline in core Tb during the cooling phase of the torpor bout. The bradycardia before the decline in core Tb strongly implicates engagement of the parasympathetic arm (PNS) of the autonomic nervous system and inhibition of the sympathetic arm (SNS) to slow heart rate. This is consistent with other work that shows a dominant influence of the PNS over the heart during entrance to torpor (14, 44, 45). Further, the steep decline in heart rate before a significant change in core Tb parallels the active metabolic rate suppression observed in numerous species before a significant decline in core Tb at the initiation of torpor (10).
As core Tb cools further during entrance into torpor, region (b) of Fig. 2, heart rate slows, exhibiting a Q10 of ∼2.5, suggesting that the decline in heart rate can be attributed to the cooling of the mouse alone. The temperature-dependent bradycardia over the ∼10°C fall in Tb during entrance into torpor in the mouse also mirrors the passive decline in metabolic rate as the torpid animal cools (10). However, this is not to exclude the potential role of the PNS at these lower core Tbs. Two lines of evidence suggest that the PNS is still engaged at a high level, but superimposed on that regulation, is the bradycardic effects of cooling core Tb. First, administration of atropine, an antagonist to the PNS neurotransmitter acetylcholine, during steady state torpor results in an elevation in heart rate in another daily heterotherm, the white-footed mouse (23). Second, the heart rate of an isolated perfused mouse heart maintained at 30°C is ∼250 bpm (11), well above the 180 bpm observed in the current study when core Tb was 30°C (Fig. 3). The role of the PNS in heart rate control remains to be tested in M. musculus at low core Tbs.
In region (c) of Fig. 2, heart rate rose 2- to 3-fold with no appreciable change in core Tb. That is, the mouse's heart rate rose considerably before any elevation in core Tb, an observation also made from a deep hibernator (31). This tachycardia is most likely mediated by activation of the SNS and withdrawal of PNS control over the heart. Activation of the SNS to many tissues, including brown fat (2, 29) and the heart (20), appears important for arousal from the torpid state.
As the mouse warms further, region (d), heart rate continued to rise, exhibiting a Q10 of 2.0, again suggesting that the elevation in heart rate can be explained by the rise in core Tb alone. The calculated Q10 for the laboratory mouse is similar to the calculated Q10 of 2.2 for heart rate during emergence from torpor in another daily heterotherm, the shrew (7). Curiously, the Q10 during rewarming was significantly less than the Q10 during cooling in the mouse, suggesting a complex external regulation of intrinsic rate during entrance and/or emergence. As a result of the heavy SNS influence on heart rate during emergence from torpor, heart rate during rewarming was 2.5-fold that during entrance at the same core Tb of 30°C, and twice that reported for an isolated mouse heart with no autonomic influence (11). Compared with euthermic heart rate (600–700 bpm), the rewarming heart rate (400–600 bpm) is substantially lower, despite the heavy influence of SNS in both cases, illustrating the importance of core Tb on heart rate control during emergence from torpor. A lower heart rate during rewarming compared with the pretorpor heart rate is also seen in another daily heterotherm, the Djungarian hamster (20), as well as in the deep hibernating ground squirrel (4).
The minimum heart rate of 78 bpm in the torpid laboratory mouse found here is consistent with the minimum heart rate of the torpid white-footed mouse, an animal of similar size to the lab mouse (23). The heart rate during torpor is core Tb dependent. Indeed, the tracings in Figs. 1 and 4 show abbreviated sharp declines in heart rate, associated with shallow drops in core Tb. This correlation of depth of torpor and heart rate is reminiscent of the Tb-dependent minimum heart rates seen in multiple days of fasting in the mousebird (28). The laboratory mouse, which is a daily heterotherm and exhibits a minimum core Tb of ∼20°C, has a heart rate well above that of torpid hibernators, including the ground squirrel with a minimum heart rate of 10 bpm at a Tb of 5°C (43), and the Western pygmy possum with a minimum heart rate of 12 bpm at a Tb of 9°C (45). If the relationship between core Tb and heart rate for the mouse is extended to the core Tb of a hibernator, the regression analysis in Fig. 3 predicts a heart rate of ∼18 bpm at a core Tb of 5°C and ∼27 bpm at a core Tb of 9°C. Although the mouse heart fails at temperatures below 10°C (11), the predicted minimum heart rates between daily heterotherms (or at least the mouse) is greater than that of hibernators. As body size is inversely proportional to resting heart rate and possibly torpid heart rate, the comparison between the torpid heart rate of a ground squirrel (body mass ∼150 g) and of a mouse (∼22 g) may be complicated by the differences in body size. However, the Western pygmy possum is only moderately smaller (∼15 g) than the mouse but still has a substantially lower torpid heart rate than that predicted for the mouse at the same core Tb. We conclude that the difference in core Tb explains a large part, but not all, of the difference in torpid heart rates between daily heterotherms and deep hibernators.
Blood pressure control.
While heart rate has been examined in some detail in several species in torpor, blood pressure measurements have been extensively studied in only a single torpid organism, the ground squirrel (17, 18). This deep hibernator shows a minimum arterial pressure of ∼20 mmHg at a core Tb of ∼10°C. The laboratory mouse had minimum mean arterial pressures 2.5-fold greater (∼50 mmHg) than those in the torpid ground squirrel. On the basis of the heart rates obtained from the pressure telemeter in the torpid mouse and using the relationship between heart rate and core Tb in torpid mice in Fig. 3, we can predict that core Tb reached ∼28°C at its minimum in this group of mice. As with the heart rate, we found that blood pressure fell precipitously during entrance into torpor. Mean arterial pressure typically fell by 70 mmHg within ∼1–2 h. When plotted as a function of mean arterial pressure, heart rate was much lower in the torpid than euthermic state (Fig. 6A), likely because of core Tb differences. This gives insight into total peripheral resistance (TPR). As mean arterial pressure is calculated as mean arterial pressure = HR × SV × TPR, where SV is stroke volume. While SV was not measured herein, pulse pressure was measured. The minimum pulse pressure was not different between the two states (e.g., during euthermia and during torpor; see Fig. 5). If the assumption is made that compliance is unchanged and that pulse pressure is a reasonable proxy for stroke volume, then it follows that minimum SV was likely similar between the two states. Therefore, at the same arterial pressure, a lower heart rate in the torpid state suggests an increase in TPR. When an index for TPR was generated using heart rate, pulse pressure, and mean arterial pressure, we estimate a 3-fold increase in TPR when heart rate was at its nadir during the bout of torpor (Fig. 6B). An increase in TPR would be mediated by sympathetic activation of smooth muscle beds surrounding blood vessels. This is congruent with recent findings that SNS-mediated vasoconstriction plays a critical role in torpor in mice and hamsters (26, 37).
Perspectives and Significance
Control of the cardiovascular system, including chronotropy, inotropy, and vascular resistance, during a bout of torpor, appears complex. While the PNS drives the bradycardia during the cooling phase of torpor, the SNS is likely simultaneously activating white fat (37) and peripheral smooth muscle beds, leading to an increase in TPR (Fig. 6B). During the rewarming phase, regional activity of the SNS appears important as well as SNS drives tachycardia but TPR falls, perhaps because of SNS withdrawal from vascular beds and subsequent vasodilation. Future studies should be directed toward testing the role of the autonomic nervous system in governing aspects of cardiovascular control during torpor. Numerous questions arise concerning the relationship between torpor and cardiovascular control. Is contractility of the heart maintained during cooling (as assessed by little change in pulse pressure) a result of increased preload? Is the increase in TPR seen during the bout of torpor regional (i.e., targeted to skin/tail vasculature) or is it a more general phenomenon that offsets the fall in systolic pressure and maintains perfusion pressure to vital tissues? Is the baroreflex reset during torpor, as heart rate and blood pressure fall in concert? Is the fall in blood pressure requisite for the fall in core Tb? Future studies should also be directed toward gathering additional cardiovascular measurements in other daily heterotherms and in deep hibernators. Although it is convenient to assign heterothermic animals into a group of either daily heterotherms or deep hibernators, the differences may be in name only, with no fundamental physiological differences between the two groups. Our speculative data comparing the heart rates of Western pygmy possum and the mouse suggest deep hibernation and daily shallow torpor are distinct physiological states, as has been suggested by Geiser (9, 12) However, more extensive understanding of the cardiovascular changes and their control should provide a good deal of physiological data to address this debate.
GRANT
This work was supported by a NIH Grant R15 HL081101-01 (to S. J. S.).
REFERENCES
- 1.Bouthegourd JC, Martin JC, Gripois D, Roseau S, Tome D, Even PC. Fat-depleted CLA-treated mice enter torpor after a short period of fasting. Appetite 42: 91–98, 2004 [DOI] [PubMed] [Google Scholar]
- 2.Cannon B, Nedergard J. Brown adipose tissue: function and physiological significance. Physiol Rev 84: 277–359, 2004 [DOI] [PubMed] [Google Scholar]
- 3.Cariou B, Bouchaert E, Abdelkarim M, Dumont J, Caron S, Fruchart JC, Burcelin R, Kuipers F, Staels B. FXR-deficiency confers increased susceptibility to torpor. FEBS Lett 581: 5191–5198, 2007 [DOI] [PubMed] [Google Scholar]
- 4.Chatfield PO, Lyman CP. Circulatory changes during process of arousal in the hibernating hamster. Am J Physiol 163: 566–574, 1950 [DOI] [PubMed] [Google Scholar]
- 5.Cranford JA. Body temperature, heart rate and oxygen consumption of normothermic and heterothermic Western jumping mice (Zapus princeps). Comp Biochem Physiol A 74: 595–599, 1983 [DOI] [PubMed] [Google Scholar]
- 6.Elvert R, Heldmaier G. Cardiorespiratory and metabolic reactions during entrance into torpor in dormice, Glis glis J Exp Biol 208: 1373–1383, 2005 [DOI] [PubMed] [Google Scholar]
- 7.Fons R, Sender S, Peters T, Jurgens K. Rates of rewarming, heart and respiratory rates and their significance for oxygen transport during arousal from torpor in the smallest mammal, the Etruscan shrew Suncus etruscus J Exp Biol 200: 1451–1458, 1997 [DOI] [PubMed] [Google Scholar]
- 8.Gavrilova O, Leon LR, Marcus-Samuels B, Mason MM, Castle AL, Refetoff S, Vinson C, Reitman ML. Torpor in mice is induced by both leptin-dependent and -independent mechanisms. Proc Natl Acad Sci USA 96: 14623–14628, 1999 [DOI] [PMC free article] [PubMed] [Google Scholar]
- 9.Geiser F. Evolution of daily torpor and hibernation in birds and mammals: Importance of body size. Clin Exp Pharmacol Physiol 25: 736–739, 1998 [DOI] [PubMed] [Google Scholar]
- 10.Geiser F. Metabolic rate and body temperature reduction during hibernation and daily torpor. Annu Rev Physiol 66: 239–274, 2004 [DOI] [PubMed] [Google Scholar]
- 11.Geiser F, Baudinette RV, McMurchie EJ. The effect of temperature on isolated perfused hearts of heterothermic marsupials. Comp Biochem Physiol A 93: 331–335, 1989 [DOI] [PubMed] [Google Scholar]
- 12.Geiser F, Ruf T. Hibernation versus daily torpor in mammals and birds—physiological variables and classification of torpor patterns. Physiol Zool 68: 935–966, 1995 [Google Scholar]
- 13.Gluck EF, Stephens N, Swoap SJ. Peripheral ghrelin deepens torpor bouts in mice through the arcuate nucleus neuropeptide Y signaling pathway. Am J Physiol Regul Integr Comp Physiol 291: R1303–R1309, 2006 [DOI] [PubMed] [Google Scholar]
- 14.Harris M, Milsom W. Parasympathetic influence on heart rate in euthermic and hibernating ground squirrels. J Exp Biol 198: 931–937, 1995 [DOI] [PubMed] [Google Scholar]
- 15.Himms-Hagen J. Food restriction increases torpor and improves brown adipose tissue thermogenesis in ob/ob mice. Am J Physiol Endocrinol Metab 248: E531–E539, 1985 [DOI] [PubMed] [Google Scholar]
- 16.Hudson JW, Scott IM. Daily torpor in the laboratory mouse, Mus Musculus Var Albino. Physiol Zool 52: 205–218, 1979 [Google Scholar]
- 17.Lyman CP, O'Brien RC. Autonomic control of circulation during hibernating cycle in ground squirrels. J Physiol London 168: 477–499, 1963 [DOI] [PMC free article] [PubMed] [Google Scholar]
- 18.Lyman CP, O'Brien RC. Circulatory changes in the thirteen-lined ground squirrel during the hibernating cycle. Bull Mus Comp Zool Harv 124: 353–372, 1960 [Google Scholar]
- 19.Lyman CP, Willis JS, Malan A, Wang LCH. Hibernation and Torpor in Mammals and Birds. New York: Academic, 1982
- 20.Mertens A, Stiedl O, Steinlechner S, Meyer M. Cardiac dynamics during daily torpor in the Djungarian hamster (Phodopus sungorus). Am J Physiol Regul Integr Comp Physiol 294: R639–R650, 2008 [DOI] [PubMed] [Google Scholar]
- 21.Milsom WK, Zimmer MB, Harris MB. Regulation of cardiac rhythm in hibernating mammals. Comp Biochem Physiol A 124: 383–391, 1999 [DOI] [PubMed] [Google Scholar]
- 22.Miyazawa S, Shimizu Y, Shiina T, Hirayama H, Morita H, Takewaki T. Central A1-receptor activation associated with onset of torpor protects the heart against low temperature in the Syrian hamster. Am J Physiol Regul Integr Comp Physiol 295: R991–R996, 2008 [DOI] [PubMed] [Google Scholar]
- 23.Morhardt JE. Heart rates, breathing rates and effects of atropine and acetylcholine on white-footed mice (Peromyscus Sp) during daily torpor. Comp Biochem Physiol 33: 441–457, 1970 [DOI] [PubMed] [Google Scholar]
- 24.Morton SR. Ecological significance of torpor in an insectivorous marsupial, Sminthopsis crassicaudata, and House Mouse, Mus musculus J Therm Biol 3: 88, 1978 [Google Scholar]
- 25.Morton SR. Torpor and nest-sharing in free-living Sminthopsis crassicaudata (Marsupialia) and Mus musculus (Rodentia). J Mammal 59: 569–575, 1978 [Google Scholar]
- 26.Osborne PG, Sato J, Shuke N, Hashimoto M. Sympathetic α-adrenergic regulation of blood flow and volume in hamsters arousing from hibernation. Am J Physiol Regul Integr Comp Physiol 289: R554–R562, 2005 [DOI] [PubMed] [Google Scholar]
- 27.Overton JM, Williams TD. Behavioral and physiologic responses to caloric restriction in mice. Physiol Behav 81: 749–754, 2004 [DOI] [PubMed] [Google Scholar]
- 28.Schaub R, Prinzinger R. Long-term telemetry of heart rates and energy metabolic rate during the diurnal cycle in normothermic and torpid African blue-naped mousebirds (Urocolius macrourus). Comp Biochem Physiol A 124: 439–445, 1999 [DOI] [PubMed] [Google Scholar]
- 29.Smith RE, Hock RJ. Brown fat: Thermogenic effector of arousal in hibernators. Science 140: 199–200, 1963 [DOI] [PubMed] [Google Scholar]
- 30.Sowden GL, Drucker DJ, Weinshenker D, Swoap SJ. Oxyntomodulin increases intrinsic heart rate in mice independent of the glucagon-like peptide-1 receptor. Am J Physiol Regul Integr Comp Physiol 292: R962–R970, 2007 [DOI] [PubMed] [Google Scholar]
- 31.Strumwasser F. Thermoregulatory, brain and behavioral mechanisms during entrance into hibernation in the squirrel, Citellus beecheyi Am J Physiol 196: 15–22, 1959 [DOI] [PubMed] [Google Scholar]
- 32.Swoap SJ. Altered leptin signaling is sufficient, but not required, for hypotension associated with caloric restriction. Am J Physiol Heart Circ Physiol 281: H2473–H2479, 2001 [DOI] [PubMed] [Google Scholar]
- 33.Swoap SJ, Gutilla MJ, Liles LC, Smith RO, Weinshenker D. The full expression of fasting-induced torpor requires β3-adrenergic receptor signaling. J Neurosci 26: 241–245, 2006 [DOI] [PMC free article] [PubMed] [Google Scholar]
- 34.Swoap SJ, Li C, Wess J, Parsons AD, Williams TD, Overton JM. Vagal tone dominates autonomic control of mouse heart rate at thermoneutrality. Am J Physiol Heart Circ Physiol 294: H1581–H1588, 2008 [DOI] [PubMed] [Google Scholar]
- 35.Swoap SJ, Overton JM, Garber G. Effect of ambient temperature on cardiovascular parameters in rats and mice: a comparative approach. Am J Physiol Regul Integr Comp Physiol 287: R391–R396, 2004 [DOI] [PubMed] [Google Scholar]
- 36.Swoap SJ, Rathvon M, Gutilla M. AMP does not induce torpor. Am J Physiol Regul Integr Comp Physiol 293: R468–R473, 2007 [DOI] [PubMed] [Google Scholar]
- 37.Swoap SJ, Weinshenker D. Norepinephrine controls both torpor initiation and emergence via distinct mechanisms in the mouse. PLoS ONE 3: e4038, 2008 [DOI] [PMC free article] [PubMed] [Google Scholar]
- 38.Tokuyama K, Himms-Hagen J. Brown adipose tissue thermogenesis, torpor, and obesity of glutamate-treated mice. Am J Physiol Endocrinol Metab 251: E407–E415, 1986 [DOI] [PubMed] [Google Scholar]
- 39.Tomlinson S, Withers PC, Cooper C. Hypothermia versus torpor in response to cold stress in the native Australian mouse Pseudomys hermannsburgensis and the introduced house mouse Mus musculus Comp Biochem Physiol 148: 645–650, 2007 [DOI] [PubMed] [Google Scholar]
- 40.Webb GP, Jagot SA, Jakobson ME. Fasting-induced torpor in Mus musculus and its implications in the use of murine models for human obesity studies. Comp Biochem Physiol A 72: 211–219, 1982 [DOI] [PubMed] [Google Scholar]
- 41.Williams TD, Chambers JB, Gagnon SP, Roberts LM, Henderson RP, Overton JM. Cardiovascular and metabolic responses to fasting and thermoneutrality in Ay mice. Physiol Behav 78: 615–623, 2003 [DOI] [PubMed] [Google Scholar]
- 42.Williams TD, Chambers JB, Henderson RP, Rashotte ME, Overton JM. Cardiovascular responses to caloric restriction and thermoneutrality in C57BL/6J mice. Am J Physiol Regul Integr Comp Physiol 282: R1459–R1467, 2002 [DOI] [PubMed] [Google Scholar]
- 43.Zimmer MB, Milsom WK. Effects of changing ambient temperature on metabolic, heart, and ventilation rates during steady state hibernation in golden mantled ground squirrels (Spermophilus lateralis). Physiol Biochem Zool 74: 714–723, 2001 [DOI] [PubMed] [Google Scholar]
- 44.Zosky GR. The parasympathetic nervous system: its role during torpor in the fat-tailed dunnart (Sminthopsis crassicaudata). J Comp Physiol 172: 677–684, 2002 [DOI] [PubMed] [Google Scholar]
- 45.Zosky GR, Larcombe AN. The parasympathetic nervous system and its influence on heart rate in torpid western pygmy possums, Cercatetus concinnus (Marsupialia: Burramyidae). Zoology 106: 143–150, 2003 [DOI] [PubMed] [Google Scholar]