

SUMMARY
Little is known with certainty about the evolution of protein structures in general and the degree of protein structure conservation over planetary time scales in particular. Here we report the X-ray crystal structures of seven laboratory resurrections of Precambrian thioredoxins dating back up to ~4 billion years before present. Despite considerable sequence differences compared with extant enzymes, the ancestral proteins display the canonical thioredoxin fold while only small structural changes have occurred over 4 billion years. This remarkable degree of structure conservation since a time near the last common ancestor of life supports a punctuated-equilibrium model of structure evolution in which the generation of new folds occurs over comparatively short periods of time and is followed by long periods of structural stasis.
INTRODUCTION
Little is known with certainty about the evolution of protein structures, despite the substantial number of different protein folds revealed by the structures deposited in the Protein Data Bank. As elaborated below, several facts contribute to this undesirable situation.
While it is generally admitted that structures change at a slower pace than sequences do, evidence has accumulated in recent years supporting that protein structures are not invariant and, therefore, that they may change during the course of evolution (Grishin, 2001; Murzin, 2008; Sikosek et al., 2012; Taylor, 2007; Tokuriki and Tawfik, 2009; Valas et al., 2009). In fact, due to the so-called shape-covering properties of the mapping of sequence into structure (Caetano-Anolles et al., 2009), different structures may be just a few mutational steps away in sequence space, as has been experimentally demonstrated (Cordes et al., 1999; He et al., 2012). Moreover, the possibility of convergent evolution of folds is generally accepted and, hence, common ancestry does not necessarily follow from structural similarity (Grishin, 2001; Krishna and Grishin, 2004; Murzin, 2008; Orengo et al., 1994; Schaeffer and Daggett, 2011; Taylor, 2007). That is, transitions between folds and convergent evolution of folds may both conceivably occur during protein evolution. Thus, the identification of basic principles of structure evolution may be difficult to extract from the study of extant protein structures(Caetano-Anolles et al., 2009; Murzin, 2008). Consequently, many current fold classifications are phenetic (based on a metric of structure similarity) and the viability of phyletic classifications (based on evolutionary relationships) remains an open issue (Murzin, 2008; Valas et al., 2009). As a result, age estimates for protein folds are uncertain and are based upon indirect methods, such as the census of (assigned) folds in genomes (Caetano-Anolles et al., 2009; Winstanley et al., 2005). Even the usefulness of the fold concept is at stake, as several authors have discussed that fold space must be viewed as continuous rather than discrete (Honig, 2007; Sadreyev et al., 2009; Xie and Bourne, 2008).
The above observations summarize what may be viewed as a particularly clear example of the limitations of “horizontal” approaches (i.e., based on the comparison between extant proteins) to molecular evolution (Harms and Thornton, 2010). In fact, some recent work has used sequence reconstruction analyses targeting ancestral states represented by nodes in phylogenetic trees and the subsequent laboratory “resurrection” of their encoded proteins (Benner et al., 2007; Harms and Thornton, 2010) to address important issues in protein evolution, such as the role of epistasis in formation of new function (Ortlund et al., 2007), the evolution of complex biomolecular machines (Finnigan et al., 2012), the mechanisms of evolutionary innovation through gene duplication (Voordeckers et al., 2012) and the adaptation of proteins to changing environments over planetary time scales (Gaucher et al., 2008; Perez-Jimenez et al., 2011; Risso et al., 2013). Here we explore the potential of this “vertical” approach to probe the evolution of protein structures. To this end, we have obtained for the first time the 3D structures of several laboratory resurrections of Precambrian enzymes dating back up to ~4 billion years (Gyr), i.e., up to a time close to the origin of life. In particular, we target thioredoxin enzymes corresponding to the last bacterial common ancestor (LBCA), the last archaeal common ancestor (LACA), the archaeal-eukaryotic common ancestor (AECA), the last eukaryotic common ancestor (LECA), the last common ancestor of fungi and animals (LAFCA), the last common ancestor of the cyanobacterial, deinococcus and thermus groups (LPBCA) and the last common ancestor of γ-proteobacteria (LGPCA). As briefly described below, we recently “resurrected” and characterized these proteins in terms of stability and function (Perez-Jimenez et al., 2001).
We used ~200 diverse extant thioredoxin sequences encompassing the three domains of life to construct a highly-articulated phylogenetic tree and subsequently perform a maximum-likelihood sequence reconstruction targeting several Precambrian nodes during thioredoxin evolution (Perez-Jimenez et al., 2011). The phylogenetic tree obtained was sufficiently close to an accepted organism phylogeny to allow us to assign the reconstructed nodes to well-defined Precambrian ancestors (see above) and to date those nodes (see Figure 1A) (Hedges and Kumar, 2009; for further details, see Perez-Jimenez et al., 2011). We resurrected in the laboratory the proteins encoded by the reconstructed sequences and determined their stability and catalytic features. We found an increase in denaturation temperature of about 30 degrees upon “travelling back in time” several billion years. This result afforded support for our ancestral reconstruction exercise, as it is consistent with the generally proposed thermophilic character of Precambrian life and, indeed, similar stability enhancements have been reported in Precambrian resurrection studies on other proteins systems, such as elongation factors (Gaucher et al., 2008) and β-lactamases (Risso et al., 2013). It is also noteworthy that some proposed scenarios for the primitive Earth environment include acidic ancestral oceans and that both, single-molecule and bulk-solutions assays indicated that the oldest resurrected thioredoxins were actually well-adapted to function at acidic pH (Perez-Jimenez et al., 2011). Overall, the highly enhanced stability and the catalysis at acidic pH in the older thioredoxins provided evidence of adaptation to proposed hot and acidic conditions of the ancient oceans (Perez-Jimenez et al., 2011).
Figure 1. Overall structural features of extant thioredoxins and laboratory resurrections of Precambian thioredoxins.

(A) Schematic phylogenetic tree showing the geological time (Perez-Jimenez et al., 2011) and the phylogenetic nodes targeted in this work. (B) Spatial course of the polypeptide chain for the human and E. coli thioredoxins, as well as for the several laboratory resurrections of Precambrian thioredoxins studied in this work. The color code is that given in panel A. (C) Sequences (Perez-Jimenez et al., 2011) and secondary structure assignments for the extant thioredoxins and the laboratory resurrections of Precambrian thioredoxins studied in this work. See Table S1 for RMSD and sequence identity values for all thioredoxin structure pairs.
Here we report and analyze the X-ray crystal structures of the laboratory resurrections of Precambrian thioredoxins we previously studied in terms of stability and catalysis. We find a remarkable degree of structure conservation up to a time close to the origin of life, a result that seems consistent with a punctuated-equilibrium model of structure evolution in which the generation of new folds occurs over comparatively short periods of time and is followed by long periods of structural stasis. Furthermore, the results and analyses reported here support that laboratory resurrection targeting Precambrian nodes followed by 3D-structure determination can be a powerful approach to explore the poorly understood evolution of protein structures.
RESULTS AND DISCUSSION
The seven Precambrian thioredoxins were crystallized by either the counter-diffusion or the hanging drop vapor diffusion method. The X-ray data ranged from high to medium resolution limit (Table 1 and Table S4) and, therefore, conclusions drawn from the 3D model are well supported. A general view of the seven putative ancestral structures (Figures 1B, 1C, 2 and Table S1) shows that each displays the topology of the thioredoxin fold consisting of a N-terminal β1α1β2α2β3α3 and C-terminal β4β5α4 domains arranged in a central core of three parallel and two antiparallel strands of pleated β-sheet surrounded by the four helices. Furthermore, no large differences emerge when the putative ancestral structures are compared among themselves (or when they are compared with the extant human and E. coli thioredoxins), in terms of polar and apolar solvent-accessible surface areas, numbers of hydrogen bonds and salt bridges, and surface charge distributions (Table S2 and Figure S1).
Table 1.
Data collection and refinement statistics (values in parentheses are for highest-resolution shell). See Table S4 for crystallization methods, conditions and data collection source and molecular replacement (MR) searching model.
| Protein name | LPBCA | LECA | AECA | LACA | LAFCA | LGPCA | LBCA |
|---|---|---|---|---|---|---|---|
| PDB identifier | 2YJ7 | 2YOI | 3ZIV | 2YNX | 2YPM | 2YN1 | 4BA7 |
|
| |||||||
| Data collection | |||||||
| Space Group | P 1 21 1 | C 1 2 1 | P 1 21 1 | P 1 | P 21 21 21 | P 1 21 1 | F 4 3 2 |
| Cell dimensions a, b, c (Å) | 55.1, 30.2, 59.0 | 58.4, 47.8, 73.8 | 37.6, 48.8, 91.1 | 32.2, 36.3, 48.1 | 37.5, 42.8, 55.9 | 36.1 62.9 42.9 | 192.7 |
| β (°) | 117.0 | 98.5 | 93.2 | 108.0 | 90.0 | 109.0 | 90.0 |
| ASU | 2 | 2 | 3 | 2 | 1 | 2 | 2 |
| Resolution (Å) * | 48.45 – 1.65 (1.74 – 1.65) | 36.6 – 1.30 (1.37 – 1.30) | 45.51 – 2.65 (2.74 – 2.65) | 45.32 – 1.75 (1.84 – 1.75) | 20.00 – 2.20 (2.28 – 2.20) | 34.09 – 1.30 (1.35 – 1.30) | 58.10 – 2.45 (2.53 – 2.45) |
| Rsym (%)* | 4.5 (34.1) | 4.7 (6.6) | 6.5 (59.9) | 10.5 (39.6) | 10.3 (48.7) | 5.6 (42.8) | 13.0 (93.4) |
| I/σI * | 20.10 (3.80) | 18.40 (7.90) | 16.21 (3.24) | 8.50 (2.70) | 23.26 (4.95) | 12.47 (2.68) | 12.92 (4.18) |
| Completeness (%)* | 99.8 (100.0) | 94.4 (89.8) | 97.8 (97.9) | 97.6 (88.7) | 99.0 (100.0) | 97.2 (97.7) | 99.9 (100.0) |
| Unique reflections* | 21198 (712) | 46574 | 9592 | 18887 | 4904 | 43308 | 11808 |
| Multiplicity* | 3.6 (3.7) | 2.0 (1.8) | 4.0 (4.0) | 1.0 (2.9) | 10.4 (10.7) | 2.8 (2.8) | 7.7 (8.0) |
| Refinement | |||||||
| Resolution (Å) | 48.45 – 1.65 | 36.6 – 1.30 | 45.51 – 2.65 | 45.32 – 1.75 | 20.00 – 2.20 | 34.09 – 1.30 | 58.10 – 2.45 |
| Rwork/Rfree (%) | 18.19/21.98 | 15.43/18.47 | 18.22/27.39 | 15.76/21.52 | 16.65/23.92 | 16.76/20.42 | 15.83/21.08 |
| No. atoms | 2117 | 4371 | 2390 | 3934 | 918 | 4121 | 3764 |
| Protein | 1852 | 1926 | 2382 | 1817 | 866 | 1825 | 1819 |
| Water | 264 | 433 | 8 | 184 | 52 | 357 | 69 |
| Ligands | 1 | 7 | 0 | 2 | 0 | 2 | 8 |
| Average B-factors (Å2) | 21.80 | 16.20 | 80.00 | 19.80 | 31.00 | 18.30 | 44.20 |
| R.m.s deviations | |||||||
| Bond lengths (Å) | 0.007 | 0.011 | 0.008 | 0.013 | 0.009 | 0.011 | 0.015 |
| Bond angles (°) | 0.97 | 1.29 | 1.15 | 1.39 | 1.09 | 1.35 | 1.48 |
| Ramachandran (%) | |||||||
| Favored | 100.0 | 98.0 | 96.0 | 98.0 | 99.0 | 99.0 | 100.0 |
| Outliers | 0.0 | 0.0 | 0.0 | 0.0 | 0.0 | 0.0 | 0.0 |
Figure 2. Ribbon representations of the thioredoxin structures studied in this work.

General overview of the seven laboratory resurrections of Precambrian thioredoxins and the extant E. coli and human thioredoxins showing the canonical fold. See Figure S1 and Table S2 for energies of charge-charge interactions, accessible surface areas numbers of hydrogen bonds and salt bridges for all the thioredoxin structures studied in this work.
Despite the overall structural conservation, our experimental results do support some changes in the thioredoxin structure over the 4 billion years period, in particular in length of helix α1 (Figure 1C and 3). Although the posterior probability values for the reconstructed sequences are comparatively low at some positions of the helix α1 region (Perez-Jimenez et al., 2011), we are confident that the observed structural features are robust to alternative sequence inferences (Hanson-Smith and Thornton, 2010), in particular since the change observed in helix α1 shows a clearly defined evolutionary pattern that can be understood by the fact that many extant thioredoxin-like fold proteins are known to differ in the first α-layer (Qi and Grishin, 2005). For instance, the structures of the extant human and E. coli thioredoxins greatly differ in the length of helix α1 (Figures 1C and 3), a result that is robust against different methods to ascertain helix length (Table S3). Furthermore, an analysis of the structures deposited in the Protein Data Bank indicates a shorter helix α1 for most bacterial thioredoxins as compared with eukaryotic thioredoxins (Figure 4). This leads to one obvious question: which of the structural features (long helix vs. short helix) is ancestral and which is derived? This kind of evolutionary question cannot be readily addressed by using a “horizontal” approach (i.e., the comparative analysis of the extant structures summarized in Figure 4). However, the “vertical” approach based on the laboratory resurrection of putative ancestral proteins followed by structure determination does suggest an immediate answer. Figure 3A includes a plot of helix length versus geological time for modern human and E. coli thioredoxins as well as for the ancestral resurrections studied in this work. The structures for the resurrections corresponding to organisms that inhabited Earth about 4 billion years ago display a short helix α1. This suggests that the short helix in E. coli thioredoxin (and most bacterial thioredoxins) is very likely the ancestral structural feature (present in LUCA’s thioredoxin, we might speculate), while the long helix in human thioredoxin (and most eukaryotic thioredoxins) is a derived feature, which was acquired (perhaps in a switch-like manner) along the evolution from AECA thioredoxin to LECA thioredoxin. Finally, it is perhaps worth noting that we have found only 4 structures of thioredoxins from archaea in the Protein Data Bank. They show a helix α1 length of 7–8 residues, a value somewhat higher than that determined for the laboratory resurrection corresponding to the last archaeal common ancestor (5 residues; see LACA in Figure 3). However, the poor statistical basis provided by the small number of available structures for archaeal thioredoxins, together with the fact that our recent thioredoxin resurrection study (Perez-Jimenez et al., 2011) targeted only one archaeal ancestor (the ~4 billions years old LACA), prevents us from analyzing in detail the change in helix α1 length along the archaeal branch.
Figure 3. Changes in the size of helix α1 in thioredoxins over ~4 billion years as inferred from laboratory resurrections of Precambian proteins.

Canonical α-helix hydrogen bonds are shown in red to highlight the changes in helix length. Different color backgrounds are used for short helices (blue) and long helices (green). A plot of helix length versus geological time is also included. See Table S3 for calculations supporting the robustness of the differences found in alpha helix 1 length.
Figure 4. Statistical distribution of length of helix α1 for extant thioredoxin structures taken from the Protein Data Bank.
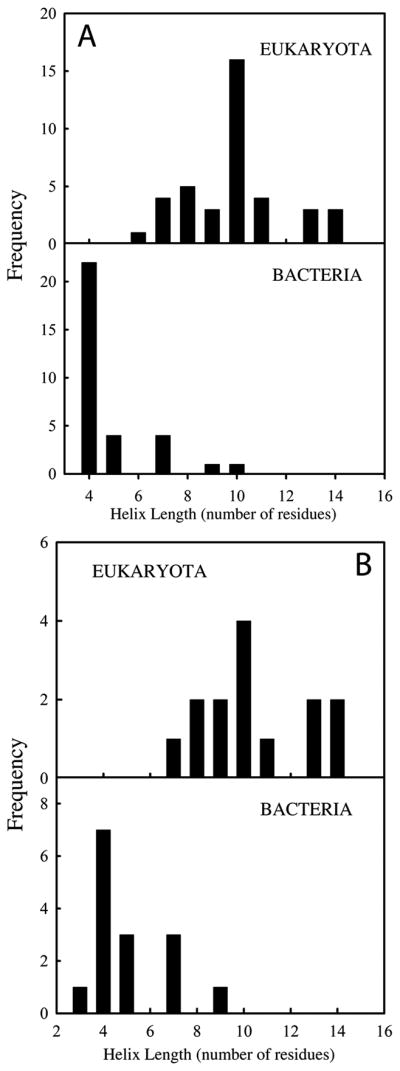
(A) Query details are as follows: text search for “thioredoxin and X-ray as experimental method” was used obtaining a total of 494 structure hits. From these, all thioredoxin-related structures were discarded (i.e. thioredoxin reductases, glutaredoxins, etc); thioredoxins from chloroplast and mitochondria as well as thioredoxins from archaea were not considered either. A total of 39 thioredoxin structures from eukaryota and 32 from bacteria were used in our analysis. Note that in some cases the same protein structure might be overrepresented; this is the case, for instance, when different structures corresponding to mutants of the same protein are deposited in the PDB. (B) Here the search in the PDB was filtered in order to avoid overrepresentation indicated above. In particular, a single thioredoxin structure for each microorganism was selected (i.e., wild type protein) resulting in a total of 14 thioredoxin structures from eukaryota and 15 for bacteria.
The putative ancestral structures reported here are consistent with the thioredoxin fold being a ~4 billion-years-old molecular fossil of sorts and confirms that protein structures can evolve slowly. We anticipate that additional Precambrian resurrection studies may help define structural prototypes, despite the likely geometrically continuous nature of protein structure space (Sadreyev et al., 2009). From a more general point of view, we may speculate that the evolution of protein structures may be sometimes described as a type of punctuated equilibrium (Gould and Eldredge, 1993), with long periods of stasis while switch-like structural transitions occur over comparatively short periods of time.
To summarize, we have shown that protein 3D-structure determination can be reliably carried out with laboratory resurrections corresponding to Precambrian nodes dating back to ~4 billion years, i.e., close to the origin of life. This result is remarkable, given the large number of sequence differences (up to ~50%) between the extinct and extant proteins, and demonstrates the possibility of incorporating a time scale of several billion years to expand the sequence space for 3D-structure determination studies, i.e., a time scale over which we may expect significant changes in protein structure to occur. We have furthermore shown that critical evolutionary issues regarding fold definition, fold age and the identification of ancestral and derived structural features can be readily addressed on the basis of the putative ancestral structures. The results and analyses reported here thus support that laboratory resurrection targeting Precambrian nodes followed by 3D-structure determination can be a powerful approach to explore the poorly understood evolution of protein structures.
EXPERIMENTAL PROCEDURES
Protein expression and purification
Ancestral thioredoxin open reading frames were PCR-amplified from pQE80L-derived vectors containing them (Perez-Jimenez et al., 2011). 5′-end oligonucleotides were designed to introduce an NdeI restriction site (CATATG), in which the ATG sequence codes for the first methionine codon; 3′-end oligonucleotides were designed to create a XhoI site after the stop codon of each open reading frame. PCR fragments were digested with NdeI and XhoI (New England Biolabs) and cloned between the same sites in vector pET30A(+). In these constructs, the open reading frames from ancestral thioredoxins are expressed from the first methionine to the stop codon with no additional aminoacid. Sequencing analysis confirmed that vectors corresponded to their design. Each ancestral thioredoxin gene cloned in the vector pET30A(+) was expressed in BL21(DE3) E. coli bacterial strain. Cells were grown in LB medium containing 100 μg/ml ampicillin at 37°C and induced with 0.4 mM IPTG at an O.D.600 0.7. After 7 hours of incubation at 37°C, cells were harvested and resuspended in 30 mM Tris, 1mM EDTA buffer pH 8.3. The lysate was first applied to an ion-exchange chromatography on a Fractogel® EMD DEAE (M) column using a 0 – 1 M NaCl gradient in 30 mM Tris-EDTA buffer pH 8.3. Fractions containing thioredoxin were pooled and subsequently applied to a gel-filtration chromatography on HiLoad™ Superdex™ 75 preparative grade column. The protein was exhaustively dialyzed in 10mM HEPES pH 7.0. Prior to crystallization protein was concentrated by centrifugation at 14.000 rpm using Centricon centrifugal filter units (Sartorius).
Crystallization, data collection and structure determination
Crystals were grown in capillaries using the counter-diffusion technique (CCD) (Otalora et al., 2009) or in nanodrops using the vapor diffusion technique. Initial crystallization screenings were set-up in CCD using the 24 crystallization screening kit (GSK24) and the mix of PEGs 400, 4k and 8K kits at six different pHs (PEG448-49) (Triana S&T) in capillaries of 0.1 mm inner diameters and 50 mm length (approximately 400 nL of protein solution) at 20°C and 4°C. When crystallization failed the next round of screening was performed using the sitting drop configuration of the vapor diffusion technique set up with a Hamilton Start-Plus robotic system with a 1:1 ratio of protein and reservoir. The drops of 200 nL were equilibrate against the reservoir filled with 50 μL of the PEGion I or PEGRx screening kits (Hampton Research). Optimization experiments, when needed, were set-up in CCD by varying the pH of the precipitant cocktail in GCBs ordered “a la carte” (Triana S&T) in capillaries of 0.1, 0.2 and 0.3 mm inner diameter. A summary of the crystallization methodologies and conditions are summarized in Table S4.
Data collection were done at the European Synchrotron Radiation Facility using beam lines ID14-1, ID29, ID23-1 and ID23-2 from crystals cryo-cooled at 100 K. Only in the case of LPBCA thioredoxin crystals were cryo-protected by supplementing the crystallization mother solution with 15% (v/v) glycerol. Crystals were extracted from the capillary, fished with a loop and flash-cooled in liquid nitrogen. Crystals of LGPCA were kept in the capillary in which crystal grown. A portion of the capillary, containing the selected crystal, was flash-cooled in liquid nitrogen for storage prior data collection. Data were indexed and integrated with either XDS (Kabsch, 2010) and scaled and merged with Scala (Evans, 2006) of the CCP4 program suite (Collaborative Computational Project, 1994) or using the programs Denzo and Scalepack of the HKL2000 suite (Otwinowski and Minor, 1997).
Coordinates from the E. Coli (PDB.ID 2trx chain A, EcTrx from now on) or Human (PDB.ID 1erv, the C73S mutant, HTrx from now on) thioredoxin were used as the search model for molecular replacement using Molrep (Vagin and Teplyakov, 2010). Refinement was initiated in phenix.refine of the PHENIX suite (Adams et al., 2010) including cycles of simulated annealing followed by manual building and water inspection in Coot (Emsley et al., 2010). The latest refinement steps were run including Titration-Libration-Screw (TLS) parameterization applied to group domains with similar mobility. The final refined model was checked with Procheck (Laskowski et al., 1993) and Molprobity (Chen et al., 2010). Table 1 summarizes crystallographic data statistics and final model characteristics. The coordinates and the experimental structure factors have been deposited in the Protein Data Bank and the corresponding ID codes are listed in Table 1.
Secondary structural elements were determined with DSSP (Kabsch and Sander, 1983) and Stride (Frishman and Argos, 1995). Hydrogen bonds were determined with PFIS (Hebert et al., 1998) and WHAT IF (Vriend, 1990). Accessible surface areas were calculated using a modification of the Shake-Rupley algorithm that randomly places 2000 points on the expanded van der Waals sphere representing each atom (Ibarra-Molero et al., 1999). Charge-charge interactions were estimated using the Tanford-Kirkwood algorithm as we have previously described (Ibarra-Molero et al., 1999). Number of salt-bridges was determined with a threshold of 4.0 Å by ESBRI software (Costantini et al., 2008) and WHAT IF (Vriend, 1990). The visualization and comparison of the 3D structural models were done using Pymol v1.3 (Schrödinger, LLC) and COOT (Emsley and Cowtan, 2004).
Coordinates and structure factor files have been deposited at the Protein Data Bank with the accession codes 2YJ7, 2YNX, 2YPM, 2YN1, 2YOI, 3ZIV, 4BA7.
Supplementary Material
HIGHLIGHTS.
3D-structure determination reliably extended up to ~4 billion years before present.
Ancestral and derived structural features in extant proteins readily identified.
Remarkable degree of structure conservation up to a time close to the origin of life.
Illustration of a powerful approach to explore the evolution of protein structures.
Acknowledgments
This work was supported by Grants BIO2009-09562, BIO2012-34937, CSD2009-00088 (to J.M.S.-R), BIO2010-16800, ‘Factoría Española de Cristalización’, Consolider-Ingenio 2010 (to J.A.G) from the Spanish Ministry of Science and Innovation, FEDER Funds (J.M.S.-R. and J.A.G.), Grants from NASA Exobiology (NNX08AO12G), NASA Astrobiology Institute and Georgia Institute of Technology (to E.A.G) and NIH Grants HL066030 and HL061228 (to J.M.F.). We thank Dr. Valeria A. Risso for helpful comments on the manuscript and the staff at ID14-1, ID29, ID23-1 and ID23-2 beam-lines of the European Synchrotron Radiation Facility (ESRF), Grenoble, France, for support during data collection.
Footnotes
Publisher's Disclaimer: This is a PDF file of an unedited manuscript that has been accepted for publication. As a service to our customers we are providing this early version of the manuscript. The manuscript will undergo copyediting, typesetting, and review of the resulting proof before it is published in its final citable form. Please note that during the production process errors may be discovered which could affect the content, and all legal disclaimers that apply to the journal pertain.
Contributor Information
Jose M. Sanchez-Ruiz, Email: sanchezr@ugr.es.
Jose A. Gavira, Email: jgavira@iact.ugr-csic.es.
References
- Adams PD, Afonine PV, Bunkoczi G, Chen VB, Davis IW, Echols N, Headd JJ, Hung LW, Kapral GJ, Grosse-Kunstleve RW, et al. PHENIX: a comprehensive Python-based system for macromolecular structure solution. Acta Crystallographica Section D. 2010;66:213–221. doi: 10.1107/S0907444909052925. [DOI] [PMC free article] [PubMed] [Google Scholar]
- Benner SA, Sassi SO, Gaucher EA. Molecular paleoscience: systems biology from the past. Advances in enzymology and related areas of molecular biology. 2007;75:1–132. xi. doi: 10.1002/9780471224464.ch1. [DOI] [PubMed] [Google Scholar]
- Caetano-Anolles G, Wang M, Caetano-Anolles D, Mittenthal JE. The origin, evolution and structure of the protein world. Biochem J. 2009;417:621–637. doi: 10.1042/BJ20082063. [DOI] [PubMed] [Google Scholar]
- Chen VB, Arendall WB, 3rd, Headd JJ, Keedy DA, Immormino RM, Kapral GJ, Murray LW, Richardson JS, Richardson DC. MolProbity: all-atom structure validation for macromolecular crystallography. Acta crystallographica Section D, Biological crystallography. 2010;66:12–21. doi: 10.1107/S0907444909042073. [DOI] [PMC free article] [PubMed] [Google Scholar]
- Collaborative Computational Project N. The CCP4 suite: programs for protein crystallography. Acta crystallographica Section D, Biological crystallography. 1994;50:760–763. doi: 10.1107/S0907444994003112. [DOI] [PubMed] [Google Scholar]
- Cordes MH, Walsh NP, McKnight CJ, Sauer RT. Evolution of a protein fold in vitro. Science. 1999;284:325–328. doi: 10.1126/science.284.5412.325. [DOI] [PubMed] [Google Scholar]
- Costantini S, Colonna G, Facchiano AM. ESBRI: a web server for evaluating salt bridges in proteins. Bioinformation. 2008;3:137–138. doi: 10.6026/97320630003137. [DOI] [PMC free article] [PubMed] [Google Scholar]
- Emsley P, Cowtan K. Coot: model-building tools for molecular graphics. Acta crystallographica Section D, Biological crystallography. 2004;60:2126–2132. doi: 10.1107/S0907444904019158. [DOI] [PubMed] [Google Scholar]
- Emsley P, Lohkamp B, Scott WG, Cowtan K. Features and development of Coot. Acta Crystallographica Section D. 2010;66:486–501. doi: 10.1107/S0907444910007493. [DOI] [PMC free article] [PubMed] [Google Scholar]
- Evans P. Scaling and assessment of data quality. Acta crystallographica Section D, Biological crystallography. 2006;62:72–82. doi: 10.1107/S0907444905036693. [DOI] [PubMed] [Google Scholar]
- Finnigan GC, Hanson-Smith V, Stevens TH, Thornton JW. Evolution of increased complexity in a molecular machine. Nature. 2012;481:360–364. doi: 10.1038/nature10724. [DOI] [PMC free article] [PubMed] [Google Scholar]
- Frishman D, Argos P. Knowledge-based protein secondary structure assignment. Proteins. 1995;23:566–579. doi: 10.1002/prot.340230412. [DOI] [PubMed] [Google Scholar]
- Gaucher EA, Govindarajan S, Ganesh OK. Palaeotemperature trend for Precambrian life inferred from resurrected proteins. Nature. 2008;451:704–707. doi: 10.1038/nature06510. [DOI] [PubMed] [Google Scholar]
- Gould SJ, Eldredge N. Punctuated equilibrium comes of age. Nature. 1993;366:223–227. doi: 10.1038/366223a0. [DOI] [PubMed] [Google Scholar]
- Grishin NV. Fold change in evolution of protein structures. J Struct Biol. 2001;134:167–185. doi: 10.1006/jsbi.2001.4335. [DOI] [PubMed] [Google Scholar]
- Hanson-Smith V, Kolaczkowski B, Thornton JW. robustness of ancestral sequence reconstruction to phylogenetic uncertainty. Mol Biol Evol. 2010;27:1988–1999. doi: 10.1093/molbev/msq081. [DOI] [PMC free article] [PubMed] [Google Scholar]
- Harms MJ, Thornton JW. Analyzing protein structure and function using ancestral gene reconstruction. Curr Opin Struct Biol. 2010;20:360–366. doi: 10.1016/j.sbi.2010.03.005. [DOI] [PMC free article] [PubMed] [Google Scholar]
- He Y, Chen Y, Alexander PA, Bryan PN, Orban J. Mutational tipping points for switching protein folds and functions. Structure. 2012;20:283–291. doi: 10.1016/j.str.2011.11.018. [DOI] [PMC free article] [PubMed] [Google Scholar]
- Hebert EJ, Giletto A, Sevcik J, Urbanikova L, Wilson KS, Dauter Z, Pace CN. Contribution of a conserved asparagine to the conformational stability of ribonucleases Sa, Ba, and T1. Biochemistry. 1998;37:16192–16200. doi: 10.1021/bi9815243. [DOI] [PubMed] [Google Scholar]
- Hedges SB, Kumar S, editors. The Timetree of Life. Oxford University Press; New York: 2009. [Google Scholar]
- Honig B. Protein structure space is much more than the sum of its folds. Nat Struct Mol Biol. 2007;14:458. doi: 10.1038/nsmb0607-458. [DOI] [PubMed] [Google Scholar]
- Ibarra-Molero B, Loladze VV, Makhatadze GI, Sanchez-Ruiz JM. Thermal versus guanidine-induced unfolding of ubiquitin. An analysis in terms of the contributions from charge-charge interactions to protein stability. Biochemistry. 1999;38:8138–8149. doi: 10.1021/bi9905819. [DOI] [PubMed] [Google Scholar]
- Kabsch W. Xds. Acta crystallographica Section D, Biological crystallography. 2010;66:125–132. doi: 10.1107/S0907444909047337. [DOI] [PMC free article] [PubMed] [Google Scholar]
- Kabsch W, Sander C. Dictionary of protein secondary structure: pattern recognition of hydrogen-bonded and geometrical features. Biopolymers. 1983;22:2577–2637. doi: 10.1002/bip.360221211. [DOI] [PubMed] [Google Scholar]
- Krishna SS, Grishin NV. Structurally analogous proteins do exist! Structure. 2004;12:1125–1127. doi: 10.1016/j.str.2004.06.004. [DOI] [PubMed] [Google Scholar]
- Laskowski RA, Macarthur MW, Moss DS, Thornton JM. {PROCHECK}: a program to check the stereochemical quality of protein structures. J Appl Cryst. 1993;26:283–291. [Google Scholar]
- Murzin AG. Biochemistry. Metamorphic proteins. Science. 2008;320:1725–1726. doi: 10.1126/science.1158868. [DOI] [PubMed] [Google Scholar]
- Orengo CA, Jones DT, Thornton JM. Protein superfamilies and domain superfolds. Nature. 1994;372:631–634. doi: 10.1038/372631a0. [DOI] [PubMed] [Google Scholar]
- Ortlund EA, Bridgham JT, Redinbo MR, Thornton JW. Crystal structure of an ancient protein: evolution by conformational epistasis. Science. 2007;317:1544–1548. doi: 10.1126/science.1142819. [DOI] [PMC free article] [PubMed] [Google Scholar]
- Otalora F, Gavira JA, Ng JD, Garcia-Ruiz JM. Counterdiffusion methods applied to protein crystallization. Prog Biophys Mol Biol. 2009;101:26–37. doi: 10.1016/j.pbiomolbio.2009.12.004. [DOI] [PubMed] [Google Scholar]
- Otwinowski Z, Minor W. Processing of X-ray Diffraction Data Collected in Oscillation Mode. In: Carter CW, Sweet RM, editors. Methods in Enzymology. New York: Academic Press; 1997. pp. 307–326. [DOI] [PubMed] [Google Scholar]
- Perez-Jimenez R, Ingles-Prieto A, Zhao ZM, Sanchez-Romero I, Alegre-Cebollada J, Kosuri P, Garcia-Manyes S, Kappock TJ, Tanokura M, Holmgren A, et al. Single-molecule paleoenzymology probes the chemistry of resurrected enzymes. Nature structural & molecular biology. 2011;18:592–596. doi: 10.1038/nsmb.2020. [DOI] [PMC free article] [PubMed] [Google Scholar]
- Qi Y, Grishin NV. Structural classification of thioredoxin-like fold proteins. Proteins. 2005;58:376–388. doi: 10.1002/prot.20329. [DOI] [PubMed] [Google Scholar]
- Risso VA, Gavira JA, Mejia-Carmona DF, Gaucher EA, Sanchez-Ruiz JM. Hyperstability and Substrate Promiscuity in Laboratory Resurrections of Precambrian beta-Lactamases. J Am Chem Soc. 2013;135:2899–2902. doi: 10.1021/ja311630a. [DOI] [PubMed] [Google Scholar]
- Sadreyev RI, Kim BH, Grishin NV. Discrete-continuous duality of protein structure space. Curr Opin Struct Biol. 2009;19:321–328. doi: 10.1016/j.sbi.2009.04.009. [DOI] [PMC free article] [PubMed] [Google Scholar]
- Schaeffer RD, Daggett V. Protein folds and protein folding. Protein Eng Des Sel. 2011;24:11–19. doi: 10.1093/protein/gzq096. [DOI] [PMC free article] [PubMed] [Google Scholar]
- Sikosek T, Bornberg-Bauer E, Chan HS. Evolutionary dynamics on protein bi-stability landscapes can potentially resolve adaptive conflicts. PLoS Comput Biol. 2012;8:e1002659. doi: 10.1371/journal.pcbi.1002659. [DOI] [PMC free article] [PubMed] [Google Scholar]
- Taylor WR. Evolutionary transitions in protein fold space. Curr Opin Struct Biol. 2007;17:354–361. doi: 10.1016/j.sbi.2007.06.002. [DOI] [PubMed] [Google Scholar]
- Tokuriki N, Tawfik DS. Protein dynamism and evolvability. Science. 2009;324:203–207. doi: 10.1126/science.1169375. [DOI] [PubMed] [Google Scholar]
- Vagin A, Teplyakov A. Molecular replacement with MOLREP. Acta crystallographica Section D, Biological crystallography. 2010;66:22–25. doi: 10.1107/S0907444909042589. [DOI] [PubMed] [Google Scholar]
- Valas RE, Yang S, Bourne PE. Nothing about protein structure classification makes sense except in the light of evolution. Curr Opin Struct Biol. 2009;19:329–334. doi: 10.1016/j.sbi.2009.03.011. [DOI] [PMC free article] [PubMed] [Google Scholar]
- Voordeckers K, Brown CA, Vanneste K, van der Zande E, Voet A, Maere S, Verstrepen KJ. Reconstruction of ancestral metabolic enzymes reveals molecular mechanisms underlying evolutionary innovation through gene duplication. PLoS biology. 2012;10:e1001446. doi: 10.1371/journal.pbio.1001446. [DOI] [PMC free article] [PubMed] [Google Scholar]
- Vriend G. WHAT IF: a molecular modeling and drug design program. J Mol Graph. 1990;8:52–56. 29. doi: 10.1016/0263-7855(90)80070-v. [DOI] [PubMed] [Google Scholar]
- Winstanley HF, Abeln S, Deane CM. How old is your fold? Bioinformatics. 2005;21(Suppl 1):i449–458. doi: 10.1093/bioinformatics/bti1008. [DOI] [PubMed] [Google Scholar]
- Xie L, Bourne PE. Detecting evolutionary relationships across existing fold space, using sequence order-independent profile-profile alignments. Proc Natl Acad Sci U S A. 2008;105:5441–5446. doi: 10.1073/pnas.0704422105. [DOI] [PMC free article] [PubMed] [Google Scholar]
Associated Data
This section collects any data citations, data availability statements, or supplementary materials included in this article.