

Abstract
Fat oxidation during exercise is increased by endurance training, and evidence suggests that fat oxidation during exercise is impaired in obesity. Thus the primary aim of this study was to compare the acute effects of exercise on 24-h fat oxidation and fat balance in lean sedentary [LS, n = 10, body mass index (BMI) = 22.5 ± 6.5 kg/m2], lean endurance-trained (LT, n = 10, BMI = 21.2 ± 1.2 kg/m2), and obese sedentary (OS, n = 7, BMI = 35.5 ± 4.4 kg/m2) men and women. Twenty-four-hour energy expenditure and substrate oxidation were measured under sedentary (control; CON) and exercise (EX) conditions while maintaining energy balance. During EX, subjects performed 1 h of stationary cycling at 55% of aerobic capacity. Twenty-four-hour fat oxidation did not differ on the CON or EX day in LS (43 ± 9 vs. 29 ± 7 g/day, respectively), LT (53 ± 8 vs. 42 ± 5 g/day), or OS (58 ± 7 vs. 80 ± 9 g/day). However, 24-h fat balance was significantly more positive on EX compared with CON (P < 0.01). Twenty-four-hour glucose, insulin, and free fatty acid (FFA) profiles were similar on the EX and CON days, but after consumption of the first meal, FFA concentrations remained below fasting levels for the remainder of the day. These data suggest that when exercise is performed with energy replacement (i.e., energy balance is maintained), 24-h fat oxidation does not increase and in fact, may be slightly decreased. It appears that the state of energy balance is an underappreciated factor determining the impact of exercise on fat oxidation.
Keywords: whole room calorimeter, fat oxidation, body weight regulation
impairments in fat metabolism contribute to the development of obesity and non-insulin-dependent diabetes mellitus. For example, reduced rates of 24-h fat oxidation [i.e., increased respiratory quotient (RQ)] have been shown to predict weight gain (39), and obese and insulin-resistant individuals have a decreased capacity to oxidize fatty acids (20). Moreover, fatty acid oxidation in isolated skeletal muscle preparations from obese individuals is lower than in muscle from lean individuals (23). Fat oxidation is increased during exercise, and endurance training promotes changes in skeletal muscle that would favor an increase in fat oxidation (19), suggesting that regular endurance exercise could induce loss of fat mass by increasing fat oxidation. It has been suggested that exercise substantially increases fat oxidation in the postexercise period (13), although this has never clearly been demonstrated.
To reduce fat mass, a state of negative fat balance must be achieved (11). To achieve negative fat balance, one must alter intake or expenditure such that fat oxidation exceeds fat intake. Since fat oxidation is increased during exercise, it is generally assumed that more fat is oxidized on a day when exercise is performed. However, we have conducted several studies in relatively sedentary subjects and demonstrated that 24-h fat oxidation is not increased in response to exercise when subjects are studied in energy balance (25–30). These studies have been performed in energy balance so that we could determine the independent effects of exercise on 24-h fat oxidation and fat balance. When measured in a laboratory, endurance exercise training has been repeatedly shown to increase fat oxidation during exercise (12, 22, 32). However, these studies were performed with subjects in the fasted state. Other laboratory studies have shown that the training-induced increases in fat oxidation during exercise are attenuated or eliminated when subjects are studied in the nonfasted state (13, 14). This is primarily due to the insulin-mediated decrease in lipolysis that diminishes the supply of plasma free fatty acids (FFA) (17, 31), which are the primary source of fatty acids for contracting skeletal muscle (2, 21). To our knowledge, the effect of exercise on 24-h fat oxidation and fat balance has not been studied in endurance-trained individuals, nor has any study considered the longitudinal effects of endurance training on 24-h fat oxidation and fat balance. Thus the effects of endurance training on 24-h fat oxidation and fat balance remain unknown.
The primary aim of this study was to compare the acute effects of exercise on 24-h fat oxidation and 24-h fat balance in lean sedentary, obese sedentary, and lean endurance-trained men and women. A priori, we hypothesized that in response to an acute bout of exercise, 24-h fat oxidation would increase only in endurance-trained individuals and that only this group would achieve negative fat balance. We also performed timed blood draws throughout the 24-h calorimeter measurements to characterize changes in glucose, insulin, FFA, and glycerol on days with and without exercise.
METHODS
Institutional approval.
The study was approved by the Colorado Multiple Institutional Review Board (COMIRB) and the Scientific Advisory Board of the Clinical Translation Research Center (CTRC) at the University of Colorado at Denver (UCD).
Subjects.
Healthy, lean sedentary [LS, body mass index (BMI) = 19–25 kg/m2], lean endurance-trained (LT, BMI = 19–25 kg/m2), and obese sedentary (OS, BMI = 30–40 kg/m2) adults (20–45 yr old) were recruited through electronic and paper bulletins on the UCD campus. Respondents were queried about their age, current and past body weight, physical activity patterns, and health history during an initial telephone screening. Inclusion criteria were self-reported weight stability (less than 5% change in body weight over the previous 6 mo), and no history of prior obesity in LS and LT. LS and OS were required to be maintaining a sedentary lifestyle (defined as regular exercise < 1 bout/wk or sporting activities < 1 h/wk). LT were required to be maintaining an average of >5 h/wk of endurance training over the previous 3 mo and report a recent history (past year) of participation in competitive endurance athletic events. Major exclusion criteria were presence or history of any metabolic or chronic health problems (e.g., untreated thyroid disease, cancer, diabetes, cardiovascular disease); presence of active gastrointestinal disorders; use of prescription or over-the-counter medications known to affect appetite, food intake, or intermediary metabolism (e.g., appetite suppressants, antidepressants); use of antiobesity pharmacotherapeutic agents within the past 6 mo; current use of pharmacological steroids (other than oral contraceptives); smoking (past 6 mo); or history of alcohol or substance abuse. Additional exclusion criteria for female volunteers were pregnancy or lactation, amenorrhea (absence of 3 or more consecutive menstrual cycles), self-reported abnormal menstrual cycle length (<26 days or >32 days), and postmenopausal status. Volunteers who passed the initial screening provided informed written consent and were then invited to participate in a health history and physical examination. BMI was confirmed by measuring height and weight while wearing only socks, undergarments, and a hospital gown. A fasted blood sample was then obtained, and any volunteer with a fasting glucose ≥ 100 mg/dl or undiagnosed hypo- or hyperthyroidism (thyroid stimulating hormone <0.5 or >5.0 mIU/l, respectively) was excluded. Due to the serial blood draws performed during the calorimeter stays, individuals with significant anemia (hemoglobin < 10 g/dl) were also excluded. The characteristics of the 27 subjects included in this study are presented in Table 1. The groups significantly differed in weight, BMI, body fat percent (OS > LS > LT) and aerobic capacity (LT > LS > OS). OS subjects were also older than LS and LT.
Table 1.
Subject characteristics
| F/M | Age, yr | Wt, kg | BMI, kg/m2 | %Fat | V̇o2peak, ml·kg−1·min−1 | |
|---|---|---|---|---|---|---|
| LT | F (n = 6) | 28±5 | 55.8±3.8 | 20.6±1.2 | 21.1±2.8 | 45.8±1.6 |
| M (n = 4) | 35±9 | 66.2±6.5 | 22.1±0.8 | 12.4±1.2 | 54.2±3.6 | |
| LS | F (n = 6) | 30±5 | 62.6±5.4 | 22.4±1.8 | 29.9±4.2 | 31.1±6.4 |
| M (n = 4) | 32±12 | 72.9±6.1 | 22.7±2.9 | 21.6±6.6 | 39.9±5.1 | |
| OS | F (n = 3) | 44±1 | 90.9±5.6 | 31.7±2.6 | 40.8±4.4 | 24.0±1.5 |
| M (n = 4) | 34±5 | 122.9±10.5 | 37.2±3.3 | 38.7±3.1 | 23.7±4.0 |
Values are means ± SD; n = no. of men (M) or women (F). LT, lean endurance-trained subjects; LS, lean sedentary subjects; OS, obese sedentary subjects; V̇o2peak, maximal aerobic capacity; BMI, body mass index.
Prestudy measurements.
Body composition was measured using dual-energy X-ray absorptiometry (DXA, Hologic Delphi-W, Hologic, Bedford, MA). Resting metabolic rate (RMR) was measured using standard indirect calorimetry (TrueOne 2400, ParvoMedics, Sandy, UT) with the ventilated hood technique. Subjects arrived in the CTRC outpatient clinic between 7 and 9 AM, following an overnight fast and 24 h abstention from exercise. Subjects rested quietly for 30 min in a dimly lit, thermoneutral room (ambient temperature ∼70 °F) for 30 min. Respiratory gas exchange was measured for 15 min, and the last 10 min was used to determine the RMR. Maximal aerobic capacity (V̇o2peak) was determined using a progressive exercise test on an electronically braked stationary cycle ergometer or motorized treadmill. All LT and LS subjects were tested on a stationary cycle, but several OS subjects (2 men/2 women) were tested on a motorized treadmill. These four subjects were recruited from an exercise intervention study and completed the present study before enrolling in the exercise intervention. Rather than ask subjects to perform a second maximal exercise test, data from the treadmill test were used. V̇o2peak was determined from the average of the highest three 30-s measurements. To be accepted as valid, the test was required to meet two of the following three criteria: 1) a RQ > 1.1, 2) heart rate within 10 beats/min of 85% of age-predicted maximum, and 3) an increase in oxygen uptake (V̇o2) in response to the final workload of <2.0 ml·kg−1·min−1. On a separate day, subjects performed a submaximal exercise test on a stationary cycle ergometer to determine the workload that elicited a V̇o2 corresponding to 55% of V̇o2peak. V̇o2 was measured using the Parvo Metabolic cart, and heart rate was monitored using telemetry as subjects cycled at an intensity estimated to achieve 55% of V̇o2peak based on maximal heart rate. The workload was adjusted until steady-state V̇o2 was at the target level (±0.2 l/min). Once achieved, the subject continued to cycle at this workload for another 10–15 min, and steady-state energy expenditure (kcal/min) was averaged over the last 5–10 min.
Study design.
This study was conducted as part of a larger trial to compare the effects of exercise (EX) and high-fat diets (HF) on substrate oxidation. Subjects completed three trials, separated by 1–3 wk. The first trial served as the control condition (CON), which was performed first to confirm that energy balance was achieved during the calorimeter stay. Subjects then performed either the EX or HF diet trials in random order. Only data from the EX and CON trial are presented here. Each trial lasted 4 days; days 1–3 were an outpatient phase, and on day 4, 24-h energy expenditure and substrate oxidation were measured using the whole room indirect calorimeter located in the CTRC at UCD. Subjects were provided all of their meals during the 4-day trials (see description below), and the composition of all diets was 20% fat, 65% carbohydrate, and 15% protein. During the outpatient phase, LT participated in their normal exercise training on days 1–2 and then refrained from exercise on day 3. LS and OS maintained their typical sedentary lifestyle during the outpatient phase.
Outpatient diets (days 1–3).
The daily energy content of the outpatient diet was estimated to meet free-living energy requirements based on a regression equation using fat-free mass (FFM) and an activity factor [24 h intake = (372 + 23.9 × FFM) × activity factor] developed in our previous studies (30). The activity factor for the LS and OS was 1.4. In the LT group, the activity factor was based on self-reported activity level (1.6–1.9) for days 1–2 but was dropped to 1.4 on the 3rd day when subjects refrained from exercise. Breakfast was consumed in the CTRC and other meals were packaged and taken with the subject. All food was required to be consumed, and no other food was permitted. Two optional food modules (200 kcal each) were provided in the event that the subject experienced hunger.
Calorimeter diets.
The energy content of the diet was estimated to achieve energy balance on the CON day using the same regression equation used for the outpatient diet and an activity factor representing sedentary conditions (1.4). If energy balance was achieved (±200 kcal/day), no dietary adjustments were made during the subsequent trials. If energy balance was within ±200–300 kcal, energy intake was adjusted for the subsequent trials, but the CON was not repeated [this occurred in 3 LT subjects (2 male, 1 female) and 2 LS (1 male, 1 female) subjects]. If energy balance was greater than 300 kcal/day or less than −300 kcal/day, the diet was adjusted and the CON trial was repeated (this occurred in 2 OS males). This permitted energy balance to be targeted with greater precision during the subsequent trials. During the EX trial, energy intake was adjusted for the estimated increase in energy expenditure (EE) due to the exercise bout, measured during the prestudy submaximal exercise test. Steady-state EE measured during the submaximal exercise test (kcal/min) was extrapolated to 60 min. Based on our previous studies (27, 30), we estimated that 24-h EE on the EX day would increase by 120% of steady-state EE. The 20% increase above exercise EE is likely due to the combined effects of the increase in postexercise EE and cardiovascular drift during exercise. Thus intake on the EX day was increased by 120% of that steady-state exercise EE (e.g., for an estimated total exercise EE of 400 kcal, 24-h intake was increased by 480 kcal). The increased energy content of the calorimeter diets on the EX day was achieved primarily by increasing the portion sizes of each of the three meals.
Calorimeter protocol.
Volunteers entered the calorimeter at 0800 and exited at 0700 the following day. Three bouts of bench-stepping exercise (3 × 20 min at 72 steps/min) were performed each day at 0830, 1350, and 1850 to mimic free-living physical activity performed outside the calorimeter. Subjects were free to move about the calorimeter during other times of the day, but primarily this time was spent in sedentary behavior (reading, writing, computer use, watching TV). Subjects were instructed to remain awake and not to nap or perform any exercise other than that prescribed by the protocol and to go to bed at the same time during each calorimeter stay. Subjects recorded their time to bed, and all subjects reported going to bed before 2300. Meals were provided at 0900, 1315, and 1730, and a light snack was provided at 2000. The distribution of total daily energy intake was 30% at each meal and 10% in the evening snack. During the EX trial, subjects performed 1 h of stationary cycling at 1000. The exercise session was performed at the workload corresponding to 55% of V̇o2peak, an intensity at which fat oxidation rates should be near maximal in both trained and untrained subjects (2).
Venous blood samples (∼7.0 ml) were obtained at several time points during the calorimeter session. Since continuous or frequent blood sampling is not practical in the room calorimeter, we selected time points to represent fasting (prior to entry, after exiting the calorimeter), before and after meals, and postexercise. To obtain blood samples, subjects extended their arm through a leak-free port in the calorimeter wall.
Twenty-four-hour EE and substrate oxidation.
The calorimeter data were extrapolated to 24-h values, based on average minute values. Twenty-four hour EE and substrate oxidation were determined from oxygen consumption (Vo2) and carbon dioxide production (Vco2), as previously described (30). Gas volumes were determined from the flow rate and the differences in CO2 and O2 concentrations between entering and exiting air using paramagnetic oxygen and infrared carbon dioxide analyzers. Urine was collected for the duration of the calorimetry stay and analyzed for total nitrogen concentration (34), which was then used to determine 24-h protein oxidation (24). EE and substrate oxidation were calculated from oxygen consumption and the nonprotein respiratory quotient (RQ) based on the equations of Jequier et al. (18). Values for all variables were averaged over 1-min intervals and recorded to a data file. EE and RQ data were also calculated during the exercise period (1000–1100) and during sleep (0100–0400). This definition of the sleeping period was based on the results of a previous study (33) that demonstrated that the 3-h minimum in sleeping metabolic rate occurs between ∼1:45 and 5:45 AM. Each 24-h record was manually scanned to be sure that EE remained stable during this period.
During the course of the study, we relocated from our previous location to a new facility (August, 2007). Several subjects (4 LT, 2 LS) were studied in the old calorimeter, and the remaining subjects were studied in the new calorimeter. Importantly, each individual subject was only studied in one room (i.e., all conditions within a subject were performed in the same room). The principles of operation for the two rooms are identical, with the primary difference being size (total volume ∼24,000 liters in the old room, and ∼27,000 liters in the new room). As previously reported (30), to determine the accuracy of the old calorimeter in measuring Vo2 and Vco2, we performed monthly tests based on the combustion of propane; the observed recoveries of O2 and CO2 were maintained within ±5% of expected values (average recoveries ∼98%). We did not commence human tests in the new calorimeter until we achieved the same standards (average recoveries over a period of ∼2 mo was ∼97–98%). We also performed cross validation testing between the rooms in several volunteers (n = 9). Subjects were studied for 4 h in each room. During this period, subjects lied quietly in bed (60 min) and performed bench stepping (20 min) and stationary cycling (30 min). In between these activities, subjects sat quietly watching TV or reading. Total EE (488 ± 85 vs. 472 ± 83 kcal), Vo2 (99.1 ± 17.1 vs. 96.6 ± 17.1 liters), and Vco2 (88.2 ± 16.2 vs. 82.5 ± 14.5 liters) measured by the old and new room, respectively, did not significantly differ. If the observed difference in EE is extrapolated to 24 h, the EE measured by the two rooms would be within 100 kcal. However, the small nonsignificant differences in Vo2 and Vco2 resulted in a significantly lower RQ values in the new room (0.85 ± 0.04 vs. 0.88 ± 0.04). In these same subjects, we also measured EE at rest (30 min) and during stepping (20 min) and cycling (30 min) using the Parvo metabolic cart and compared these results with EE measured during the period that activity was performed in the room calorimeters. We observed no significant differences in EE during any of these activities. Nonetheless, to account for any confounding effect between the rooms, room was used as a covariate in the statistical models (see below).
Blood analyses.
Whole blood (2.5 ml) was added to 40 ml of preservative (3.6 mg EDTA plus 2.4 mg glutathione in distilled water). The sample was allowed to clot and the serum was separated after spinning. Serum was stored at −80°C until analyzed. All samples were assayed for glucose, insulin, glycerol, and FFA. Glucose concentrations were determined using the hexokinase method (Roche, Indianapolis, IN). Insulin concentrations were measured using standard, double-antibody radioimmunoassay (Diagnostic Systems Laboratory, Webster, CT). FFA and glycerol concentrations (Wako Chemical, Richmond, VA) were determined using direct enzymatic/calorimetric assays (COBRA Mira Plus Chemistry analyzer).
Statistical analysis.
Statistical analyses were carried out using SAS (SAS Institute, Cary, NC). The primary study outcomes were differences in 24-h fat oxidation and 24-h fat balance. Analyses used repeated-measures ANOVA to account for repeated measurements on subjects during two conditions, and room and sex were used as covariates. Unequal variances were allowed in different groups and different conditions. If the interaction terms were nonsignificant, then the main effects of group and condition were evaluated. For significant interactions, Tukey's post hoc tests were performed to determine within-group differences between conditions. Hormone (insulin) and substrate (glucose, FFA, glycerol) data were examined graphically, and due to skewness, large range, and unequal variances, these data were base 10 log-transformed before statistical analyses. These data were analyzed using a three-factor ANOVA (group × condition × time) using condition and time as repeated measures. If the interaction terms were all nonsignificant, then the two-way interactions were examined (group × time, group × condition, condition × time). Significance for all tests was set at P = 0.05. Data are presented as means ± SE unless otherwise specified.
RESULTS
EE, energy balance, and RQ (Table 2).
Table 2.
Energy expenditure and respiratory quotient
| LT |
LS |
OS |
ANOVA P Value |
||||||
|---|---|---|---|---|---|---|---|---|---|
| CON | EX | CON | EX | CON | EX | Group | Condition | Interaction | |
| 24-h EE | |||||||||
| kcal/day | 2,324±51 | 2,745±70* | 2,313±43 | 2,718±88* | 3,181±114 | 3,598±156* | P < 0.001 | P < 0.001 | P = 0.98 |
| kcal·kg FFM−1·day−1 | 45.6±0.5 | 53.9±1.2* | 45.7±0.8 | 53.4±1.3* | 48.5±1.3 | 54.8±1.6* | P = 0.07 | P < 0.001 | P = 0.24 |
| Sleep EE | |||||||||
| kcal/day | 1.08±0.03 | 1.04±0.03 | 1.03±0.02 | 1.05±0.02 | 1.39±0.05 | 1.41±0.06 | P < 0.001 | P = 0.16 | P = 0.20 |
| kcal·kg FFM−1·day−1 | 0.022±0.001 | 0.021±0.001 | 0.021±0.001 | 0.021±0.001 | 0.022±0.001 | 0.022±0.001 | P = 0.47 | P = 0.37 | P = 0.29 |
| Exercise EE | |||||||||
| kcal | 543±18a | 443±19b | 453±35b | P = 0.007 | |||||
| kcal/min | 9.0±0.3a | 7.4±0.3b | 7.6±0.6b | P = 0.007 | |||||
| PAL† | 1.64±0.11 | 1.94±0.14* | 1.61±0.05 | 1.89±0.07* | 1.64±0.08 | 1.85±0.10* | P = 0.32 | P < 0.001 | P = 0.15 |
| Energy balance, kcal/day | 8±44 | 134±46 | 22±28 | 14±47 | −85±46 | −79±58 | P = 0.04 | P = 0.54 | P = 0.16 |
| 24-h RQ | 0.90±0.01 | 0.92±0.01 | 0.91±0.01 | 0.93±0.01 | 0.92±0.01 | 0.91±0.01 | P = 0.50 | P = 0.08 | P = 0.36 |
| Sleep RQ | 0.85±0.02 | 0.89±0.01 | 0.87±0.02 | 0.89±0.01 | 0.89±0.01 | 0.87±0.01 | P = 0.93 | P = 0.17 | P = 0.05 |
| Exercise RQ | 0.95±0.01a | 0.99±0.01b | 0.97±0.01a,b | P = 0.002 | |||||
Values are means ± SE, adjusted for room and sex. EE, energy expenditure; FFM, fat-free mass; RQ, respiratory quotient; PAL, physical activity level.
PAL was calculated as 24-h EE/RMR, where RMR is resting metabolic rate.
P < 0.01, exercise condition (EX) vs. control condition (CON). Different superscript letters (a, b) indicate significant differences between groups determined using a one-factor ANOVA.
As expected, 24-h EE was significantly increased in all groups on the EX day compared with the CON day (P < 0.001) whether expressed as absolute EE (kcal/day) or relative to FFM (kcal·kg FFM−1·day−1). Twenty-four-hour EE was higher in OS expressed in absolute terms, but when expressed relative to FFM, there was no difference in 24-h EE between groups. Sleep EE in absolute terms (kcal/min) was also higher in OS (P < 0.001) but not when expressed relative to FFM. Sleep EE was not affected by the EX condition. EE during exercise was higher in LT than in OS and LS. In accordance with the study design, physical activity level (PAL, 24-h EE divided by RMR) on the EX day was significantly elevated above CON in all groups (P < 0.001) but did not differ between groups on either the CON or EX days. Energy balance was lower in OS compared with LT and LS in both conditions, but within groups did not differ between conditions. Twenty-four-hour RQ did not differ between groups or condition. Twenty-four-hour RQ during CON and EX for individual subjects are presented in Fig. 1. Compared with CON, 24-h RQ tended to be equal or higher during EX in most individuals studied. There was a significant interaction between condition and group for sleep RQ (P = 0.05), but post hoc testing did not reveal any significant differences in sleep RQ between conditions within any of the groups. During exercise, RQ was significantly higher in LS than LT but did not significantly differ between LT and OS, or LS and OS.
Fig. 1.
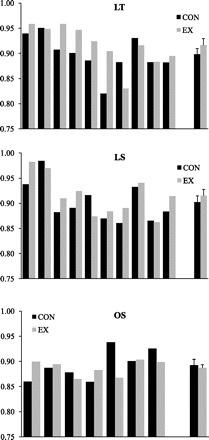
Individual 24-h respiratory quotient (RQ) values in lean endurance-trained (LT; top), lean sedentary (LS; middle), and obese sedentary subjects (OS; bottom) on sedentary [control (CON); black bars] and exercise (EX) days (gray bars). Group means ± SE are displayed at right.
Twenty-four-hour substrate oxidation and balances.
Twenty-four-hour substrate oxidation was analyzed in absolute (g/day) and relative (g·kg FFM−1·day−1) terms. The findings were similar regardless of the data expression, so data are presented only relative to FFM. Twenty-four-hour substrate oxidation data are presented in Fig. 2. The interaction between group and condition was not significant for 24-h protein oxidation (Fig. 2A). Twenty-four-hour protein oxidation was significantly higher on the EX day (P < 0.01) but did not differ between groups. The interaction between group and condition was significant for 24-h carbohydrate oxidation (Fig. 2B), with post hoc testing demonstrating a significant increase in carbohydrate oxidation in the LT and LS groups (P < 0.01) but not the OS group (P = 0.47). The interaction between group and condition was not significant for 24-h fat oxidation (Fig. 2C), and there were no significant group or condition effects.
Fig. 2.
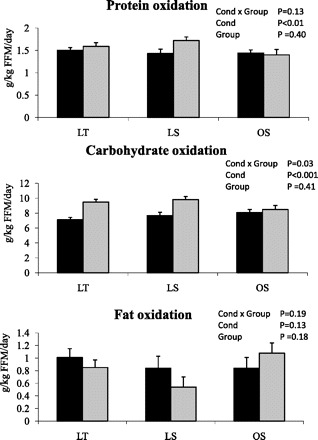
Protein (top), carbohydrate (middle), and fat (bottom) oxidation [g·kg fat-free mass (FFM)−1·day−1] on CON (black bars) and EX (gray bars) days. Values are adjusted for room and sex. *Significantly different from CON day (P < 0.05). Cond, condition.
Twenty-four-hour substrate balances are presented in Fig. 3. Twenty-four-hour protein balance (Fig. 3A) was higher on the EX day (P < 0.01). The interaction between group and condition was not significant for 24-h carbohydrate balance (Fig. 3B). Twenty-four-hour carbohydrate balance was significantly lower on the EX day, with no significant differences between groups. The interaction between group and condition was not significant for 24-h fat balance (Fig. 3C). Twenty-four-hour fat balance was significantly higher on the EX day, with no significant differences between groups.
Fig. 3.
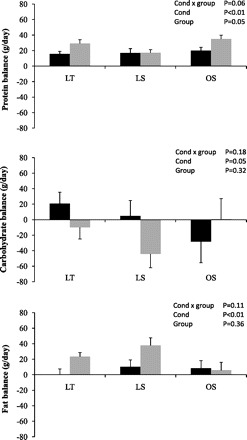
Twenty-four-hour (g/day) protein (top), carbohydrate (middle), and fat (bottom) balance on CON (black bars) and EX (gray bars) days. Values are adjusted for room and sex.
Circulating substrates and hormones.
There were no significant group × condition × time or group × condition interactions for glucose, insulin, FFA, or glycerol, indicating that the pattern of response for these variables was similar between the groups. Glucose concentrations (Fig. 4) increased following consumption of meals and decreased before the consumption of the next meal. The nonsignificant condition × time interaction indicated that the 24-h glucose profiles were not altered by the addition of exercise. However, there was a significant group × time effect (P = 0.02), reflecting the larger increases in glucose in OS compared with LT and LS following consumption of the breakfast meal. Changes in 24-h plasma insulin concentrations are illustrated in Fig. 5. The group × time interaction was not significant, indicating that the pattern in insulin response over the 24 h was similar in LT, LS, and OS. Insulin concentrations peaked following the consumption of meals and decreased before the next meal. However, the significant condition × time effect (P < 0.01) indicated that insulin concentrations were higher on the EX day, reflecting the higher energy intake on this day. Although the group × time interaction and group × condition interactions were not significant, larger insulin excursions were observed in LS compared with LT, and OS compared with both LS and LT. Changes in 24-h plasma FFA are illustrated in Fig. 6. There were significant group × time and condition × time effects (P < 0.001 for both). The group × time effect reflects the increase in FFA concentrations in LT and LS after the first stepping bout (which was performed before consumption of the breakfast meal) with no changes in OS. After consumption of the breakfast meal, plasma FFA were decreased and remained below fasting levels until the next morning. The condition × time effect reflects the higher postexercise FFA concentrations on the EX day. Plasma glycerol concentrations exhibited a similar pattern to plasma FFA (data not shown).
Fig. 4.
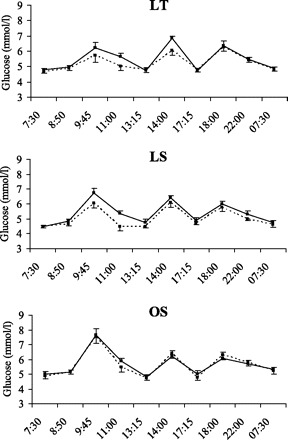
Twenty-four-hour glucose profiles in LT (top), LS (middle), and OS (bottom) on CON (dashed line) and EX (solid line) days.
Fig. 5.
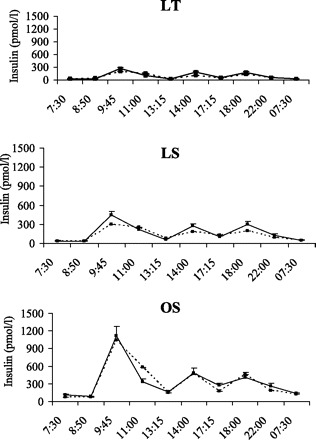
Twenty-four-hour insulin profiles in LT (top), LS (middle), and OS (bottom) on CON (dashed line) and EX (solid line) days.
Fig. 6.
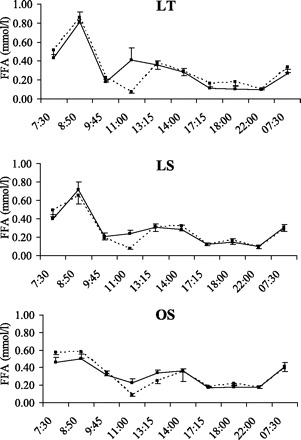
Twenty-four-hour free fatty acid (FFA) profiles in LT (top), LS (middle), and OS (bottom) on CON (dashed line) and EX (solid line) days.
DISCUSSION
The primary finding of this study is that even in endurance-trained individuals, exercise did not increase 24-h fat oxidation when subjects were studied in energy balance. As in our previous studies (27–30), 24-h carbohydrate oxidation was higher on the EX day, but 24-h fat oxidation did not significantly differ in any group between the CON and EX condition. Indeed, a small nonsignificant decrease in fat oxidation was observed in LS and LT, resulting in a significant increase in 24-h fat balance in these groups on the EX day. We also observed that in all groups on both the EX and CON days, insulin remained above and FFA remained below the fasted, early morning concentrations during the waking hours. For example, FFA concentrations were below and insulin concentrations above basal levels at 1100 (2 h after the consumption of the breakfast meal) and 2200 (2 h after the consumption of the evening snack). Exercise is known to cause an increase in circulating epinephrine concentrations during and after exercise; this would be expected to increase both carbohydrate oxidation and lipolysis during and after exercise. However, the high insulin concentrations would inhibit lipolysis and thus limit FFA availability. Importantly, the suppressive effect of insulin on lipolysis would be expected to last for several hours after plasma insulin concentrations return to basal, fasted levels. Because plasma FFA are the primary source of fat oxidized during and after exercise (21), we believe that carbohydrate oxidation predominates during and after exercise performed in the postprandial state because the availability of the primary source of fat is being restricted by consumption of meals. Thus we interpret our findings to suggest that the consumption of meals is a much more potent regulator of FFA availability and 24-h fat oxidation than is exercise.
Although the overall group effect for 24-h fat oxidation and fat balance was not significant, we did observe a different response in the OS compared with LS and LT (Figs. 2 and 3). Twenty-four-hour carbohydrate oxidation was higher on the EX day in LT and LS but not in OS (Table 2). Interestingly, these changes in 24-h substrate oxidation were mirrored by the changes in RQ during sleep. The reason for this difference in response is not entirely clear, but it may be due to the fewer number of subjects in the OS group. Closer examination of the individual data (Fig. 1) revealed that in most OS subjects, 24-h RQ on the EX day was either similar to or slightly higher than the CON day. However, the difference in one of these subjects (0.93 vs. 0.83) was larger than that observed in any other subject studied. Thus, given the small number of subjects in the OS group, it is possible that the nonsignificant effect of EX on fat balance in the OS group was being driven by this subject. Nonetheless, mean fat balance in the OS group was still positive, indicating that even OS subjects did not achieve negative 24-h fat balance on the EX day, which is consistent with the results observed in our previous study of obese individuals (25). In that study, 24-h RQ in obese individuals was 0.88 ± 0.01 under sedentary conditions and 0.90 ± 0.02 when subjects performed exercise (60 min at 40% of V̇o2peak). Thus we conclude that exercise does not result in negative 24-h fat balance when 24-h energy balance is maintained, and this is independent of training status or obesity.
Support for our findings is found in the studies of Burton et al. (6) and Dionne et al. (9). Burton et al. (6) compared the effects of exercise with and without energy replacement on postprandial lipid metabolism. Subjects performed three 2-day trials. On the first day, subjects either rested, performed exercise (∼660 kcal) with full energy replacement, or performed exercise without energy replacement. On day 2, postprandial responses to a test meal were measured for 8.5 h. Performing exercise without energy replacement modestly increased postprandial fat oxidation (33.5 ± 2.1 g) compared with the resting day (25.8 ± 1.8 g, P < 0.001). Exercise with energy replacement also increased postprandial fat oxidation (29.5 ± 1.8 g, P < 0.05), but a limitation of this study was that the overall state of energy balance and 24-h fat oxidation were not determined. Nonetheless, postprandial fat oxidation was lower when the calories of exercise were replaced (33.5 vs. 29.5 g). Dionne et al. (9) performed two 3-day trials in a room calorimeter under sedentary conditions. One trial was preceded by a rest day, and the other was preceded by a bout of exercise (60 min at 50% of V̇o2peak) with full replacement of the calories expended during exercise. There was no difference in total fat oxidation between conditions. These data (6, 9), coupled with our findings, suggest that fat oxidation after exercise will be determined by whether the calories burned during exercise are replaced (energy balance) or not (negative energy balance) and also help to reconcile why exercise training often induces a less than expected loss of fat mass (10, 35, 38); if energy intake increases to compensate for the energy expended in daily exercise, then daily fat oxidation will not increase, and fat balance will be maintained.
Nutritional status has a major effect on substrate utilization during exercise. Ingesting as little as 60 g (240 kcal) of carbohydrate in the hour before exercise completely suppresses lipolysis and fat oxidation during the subsequent exercise bout (8), and the increase in fat oxidation during exercise can be blunted for up to 6 h following consumption of a meal (31). This is largely caused by an insulin-induced suppression of lipolysis (17, 31). The half-maximal suppression of lipolysis has been shown to occur at insulin concentrations of ∼14 and 38 μU/ml in lean and obese subjects, respectively (7). These insulin concentrations are observed even with the consumption of just 10–20 g of carbohydrate, and the suppressive effects of insulin on lipolysis can last for several hours after the consumption of a meal (37). Consequently, when exercise is performed in the postprandial state, the exercising muscle will increase the oxidation of glycogen to compensate for the decrease in FFA availability (17). In the present study, plasma insulin was above the estimated half-maximal suppression concentrations at the time points in between meals (Fig. 5), which supports our conclusion that consumption of meals is a much more potent regulator of FFA availability and 24-h fat oxidation than is exercise.
It has long been known that endurance exercise training increases fat oxidation during submaximal exercise, as indicated by a lower respiratory exchange ratio and a sparing of muscle glycogen (5). Endurance exercise training increases the capacity of skeletal muscle to oxidize fat by increasing mitochondrial density, the activity of enzymes involved in β-oxidation, and oxygen delivery to muscle (21). Recent evidence also suggests that endurance training increases the gene expression and protein content of several fatty acid transporters, which may aid in the uptake and delivery of fatty acids to mitochondria (15). However, although endurance training increases the capacity of skeletal muscle to oxidize all substrates, including plasma FFA, carbohydrate is still the predominant energy source in exercising skeletal muscle (4, 12, 13). More importantly, meal consumption before exercise ameliorates the training-induced increase in fat oxidation during exercise (14). This was most eloquently demonstrated by Bergman and Brooks (3), who compared fat oxidation in trained (cyclists) and untrained men at various exercise intensities (∼20%, 40%, 60%, and 75% of V̇o2peak) in both the fed and fasted state. At each relative exercise intensity, the trained men oxidized more fat than untrained men when studied in the fasted state; but when studied in the fed state, trained and untrained men oxidized a similar amount of fat, regardless of exercise intensity. More importantly, at all exercise intensities, proportionally more carbohydrate was burned than fat in both trained and untrained men, whether studied in the fed of fasted state. Moreover, in trained men studied in the fed state, fat oxidation contributed less than 40% of total energy expenditure at all intensities and contributed less than 20% to total energy expenditure at the two higher exercise intensities. This same laboratory has also performed a series of longitudinal exercise training studies (4, 12, 13) and have consistently demonstrated that when exercise is performed in the postprandial or postabsorptive state 1) the primary source of fuel oxidized during exercise is carbohydrate, even when exercise is performed at an intensity (∼45–60% of V̇o2peak) at which fat oxidation rates are maximal; and 2) exercise training does not change the relative contribution of fat and carbohydrate during exercise. Collectively, the results of Brooks and colleagues (4, 12, 13) Burton et al. (6), and the present study suggest that 1) fat oxidation during exercise will be largely determined by the timing of exercise relative to consumption of a meal, and 2) fat oxidation after exercise will be determined by whether the calories burned during exercise were replaced (energy balance) or not (negative energy balance).
Alternatively, it could be that fat oxidation after exercise is determined by whether carbohydrate is replaced. However, Horowitz et al. (16) determined the effect of postexercise energy deficit, independent of carbohydrate availability, on substrate oxidation. Subjects performed exhaustive exercise and then either consumed a high-fat/low-carbohydrate diet that maintained estimated energy balance, or consumed a low-fat/high-carbohydrate diet that replaced carbohydrates but induced an energy deficit. Resting fat oxidation the next morning was increased on both diets but was greater when subjects were in energy deficit (and carbohydrates were replaced) than in energy balance (and carbohydrates not replaced). This suggests that energy balance is a more important factor driving postexercise fat oxidation than is carbohydrate availability.
We have considered the effects of several potential confounders. First, it may be suggested that the low fat intake (20%) confounded the results. The reason for the relatively low fat intake during the CON and EX conditions was that this study was conducted as part of a larger study comparing the effects of exercise and high-fat diets on substrate oxidation in these same subject groups. A 20% and 50% fat level was chosen for comparison to maximize, as much as possible in a clinical study, the difference in diet composition. However, it is unlikely that the low fat intake confounded the results of the present study. In our previous studies (27–30), the fat content of the diet was 30%, and we have consistently observed a higher 24-h RQ on days when exercise is performed. Additional support that the low-fat intake did not confound the present results can be found in the study of Smith et al. (36) that demonstrated that adaptation to an increase in dietary fat intake is improved when exercise is performed. However, even though adaptation was more complete, subjects were still in positive fat balance, supporting our conclusion that exercise does not induce negative fat balance when energy balance is maintained. Second, although V̇o2peak was measured in several obese subjects using a treadmill, it is unlikely that this confounded the results of the present study. V̇o2peak measured using a cycle ergometer would be ∼5% lower than that measured using a treadmill (1). Thus the cycle-specific exercise intensity was likely ∼5% higher in these individuals (∼60% vs. 55%). Maximal fat oxidation rates in this group would be predicted to occur at ∼52% of V̇o2peak (2). Thus, if anything, fat oxidation would be reduced in these subjects. However, we saw no evidence that these subjects had lower fat oxidation rates, and as a group, a lower 24-h RQ was observed in OS on the EX compared with CON (NS), suggesting a slightly higher fat oxidation occurred on the EX day in OS. Finally, although we successfully achieved energy balance on an individual basis, there were some differences between groups. Specifically, energy balance was slightly positive in LS and LT, but negative in OS. This may have slightly increased fat oxidation and reduced fat balance in OS compared with the other groups. Thus, if energy balance in OS was positive as it was in LS and LT, we would expect fat balance to be even higher, thus lending further support to our conclusion that exercise performed in energy balance does not induce negative fat balance, even in OS subjects. We also reanalyzed the data after adjusting for energy balance and obtained the same results (data not shown), suggesting that differences in energy balance did not confound the results.
In the present study, we achieved levels of energy balance that are much tighter than previously published 24-h room calorimeter studies, including those conducted by our group (27–30). Energy balance was within 100 kcal for both LS and OS and was similar between conditions in these groups. However, energy balance in LT subjects was ∼8 kcal during CON and 134 kcal on EX. Although statistically nonsignificant, it could be questioned whether this difference is physiologically meaningful. However, the caloric equivalent of positive fat balance during the EX condition in the LT (23 g × 9 kcal/g = 208 kcal) exceeds the caloric value of the energy balance, suggesting that the increase in fat balance was due to more than just the effects of energy balance. Finally, it must be stressed that all groups were in the same state of energy balance under both the CON and EX conditions, suggesting that the state of energy balance did not confound the differences between conditions within each group.
Another point that is worthy of discussion is that because none of the OS subjects were studied in the new calorimeter, the different responses in this group may be due to differences in the measurement of Vo2 and Vco2 between the rooms rather than differences between groups. As mentioned above, in our previous study of obese individuals (performed in the old calorimeter), we observed a higher 24-h RQ and lower fat oxidation during exercise compared with sedentary conditions (25). Thus the results from the two different rooms were consistent (i.e., exercise did not induce negative fat balance in obese individuals in either study, when energy balance was maintained).
There are several limitations to the present findings. First, studying subjects in energy balance may be perceived as an artificial situation. However, the aim of this study was to determine the independent effect of exercise on 24-h fat oxidation, which can only be done if subjects are in energy balance. Second, we also only studied the acute effects of a single bout of exercise, and it is likely that meaningful effects on fat mass will only be achieved with chronic exercise. However, many individuals do not exercise every day, and thus the acute model is more representative of the metabolic responses of these individuals. Nonetheless, studies examining the effects of consecutive days of exercise on fat balance are warranted. Third, because the subject groups performed exercise for the same duration of time, they necessarily differed in the energy expended during exercise. In planning this study, we debated the merits of anchoring the exercise bout on total energy expenditure or on time. We elected the latter, because particularly with regard to weight loss, exercise is prescribed in terms of time. In our previous studies, we have used both approaches and always see the same result: fat oxidation is not different on an exercise and sedentary day if energy balance is maintained (27–30). Moreover, since all subjects were studied in energy balance, it is unlikely that the difference in energy expenditure during exercise impacted the result. Finally, we obtained blood samples at a relatively few number of time points; it would be of interest to obtain more frequent samples to more completely characterize the 24-h patterns of glucose, insulin, and FFA.
In conclusion, exercise does not increase 24-h fat oxidation when overall energy balance is maintained, even in endurance-trained individuals. It appears that the state of energy balance is an underappreciated factor in determining the impact of exercise on fat oxidation and perhaps body fat mass. Indeed, the plethora of studies that demonstrate that exercise produces less than expected weight loss are consistent with our conclusion that in nonfasted individuals, exercise has little effect on daily fat oxidation. This may be a sobering message for those that use exercise to promote loss of fat mass. Although we do not discount the numerous benefits of regular endurance exercise on various aspects of health (e.g., improving lipid profiles and insulin sensitivity), we do think it is time to reconsider how we promote exercise as a means of inducing fat loss. Just as it is difficult to determine the impact of changes in diet on body weight and body fat mass without considering exercise, these results suggest we cannot determine the impact of exercise on total fat oxidation and body fat mass without considering diet or perhaps the timing of meals relative to exercise. We believe these results point out the importance of conducting studies controlling both diet and exercise to identify the condition under which exercise would have the greatest impact on body fat mass. We also offer that in individuals performing moderate amounts of exercise (e.g., <1 h/day), the primary benefit of endurance exercise on body weight may be in preventing additional increases in fat mass or in preventing regain of fat mass after weight loss.
GRANTS
This research was supported by a Mentored Scientist Award (National Institutes of Health K01-DK-061348) to E. L. Melanson and the University of Colorado Denver Clinical and Translational Science Award (1UL1-RR-025780).
DISCLOSURES
No conflicts of interest are declared by the authors.
ACKNOWLEDGMENTS
We thank the volunteers, as well as the Nursing, Clinical Lab, and Bionutrition Staffs of the University of Colorado Denver CTRC.
REFERENCES
- 1. American College of Sports Medicine. Exercise testing. In: Guidelines for Exercise Testing and Prescription (7th ed.), edited by Whaely MH. Baltimore, MD: Lippincott Williams and Williams, 2006, p. 93–115 [Google Scholar]
- 2. Achten J, Jeukendrup AE. Optimizing fat oxidation through exercise and diet. Nutrition 20: 716–727, 2004. [DOI] [PubMed] [Google Scholar]
- 3. Bergman BC, Brooks GA. Respiratory gas-exchange ratios during graded exercise in fed and fasted trained and untrained men. J Appl Physiol 86: 479–487, 1999. [DOI] [PubMed] [Google Scholar]
- 4. Bergman BC, Butterfield GE, Wolfel EE, Casazza GA, Lopaschuk GD, Brooks GA. Evaluation of exercise and training on muscle lipid metabolism. Am J Physiol Endocrinol Metab 276: E106–E117, 1999. [DOI] [PubMed] [Google Scholar]
- 5. Brooks GA, Mercier J. Balance of carbohydrate and lipid utilization during exercise: the “crossover” concept. J Appl Physiol 76: 2253–2261, 1994. [DOI] [PubMed] [Google Scholar]
- 6. Burton FL, Malkova D, Caslake MJ, Gill JM. Energy replacement attenuates the effects of prior moderate exercise on postprandial metabolism in overweight/obese men. Int J Obes (Lond) 32: 481–489, 2008. [DOI] [PubMed] [Google Scholar]
- 7. Campbell PJ, Carlson MG, Nurjhan N. Fat metabolism in human obesity. Am J Physiol Endocrinol Metab 266: E600–E605, 1994. [DOI] [PubMed] [Google Scholar]
- 8. Coyle EF, Coggan AR, Hemmert MK, Lowe RC, Walters TJ. Substrate usage during prolonged exercise following a preexercise meal. J Appl Physiol 59: 429–433, 1985. [DOI] [PubMed] [Google Scholar]
- 9. Dionne I, Van Vugt S, Tremblay A. Postexercise macronutrient oxidation: a factor dependent on postexercise macronutrient intake. Am J Clin Nutr 69: 927–930, 1999. [DOI] [PubMed] [Google Scholar]
- 10. Donnelly JE, Hill JO, Jacobsen DJ, Potteiger J, Sullivan DK, Johnson SL, Heelan K, Hise M, Fennessey PV, Sonko B, Sharp T, Jakicic JM, Blair SN, Tran ZV, Mayo M, Gibson C, Washburn RA. Effects of a 16-month randomized controlled exercise trial on body weight and composition in young, overweight men and women: the Midwest Exercise Trial. Arch Intern Med 163: 1343–1350, 2003. [DOI] [PubMed] [Google Scholar]
- 11. Flatt JP. Dietary fat, carbohydrate balance, and weight maintenance. Ann NY Acad Sci 683: 122–140, 1993. [DOI] [PubMed] [Google Scholar]
- 12. Friedlander AL, Casazza GA, Horning MA, Buddinger TF, Brooks GA. Effects of exercise intensity and training on lipid metabolism in young women. Am J Physiol Endocrinol Metab 275: E853–E863, 1998. [DOI] [PubMed] [Google Scholar]
- 13. Friedlander AL, Jacobs KA, Fattor JA, Horning MA, Hagobian TA, Bauer TA, Wolfel EE, Brooks GA. Contributions of working muscle to whole body lipid metabolism are altered by exercise intensity and training. Am J Physiol Endocrinol Metab 292: E107–E116, 2007. [DOI] [PubMed] [Google Scholar]
- 14. Helge JW, Richter EA, Kiens B. Interaction of training and diet on metabolism and endurance during exercise in man. J Physiol 492: 293–306, 1996. [DOI] [PMC free article] [PubMed] [Google Scholar]
- 15. Holloway GP, Luiken JJ, Glatz JF, Spriet LL, Bonen A. Contribution of FAT/CD36 to the regulation of skeletal muscle fatty acid oxidation: an overview. Acta Physiol (Oxf) 194: 293–309, 2008. [DOI] [PubMed] [Google Scholar]
- 16. Horowitz JF, Kaufman AE, Fox AK, Harber MP. Energy deficit without reducing dietary carbohydrate alters resting carbohydrate oxidation and fatty acid availability. J Appl Physiol 98: 1612–1618, 2005. [DOI] [PubMed] [Google Scholar]
- 17. Horowitz JF, Mora-Rodriguez R, Byerley LO, Coyle EF. Lipolytic suppression following carbohydrate ingestion limits fat oxidation during exercise. Am J Physiol Endocrinol Metab 273: E768–E775, 1997. [DOI] [PubMed] [Google Scholar]
- 18. Jequier E, Acheson K, Schutz Y. Assessment of energy expenditure and fuel utilization in man. Annu Rev Nutr 7: 187–208, 1987. [DOI] [PubMed] [Google Scholar]
- 19. Jeukendrup AE. Regulation of fat metabolism in skeletal muscle. Ann NY Acad Sci 967: 217–235, 2002. [DOI] [PubMed] [Google Scholar]
- 20. Kelley DE, Goodpaster BH. Skeletal muscle triglyceride. An aspect of regional adiposity and insulin resistance. Diabetes Care 24: 933–941, 2001. [DOI] [PubMed] [Google Scholar]
- 21. Kiens B. Skeletal muscle lipid metabolism in exercise and insulin resistance. Physiol Rev 86: 205–243, 2006. [DOI] [PubMed] [Google Scholar]
- 22. Kiens B, Essen-Gustavsson B, Christensen NJ, Saltin B. Skeletal muscle substrate utilization during submaximal exercise in man: effect of endurance training. J Physiol 469: 459–478, 1993. [DOI] [PMC free article] [PubMed] [Google Scholar]
- 23. Kim JY, Hickner RC, Cortright RL, Dohm GL, Houmard JA. Lipid oxidation is reduced in obese human skeletal muscle. Am J Physiol Endocrinol Metab 279: E1039–E1044, 2000. [DOI] [PubMed] [Google Scholar]
- 24. Livesey G, Elia M. Estimation of energy expenditure, net carbohydrate utilization, and net fat oxidation and synthesis by indirect calorimetry: evaluation of errors with special reference to the detailed composition of fuels. Am J Clin Nutr 47: 608–628, 1988. [DOI] [PubMed] [Google Scholar]
- 25. Melanson EL, Bessesen DH, Cornier MA, Maclean PS, Grunwald G, Hill JO. 24 h substrate oxidation following diet-induced weight loss (Abstract). Obesity 16, Suppl 1: S53–S54, 2008. 18978764 [Google Scholar]
- 27. Melanson EL, Donahoo WT, Grunwald GK, Schwartz R. Changes in 24-h substrate oxidation in older and younger men in response to exercise. J Appl Physiol 103: 1576–1582, 2007. [DOI] [PubMed] [Google Scholar]
- 28. Melanson EL, Sharp TA, Seagle HM, Donahoo WT, Grunwald GK, Peters JC, Hamilton JT, Hill JO. Resistance and aerobic exercise have similar effects on 24-h nutrient oxidation. Med Sci Sports Exerc 34: 1793–1800, 2002. [DOI] [PubMed] [Google Scholar]
- 29. Melanson EL, Sharp TA, Seagle HM, Donahoo WT, Grunwald GK, Peters JC, Hamilton JT, Hill JO. Twenty-four-hour metabolic responses to resistance exercise in women. J Strength Cond Res 19: 61–66, 2005. [DOI] [PubMed] [Google Scholar]
- 30. Melanson EL, Sharp TA, Seagle HM, Horton TJ, Donahoo WT, Grunwald GK, Hamilton JT, Hill JO. Effect of exercise intensity on 24-h energy expenditure and nutrient oxidation. J Appl Physiol 92: 1045–1052, 2002. [DOI] [PubMed] [Google Scholar]
- 31. Montain SJ, Hopper MK, Coggan AR, Coyle EF. Exercise metabolism at different time intervals after a meal. J Appl Physiol 70: 882–888, 1991. [DOI] [PubMed] [Google Scholar]
- 32. Phillips SM, Green HJ, Tarnopolsky MA, Heigenhauser GF, Hill RE, Grant SM. Effects of training duration on substrate turnover and oxidation during exercise. J Appl Physiol 81: 2182–2191, 1996. [DOI] [PubMed] [Google Scholar]
- 33. Schoffelen PF, Westerterp KR. Intra-individual variability and adaptation of overnight- and sleeping metabolic rate. Physiol Behav 94: 158–163, 2008. [DOI] [PubMed] [Google Scholar]
- 34. Skogerboe KJ, Labbe RF, Rettmer RL, Sundquist JP, Gargett AM. Chemiluminescent measurement of total urinary nitrogen for accurate calculation of nitrogen balance. Clin Chem 36: 752–755, 1990. [PubMed] [Google Scholar]
- 35. Slentz CA, Duscha BD, Johnson JL, Ketchum K, Aiken LB, Samsa GP, Houmard JA, Bales CW, Kraus WE. Effects of the amount of exercise on body weight, body composition, and measures of central obesity: STRRIDE—a randomized controlled study. Arch Intern Med 164: 31–39, 2004. [DOI] [PubMed] [Google Scholar]
- 36. Smith SR, de Jonge L, Zachwieja JJ, Roy H, Nguyen T, Rood J, Windhauser M, Volaufova J, Bray GA. Concurrent physical activity increases fat oxidation during the shift to a high-fat diet. Am J Clin Nutr 72: 131–138, 2000. [DOI] [PubMed] [Google Scholar]
- 37. Solomon SS, Duckworth WC. Effect of antecedent hormone administration on lipolysis in the perifused isolated fat cell. J Lab Clin Med 88: 984–994, 1976. [PubMed] [Google Scholar]
- 38. Wilmore JH, Despres JP, Stanforth PR, Mandel S, Rice T, Gagnon J, Leon AS, Rao D, Skinner JS, Bouchard C. Alterations in body weight and composition consequent to 20 wk of endurance training: the HERITAGE Family Study. Am J Clin Nutr 70: 346–352, 1999. [DOI] [PubMed] [Google Scholar]
- 39. Zurlo F, Lillioja S, Esposito-Del Puente A, Nyomba BL, Raz I, Saad MF, Swinburn BA, Knowler WC, Bogardus C, Ravussin E. Low ratio of fat to carbohydrate oxidation as predictor of weight gain: study of 24-h RQ. Am J Physiol Endocrinol Metab 259: E650–E657, 1990. [DOI] [PubMed] [Google Scholar]