

Abstract
The L-type calcium channel (LTCC) provides trigger Ca2+ for sarcoplasmic reticulum Ca-release, and LTCC function is influenced by interacting proteins including the LTCC distal COOH terminus (DCT) and calmodulin. DCT is proteolytically cleaved and reassociates with the LTCC complex to regulate calcium channel function. DCT reduces LTCC barium current (IBa,L) in reconstituted channel complexes, yet the contribution of DCT to LTCC Ca2+ current (ICa,L) in cardiomyocyte systems is unexplored. This study tests the hypothesis that DCT attenuates cardiomyocyte ICa,L. We measured LTCC current and Ca2+ transients with DCT coexpressed in murine cardiomyocytes. We also heterologously coexpressed DCT and CaV1.2 constructs with truncations corresponding to the predicted proteolytic cleavage site, CaV1.2Δ1801, and a shorter deletion corresponding to well-studied construct, CaV1.2Δ1733. DCT inhibited IBa,L in cardiomyocytes, and in human embryonic kidney (HEK) 293 cells expressing CaV1.2Δ1801 and CaV1.2Δ1733. Ca2+-CaM relieved DCT block in cardiomyocytes and HEK cells. The selective block of IBa,L combined with Ca2+-CaM effects suggested that DCT-mediated blockade may be relieved under conditions of elevated Ca2+. We therefore tested the hypothesis that DCT block is dynamic, increasing under relatively low Ca2+, and show that DCT reduced diastolic Ca2+ at low stimulation frequencies but spared high frequency Ca2+ entry. DCT reduction of diastolic Ca2+ and relief of block at high pacing frequencies and under conditions of supraphysiological bath Ca2+ suggests that a physiological function of DCT is to increase the dynamic range of Ca2+ transients in response to elevated pacing frequencies. Our data motivate the new hypothesis that DCT is a native reverse use-dependent inhibitor of LTCC current.
Keywords: L-type calcium channel, cardiac myocytes, cardiomyocytes, calcium transients, calcium current
the l-type calcium channel (LTCC) is the main pathway for Ca2+ entry into cardiomyocyte cytosol (2). LTCC Ca2+ current (ICa,L) triggers a larger Ca2+ release from intracellular stores ultimately leading to cardiac contraction. Thus minor increases of LTCC function can trigger larger changes in cytosolic Ca2+ entry; this process is commonly called calcium-induced calcium release (CICR). During diastole LTCC open probability (Po) is relatively low minimizing CICR under normal conditions; however, Po does not reach an absolute zero level. Elevation of diastolic Ca2+ is strongly associated with pathologies (10). Therefore, mechanisms preventing LTCC initiated CICR during diastole are of potential importance.
The LTCC in cardiomyocytes is composed of a multi-protein complex (3) and has been widely studied in cardiomyocytes and heterologous expression systems. Studies of ICa,L in cardiomyocytes are necessary because it is not possible to completely reconstitute a native LTCC complex in a heterologous expression system. In contrast, heterologous expression systems are advantageous because they allow the control of selected components of the LTCC complex. The minimal components to produce ICa,L in heterologous express systems include the CaV1.2 pore-forming α-subunit and CaVβ (28). Additional components of the complex modify ICa,L gating and kinetics in nonmyocyte expression systems (29).
Cardiac CaV1.2, the main pore-forming subunit, is an ∼2,171 amino acid protein with a predicted molecular mass of ∼250 kDa (5, 25, 34). The precise length varies with species (34) and splice variants (24). A conserved feature of CaV1.2 is that the carboxy terminus is located in the cytosolic space. Spectroscopy studies show that the closely related CaV1.1 isoform is proteolytically cleaved at a site in the carboxy terminus. This site corresponds to a predicted calpain cleavage site that is conserved with the CaV1.2 channel (21). The CaV1.2 distal carboxy terminus (DCT) is a protein with a predicted mass of ∼37 kDa (21, 22), leaving a <200 kDa CaV1.2 protein in the cardiomyocyte LTCC complex. It should be noted here that CaV1.2 heterologously expressed in nonexcitable cells is not subject to proteolytic processing as in cardiomyocytes, rather functions as an intact ∼250 kDa protein. Western blot studies of CaV1.2 in cardiomyocytes consistently show CaV1.2 migrating as a 190- and a 240-kDa protein (1, 9). This suggests that not all channels are processed. Regardless, DCT is partially localized to the nucleus where it can modify gene expression in neurons (17) or cardiomyocytes (31). DCT also localizes to the cytosol and surface membrane, presumably in complex with the LTCC.
The CaV1.2 DCT blocks LTCC Ba2+ currents (IBa,L) in heterologous expression systems (16, 22). Early studies of deletion analysis of CaV1.2 expressed in HEK cells presaged the current view that DCT inhibits LTCC current (38). These previous studies showed that the shorter the CaV1.2 channel truncation, the larger the resulting current (16). Subsequently, Hulme et al. showed that coexpression of DCT with truncated CaV1.2 reduced IBa,L (22). Moreover, these studies indicate that DCT reassociates with CaV1.2 near the CB/IQ domain on the proximal carboxy terminus (PCT). It is notable that the DCT interaction site overlaps the well-characterized CaV1.2 PCT CaM interaction domains (35). Therefore it is plausible to suggest that CaM may modulate DCT-LTCC function. To date, there are no reports of DCT effects on ICa,L, nor is there a demonstration of DCT effects on LTCC function in cardiomyocytes (14).
The purpose of this study was to test the hypothesis that DCT inhibits ICa,L in cardiomyocytes. Cardiomyocyte LTCC current was tested, as well as a CaV1.2Δ1733+β2a+DCT complex in HEK 293 cells. DCT inhibited IBa,L but not ICa,L. To further explore implications of a selective IBa,L blockade we tested the effect of DCT on Ca2+ transients and discovered that DCT suppresses diastolic Ca2+ in a low frequency-dependent fashion. At high-pacing frequency DCT blockade was not significant. This reveals a new mechanism of action by DCT as a native reverse use-dependent inhibitor (RUDI) of LTCC function.
MATERIALS AND METHODS
Plasmids and mutagenesis.
Full-length CaV1.2 plasmid (provided by Dr. T. Kamp, University of Wisconsin) was identical to the cloned full-length rabbit cardiac α1C-subunit (26, 33) except for alternative splicing in domain IV S3(33). Rat CaVβ2a plasmid (provided by Dr. E. Perez-Reyes, University of Virginia) (28) contains two cysteine residues within the D1 domain associated with palmitoylation. CaM1234 was provided by David T. Yue (Johns Hopkins University), and CaV1.2Δ1801 was provided by Henry Colecraft (Columbia University).
Animals and electrophysiology.
Mice were housed in a pathogen-free facility and handled in accordance with standard use protocols, animal welfare regulations, and the National Institutes of Health Guide for the Care and Use of Laboratory Animals. All protocols were approved by the University of Kentucky Institutional Animal Care and Use Committee (IACUC protocol No. 00963M). Fetal ventricular cardiomyocytes were isolated as described previously (23). Timed pregnant dams of embryonic day 16-19 (E16–19) were anesthetized with ketamine (90 mg/kg) + xylazine (10 mg/kg) injected intraperitoneally. Litters were removed. Fetuses were decapitated and hearts excised. While under anesthesia the dam was euthanatized by heart excision. HEK 293 cells were transiently transfected with plasmids 4–6 h using Lipofectamine 2000 transfection (Invitrogen); then recordings were performed 24–48 h after transfection, as previously described (8). Transfected cells were identified by the expression of enhanced green fluorescent protein (eGFP). The whole cell configuration of the patch-clamp technique was used to measure ionic current. Patch electrodes with resistances of 1–2.5 MΩ contained pipette solution consisting of (in mM) 110 K-gluconate (or 110 TEA-Cl), 40 CsCl, 3 EGTA, 1 MgCl2, 5 Mg-ATP, and 5 HEPES, pH to 7.36, with CsOH. The bath solution for HEK cells consisted of (in mM) 130 (or 112.5) CsCl, 2.5 (or 30) BaCl2 or CaCl2, 1 MgCl2, 10 tetraethylammonium-Cl, 5 HEPES, and 5 glucose, pH 7.4 with CsOH. For fetal ventricular myocytes, the physiological salt solution contained 140 NaCl, 1.8 CaCl2, 1 MgCl2, 5.4 KCl, 10 glucose, and 10 HEPES, pH 7.4. The Na-free bath was 150 N-methyl-d-glucamine, 2.5 BaCl2 (or CaCl2), 1 MgCl2, 10 HEPES, 10 glucose, and 5 4-aminopyridine, pH 7.4. Signals were amplified with an Axopatch 200B amplifier, with series resistance compensation, and captured at 333 kHz A/D system (Axon Instruments, Union City, CA). For myocytes, current-voltage curves were generated by voltage clamp protocols consisting of Vhold = −80 mV, Vprepulse = −40 mV for 100 ms, followed by Vtest for 310 ms ranging from −60 mV to +80 mV in 10-mV increments. The 100 ms Vprepulse to −40 mV inactivated voltage-gated Na+ currents. For analysis of voltage dependence of steady state inactivation, myocytes were held at −80 mV and subjected to a 50-ms prepulse at 0 mV, followed by a 2-s steady state inactivation pulse from −80 mV to +20 mV in 10-mV increments, then a test-pulse to 0 mV for 300 ms. Eight-second intervals elapsed between each recording sweep. For HEK 293 cells, current-voltage curves were generated by voltage clamp protocols consisting of Vhold = −80 mV followed by 320 ms Vtest pulse ranging from −80 mV to +80 mV in 5-mV increments. Whole cell recordings used P/4 leak subtraction. Activation voltage dependence parameters were obtained by fitting current-voltage curves to a modified Boltzmann distribution of the form: I-V = Gmax*(V − Erev)/(1 + exp(V½ − V)/k), where Gmax is maximal conductance, Erev is reversal potential, V½ is activation midpoint potential, and k is the slope factor. Data were analyzed with Clampfit 9.2 (Axon Instruments), Origin v7 (OriginLab, Northampton, MA), and unpaired t-test with Welch's correction performed with Prism 5 (GraphPad Software). Sample sizes are listed in the figure and table legends.
Ca2+ imaging.
E18 fetal mouse cardiomyocytes were used 24–72 h after Lipofectamine 2000 transfection (Invitrogen). Myocytes plated on Poly-L-Lysine 25-mm square glass coverslips were incubated with 2 μM of freshly mixed fura-2 AM (Molecular Probes; F-1221) + 10% FBS media for 8 min at 37°C. Coverslips were transferred to a custom-designed microscope chamber system containing physiological salt solution with 1.8 mM CaCl2. Transfected cells were identified by the eGFP or eGFP fused CaV1.2 (1821–2171) at the NH2 terminus. Cells were measured initially for 20 s without pacing, and then paced at 1, 2, 3, 0.5, and 0 Hz for 20–60 s at each frequency. Diastolic F340/F380 ratios were determined using Clampfit 9.2. Ca2+ calibrations were performed as in reference (13). All recordings were performed at room temperature (20–22°C) using IonOptix Myocyte Calcium Recording System, Myopacer Field Stimulator, and IonWizard 4.4 revision 13 (IonOptix, Milton, MA). We used unpaired Student's t-test with Welch's correction to test for significance between control and experimental groups.
RESULTS
DCT regulation of CaV1.2 current in a heterologous expression system.
CaV1.2 truncation at amino acid position 1733 (CaV1.2Δ1733) provided early clues to the potential inhibitory contribution of DCT (16, 38). Subsequent studies demonstrated that DCT blocked IBa,L when DCT was coexpressed with CaV1.2Δ1801(15) (22). We tested both CaV1.2Δ1733 and CaV1.2Δ1801 coexpressed with CaVβ2a and DCT in HEK 293 cells. CaV1.2Δ1733-expressing cells displayed DCT blockade in a similar pattern to that for DCT in cardiomyocytes (see below). DCT reduced peak IBa,L but not ICa,L (Fig. 1, A, i and ii). DCT interacts with the proximal carboxy terminus of CaV1.2 in a region that overlaps with CaM-CaV1.2 interaction (22). We therefore tested the effect of coexpression of DCT and CaM. DCT inhibition of IBa,L was reversed by coexpression of CaM with DCT (Fig. 1, A, iii and iv, and B). ICa,L and IBa,L were recorded in all cells, and the relative peak current difference between ICa,L and IBa,L serves as an internal check that DCT selectively interferes with IBa,L but spares ICa,L (Fig. 1B). Note that maximal IBa,L relative to ICa,L is distinct with DCT expression compared with other conditions (Fig. 1A, ii to i, iii, and iv). CaV1.2Δ1801-expressing cells also exhibited DCT inhibition of peak IBa,L; however, this was accompanied by a commensurate decrease of ICa,L (Fig. 2). We will show below that the CaV1.2Δ1733 construct tracks with data from cardiomyocytes. In heterologous expression, both CaV1.2 truncation constructs mimic DCT attenuation of cardiomyocyte peak IBa,L. The absence of ICa,L block of peak cardiomyocyte current is also captured by the CaV1.2Δ1733 construct used in HEK recordings.
Fig. 1.

L-type calcium channel (LTCC) distal COOH terminus (DCT) decreases LTCC barium current (IBa,L) but not LTCC Ca2+ current (ICa,L) from Δ1733 truncation of CaV1.2 expressed in human embryonic kidney (HEK) 293 cells in parallel with that observed in cardiomyocytes. A: current-voltage relationships for ICa,L (■) and IBa,L (○) for control (i), DCT overexpression (ii), CaM overexpression (iii), and DCT + CaM dual overexpression (iv). Note the difference in the relative IBa,L vs. ICa,L curves for DCT in contrast with all other conditions. Ai and Aii, insets: expanded views of ICa,L at low voltages. Note that the Boltzmann distribution fit deviates from the data particularly for Vtest ranging from −35 to −20 mV. B, left: peak ICa,L density for potential eliciting maximal current (+20 mV) shows no significant difference by DCT. B, right: peak IBa,L density for potential eliciting maximal current (+5 mV) is significantly reduced by DCT, and DCT + CaM restores current amplitude. CaM alone has no significant effect. Sample sizes are listed in Table 1. *P = 0.007 and **P = 0.006 for DCT vs. control and DCT vs. DCT + CaM, respectively. eGFP, enhanced green fluorescent protein.
Fig. 2.
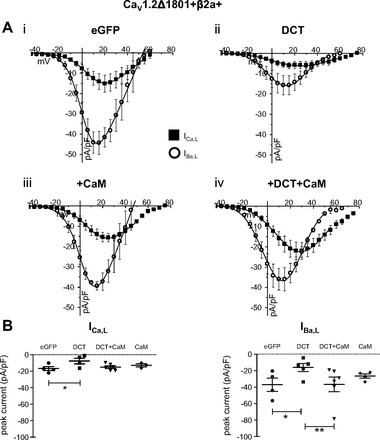
DCT decreases IBa,L, and ICa,L from CaV1.2Δ1801 truncation of CaV1.2 expressed in HEK 293 cells. A: current-voltage relationships for ICa,L (■) and IBa,L (○) for control (i), DCT overexpression (ii), CaM overexpression (iii), and DCT + CaM dual overexpression (iv). B, left: DCT reduces the peak ICa,L density at Vtest +20 mV (P < 0.05). B, right: DCT reduces the peak IBa,L density, and DCT + CaM restores current amplitude. CaM alone has no significant effect. *P = 0.01 and **P = 0.007 for DCT vs. control and DCT vs. DCT + CaM, respectively.
DCT did not significantly alter the voltage dependence of activation for ICa,L or IBa,L (Table 1), with one notable exception. CaV1.2Δ1733 ICa,L required a second Boltzmann distribution to fit data negative to −20 mV (Fig. 1Aii, inset). Seven of eight DCT-expressing cells appeared with data points that fell below the fit line for Vtest ranging from −20 to −35 mV, whereas a single Boltzmann distribution approximated the data as shown in Fig. 1Ai for all cells in the eGFP control group (P < 0.001; Fishers exact test). There is no voltage threshold for LTCC opening. Rather, at relatively negative voltages, Po is at very low levels. These results are consistent with the notion that DCT preferentially inhibits LTCC when Po is relatively low.
Table 1.
Voltage dependence of current activation Boltzmann fit of V1/2 and k for CaV1.2Δ1733 and CaV1.2Δ1801
| eGFP | DCT | CaM | DCT + CaM | |
|---|---|---|---|---|
| CaV1.2Δ1733+β2a+ | ||||
| 30 Calcium | ||||
| n | 8 | 8‡ | 5 | 10 |
| V1/2, mV | 7.0 ± 0.7 | 9.8 ± 1.7 | 8.2 ± 3.0 | 8.7 ± 0.9 |
| k, mV | 10 ± 1.1 | 9.7 ± 0.5 | 10.1 ± 0.4 | 9.0 ± 0.2 |
| 30 Barium | ||||
| n | 10 | 8 | 5 | 13 |
| V1/2 | −3.1 ± 1.1 | −1.3 ± 1.6 | −6.5 ± 1.5 | −2.4 ± 1.8 |
| k | 6.7 ± 0.2 | 7.7 ± 0.3 | 7.4 ± 0.6 | 6.8 ± 0.4 |
| CaV1.2Δ1801+β2a+ | ||||
| 30 Calcium | ||||
| n | 4 | 10 | 7 | 11 |
| V1/2 | 8.6 ± 0.95 | 3.4 ± 0.69 | 11.7 ± 0.65 | 11.0 ± 0.6 |
| k | 8.8 ± 0.43 | 9.8 ± 0.28 | 9.2 ± 0.31 | 8.9 ± 0..22 |
| 30 Barium | ||||
| n | 4 | 10 | 7 | 11 |
| V1/2 | 2.2 ± 0.43 | −1.4 ± 0.44 | 4.6 ± 0.35 | −1.5 ± 0.50 |
| k | 6.7 ± 0.25 | 6.9 ± 0.25 | 7.2 ± 0.17 | 6.8 ± 0.3 |
Values are means ± SE. A double Boltzmann equation was required to satisfy all points for distal COOH terminus (DCT) coexpression in 7 of 8 cells with 30 mM Ca.
Similar behavior with barium currents was noted by Hulme et al. (22). eGFP, enhanced green fluorescent protein; V1/2, activation midpoint potential; k, slope factor.
Role of Ca2+-CaM in CaM-DCT current restoration.
To distinguish between Ca2+ and Ca2+-CaM requirement for relief of DCT blockade we coexpressed CaM1234 (Ca2+ binding-deficient mutant) (29) with CaVΔ1733 and measured IBa,L and ICa,L. We focused on CaVΔ1733 for this experiment because this construct captured DCT effects on cardiomyocyte IBa,L and ICa,L (see below). Figure 3A shows the response of IBa,L and ICa,L to CaM1234 with or without DCT. CaM1234 did not restore current in cells coexpressing DCT. Rather, both the Ba2+ and Ca2+ current amplitudes in control and DCT group were indistinguishable. CaM1234 reduced the control IBa,L, and DCT + CaM1234 did not result in an additive block (Fig. 3B). Comparison of IBa,L and ICa,L I-V curves for CaM1234 expression (Fig. 3) to IBa,L and ICa,L I-V curves without CaM1234 (Figs. 1A, i to ii, and 3A, i to ii) illustrates that CaM1234 preferentially blocked IBa,L compared with ICa,L. Taken together, these results show that CaM1234 and DCT individually exert similar action on LTCC current. These results are consistent with a model that limiting channel Po and limiting Ca2+ favors increased DCT blockade.
Fig. 3.
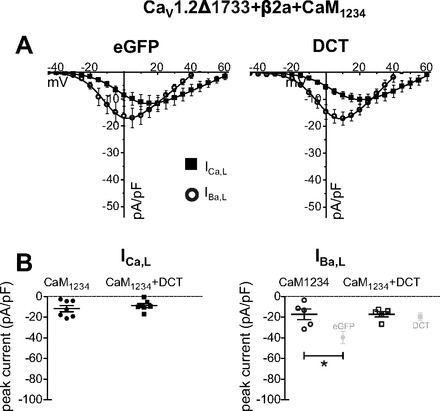
CaM1234 blocks IBa,L, and DCT blockade is not additive in Cav1.2Δ1733 coexpressed in HEK 293 cells. A: DCT coexpression with CaM1234 decreases IBa,L, but the effect is not additive with ICa,L (■) and IBa,L (○). BAPTA (10 mM) in the pipette does not affect the IBa,L inhibition by DCT (data not shown). There is no apparent synergistic effect of DCT + CaM1234. B, left: peak ICa,L density for potential eliciting maximal current (+20 mV) shows no significant difference by DCT. B, right: peak IBa,L density for potential eliciting maximal current (+5 mV). Light gray data points show eGFP and DCT data from Fig. 1B, right, for reference. *P < 0.01.
DCT and LTCC current kinetics.
Voltage-dependent inactivation (VDI) was measured as the fractional remaining IBa,L 300 ms after Vtest. CaV1.2Δ1733 or CaV1.2 Δ1801 channels coexpressed with DCT showed indistinguishable VDI (Fig. 4, A and B; CaV1.2Δ1801 not shown). CaM coexpression also did not alter VDI. CaM-CaV1.2 PCT interaction leads to calcium-dependent inactivation (CDI) (29). Given that CaM antagonized DCT inhibition of current, we asked whether DCT reciprocally interferes with CDI. ICa,L decay kinetics, a measure of CDI, was also not significantly altered by DCT (Fig. 4, A and B; CaV1.2Δ1801 not shown). CaM1234 overexpression has a dominant negative effect on CDI imposed by endogenous HEK CaM. Consistent with earlier findings CaM1234 reduced CDI (29). Coexpression of CaM1234 + DCT further reduced CDI. In summary, for heterologously expressed LTCC, DCT blocks IBa,L but not ICa,L; this effect can be masked by CaM overexpression, and CaM1234 and DCT show similar, nonsynergistic effects on LTCC function.
Fig. 4.
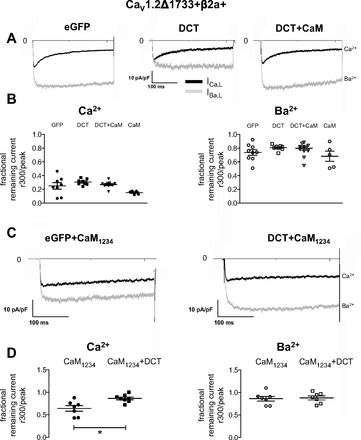
Current kinetics in HEK 293 cells. A: CaV1.2Δ1733 current traces for Vhold −80 mV stepped to 0 mV for control (left), DCT (center), and DCT + CaM (right). B: remaining fractional current 300 ms after the peak for ICa,L (left) and IBa,L (right), respectively. There are no significant differences for IBa,L voltage-dependent inactivation (VDI). C: CaV1.2Δ1733 + CaM1234 current traces for Vhold −80 mV stepped to 0 mV for control and DCT (right). D: remaining fractional current 300 ms after the peak for ICa,L (left) and IBa,L (right), respectively. *P < 0.01 for calcium-dependent inactivation (CDI).
DCT does not alter CDI.
VDI and CDI require a functional multimeric LTCC complex—a situation that can never fully be reproduced in a heterologous expression system. Therefore, we explored the effect of DCT in ventricular cardiomyocytes. Figure 5A shows representative current traces for IBa,L and ICa,L in control, DCT, and DCT + CaM-expressing cardiomyocytes. The fraction of remaining Ca2+ current 25 ms after ICa,L peak was not significantly different among control, DCT, and DCT + CaM overexpressing cardiomyocytes (Fig. 5B). IBa,L decay kinetics at 50 ms reflects VDI. DCT accelerated VDI (Fig. 5B), and this effect was reversed by coexpression of DCT and CaM. To determine the effect on steady-state inactivation, we voltage-clamped cells to a range of potentials for 2 s and assayed the available current. Steady-state inactivation curves are described by single Boltzmann distributions. For ICa,L there are no significant differences between control and DCT-expressing myocytes (Table 2). For IBa,L the midpoint of inactivation is not different, but the slope factor is significantly steeper in the presence of DCT (Table 2).
Fig. 5.
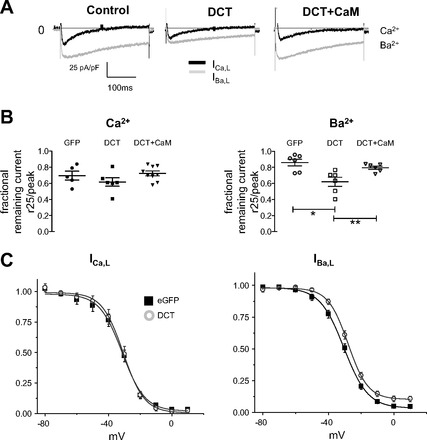
DCT enhances VDI in cardiomyocytes. A: current traces for Vhold −50 mV stepped to 0 mV for control (left), DCT (center), and DCT + CaM (right) in cardiomyocytes. B: remaining fractional current 25 and 50 ms after the peak for ICa,L (left) and IBa,L (right), respectively. There are no significant differences for ICa,L CDI. DCT overexpressing cells showed a significantly greater VDI than control or DCT + CaM. *P = 0.04 for control vs. DCT and **P = 0.01 for CaM + DCT vs. DCT. C: VDI of Ca2+ channel current in cardiomyocytes. Midpoint of activation was shifted positive for cardiomyocytes + DCT in Ba2+. Steepness of the slope increases with overexpression of DCT compared with control eGFP. Boltzmann fit parameters and sample sizes are in Table 2.
Table 2.
Steady state inactivation of cardiomyocyte barium current
| Cardiomyocytes | eGFP | DCT |
|---|---|---|
| 2.5 mM barium | ||
| n | 8 | 7 |
| V1/2 | −31 ± 1.1 | −28 ± 1.1 |
| k | 7.3 ± 0.52 | 6.1 ± 0.25∗ |
| Offset | 0.035 ± 0.01 | 0.1 ± 0.021∗∗ |
Values are means ± SE.
P = 0.03 for DCT vs. eGFP k;
P < 0.01 for DCT vs. eGFP offset.
DCT inhibits IBa,L but not ICa,L in ventricular cardiomyocytes.
Heterologous expression studies predict that cardiomyocyte L-type current will be inhibited by DCT (Fig. 1) (22). Current-voltage curves for Ca2+ currents (ICa,L) and Ba2+ currents (IBa,L) were measured using 10-mV depolarizing steps from a −50-mV prepulse to inactivate sodiume current. ICa,L and IBa,L were measured in the same cell (Fig. 6). As expected, DCT inhibited IBa,L; however, DCT did not significantly reduce ICa,L (Fig. 6Aii). Vertical scatter plots of maximal current illustrate the lack of significant difference for ICa,L between eGFP (control) and eGFP-DCT transfected cells (Fig. 6B). By contrast, IBa,L is significantly reduced by DCT expression (Fig. 6C). By extension from heterologous expression studies, we postulated that CaM coexpression with DCT can then mitigate DCT block of IBa,L. CaM overexpression alone has no significant effect on peak cardiomyocyte ICa,L or IBa,L (Fig. 6Aiii); however, exogenous-CaM-expression interfered with the DCT inhibition of IBa,L (Fig. 6, A and C), and CaM shifted reversal potential, suggesting possible effects on contaminating outward current activated at large positive potentials. Consistent with heterologous expression studies, ICa,L was not significantly different following DCT, or DCT + CaM overexpression (Fig. 6, A and B). To test whether the channel number is changed by DCT overexpression, we measured gating charge movement. There was no significant difference among control, DCT, CaM, or DCT + CaM groups (data not shown). Similarly, gating charge normalized to ionic current was unchanged (data not shown). These results are consistent with the notion that DCT has no significant effect on surface expression of CaV1.2. Taken together, common findings from heterologous expression and cardiomyocytes reveal that DCT block is strongest under conditions when Ca2+-CaM is lowest.
Fig. 6.
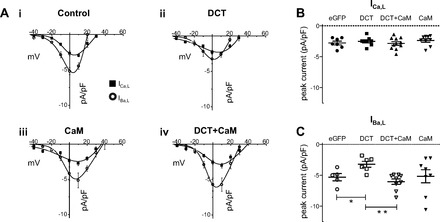
DCT decreases IBa,L but not ICa,L in ventricular cardiomyocytes. A: current voltage relationships for ICa,L (■) and IBa,L (○) for control (i), DCT overexpression (ii), CaM overexpression (iii), and DCT + CaM dual overexpression (iv). Note the difference in the relative peak IBa,L vs. ICa,L curves for DCT in contrast with all other conditions. B: peak ICa,L density for potential eliciting maximal current (+10 mV) shows no significant difference by DCT. C: peak IBa,L density for potential eliciting maximal current (0 mV) is significantly reduced by DCT, and DCT + CaM restores current amplitude. *P = 0.01 and **P = 0.01; n = 5, 6, and 9 for control, DCT, and DCT + CaM, respectively.
DCT increases the dynamic range of Ca2+ transients by lowering diastolic Ca2+.
Our results are consistent with DCT, causing a preferential inhibition of LTCC under conditions of relatively low Ca2+. Another way to view this is that DCT blocks best when the channel is relatively inactive. We define this as a RUDI. It is very difficult to directly measure LTCC blockade at low open probabilities. However, LTCC preamplifies CICR in cardiomyocytes. We surmised that during quiescence, or at low pacing frequencies, diastolic Ca2+ might be sufficiently low to create a detectable DCT block. To test this we measured cytosolic Ca2+ from fura-2 loaded cardiomyocytes. Cardiomyocytes transfected with DCT have significantly lower quiescent F340/F380 ratios during quiescence (Fig. 7A). Cells were then field paced at frequencies ranging from 0.5 to 3 Hz (Fig. 7B). In all cases a positive staircase for Ca2+ transients was observed. Normalizing the diastolic Ca2+ level in paced cells to that during quiescence reveals that DCT significantly increased the dynamic range of responses (Fig. 7C). The diastolic Ca2+ difference between 0.5 and 3 Hz is significantly greater in DCT transfected cardiomyocytes (Fig. 7D). To more rigorously test the supposition that DCT progressively unblocked as cytosolic Ca2+ increased, we measured diastolic Ca2+ varying bath Ca2+ (13). In 1.8 mM bath Ca2+ DCT significantly reduces diastolic intracellular Ca2+ concentration (Fig. 8). Raising bath Ca2+ to 6 mM resulted in no significant difference of diastolic or systolic intracellular Ca2+ concentration in DCT versus control (Fig. 8). We also superimposed data from Frampton et al. (13) for reference. Taken together, DCT reduction of quiescent Ca2+ levels and increased dynamic range of Ca2+ transients are consistent with our new hypothesis that DCT block is regulated by cytosolic Ca2+.
Fig. 7.
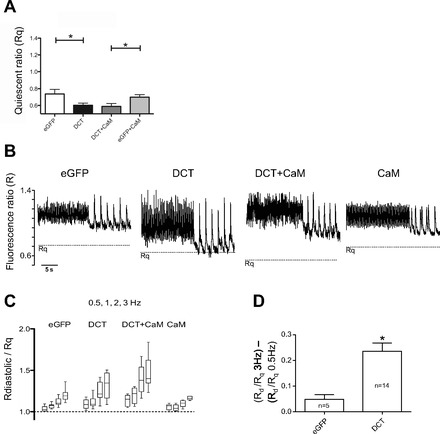
DCT reduces quiescent cytosolic Ca2+ and increases the dynamic frequency response range. A: quiescent cytosolic fura-2 fluorescent ratio (Rq) is reduced by DCT expression (*P = 0.03; n = 9 control, n = 14 DCT). B: representative Ca2+ transients for 3 and 0.5 Hz stimulation. The horizontal dashed line is the Rq from A. C: pooled mean diastolic fura-2 ratio (Rdiastolic; Rd) normalized to Rq for 0.5, 1, 2, and 3 Hz. Note the increase in dynamic response range for DCT-transfected cardiomyocytes. D: normalized Rdiastole/Rq response range manifested as difference between 3 and 0.5 Hz. DCT significantly increased response range *(P = 0.01).
Fig. 8.
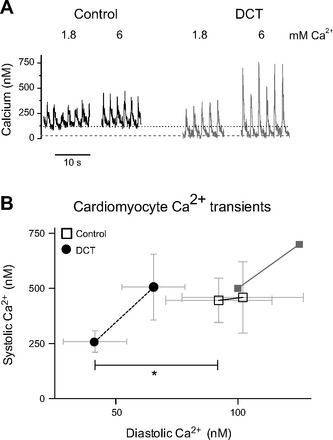
DCT decreases diastolic calcium in cardiomyocytes. A: calcium transients induced by 0.5-Hz electrical field stimulation in 1.8 and 6 mM bath Ca2+. Horizontal dashed lines shown for referencing diastolic Ca2+ level. B: relationship between diastolic and systolic calcium transients in cardiomyocytes overexpressing DCT (●, dashed line) vs. control (□, solid line) at 1.8 (symbol at left) and 6 (symbol at right) mM calcium, respectively. The light gray solid squares show data from Frampton et al. (13) for 2 and 6 mM Ca2+ for reference. *P = 0.04 for diastolic DCT vs. control (n = 12 and n = 6, respectively).
DISCUSSION
Cardiomyocytes contain DCT separate from the LTCC (31). In the present study we report novel mechanisms of action of DCT on ICa,L in cardiomyocytes. Our first major finding was that DCT inhibited cardiomyocyte IBa,L but not ICa,L. HEK 293 cells responded similarly to overexpressed DCT. DCT blockade of IBa,L was consistent with earlier studies in HEK 293 cells (22, 38); however, to our knowledge earlier studies did not consider ICa,L. Second, our data showed that DCT blockade was antagonized by Ca2+-CaM. A third major finding is that our results are consistent with the novel model that DCT blocks channels best at conditions of low Ca2+, and at potentials corresponding to low open probabilities. In essence, the data suggest that DCT is a RUDI of LTCC in cardiomyocytes. The potential physiological significance of DCT RUDI is revealed by the increase of dynamic range of Ca2+ transients as a function of stimulation frequency.
The first major finding of the present study, DCT blocks IBa,L but not ICa,L leads to the conundrum: how can IBa,L selective block be physiologically relevant? Closer examination of activation of ICa,L shows that at relatively low voltages DCT prevents detection of measurable macroscopic ICa,L (Fig. 1Aii, inset). Use-dependent inhibition can be generalized as blockade of a voltage-gated ion channel that is in a depolarization-induced open or inactivated state. Conversely, RUDI posits blockade of a channel in a relatively low Po state. RUDI is commonly associated with the rate-dependent action of sotatol (18, 20), although increases of late sodium current can underlie RUDI (39). Blockade of ICa,L, preferentially at low potentials, and low frequency-dependent attenuation of Ca2+ transients is consistent with RUDI. Thus we now speculate that DCT has a contribution as an intrinsic modulator of rate-dependent Ca2+ handling. This is an important point for follow-up studies.
DCT and RGK proteins share the common feature of interfering with ICa,L and interacting with the CaV1.2 PCT. Excess CaM interferes with RGK blockade of ICa,L manifested as alterations of peak current and slowing CDI (27). The CaM-RGK findings motivated assessment of CaM-DCT interaction with respect to LTCC function. In common with RGK modulation, CaM also interfered with DCT blockade; however, there was no effect on CDI nor on ICa,L. Our results highlight the importance of multiple proteins in the native heteromultimeric protein complex that comprises cardiomyocyte LTCC. In this light HEK 293 cells serve as reduced systems, whereby specific protein expression can be controlled simultaneously; however, consideration of missing components from native complexes must be weighed on interpretations of results. The correspondence of DCT blockade of IBa,L and the differential correspondence between HEK 293 ICa,L for CaV1.2Δ1733 but not CaVΔ1801 is not completely surprising nor easily interpreted. It is important that in all cases DCT effects are competed by excess Ca-CaM. An important limitation of data interpretation is the absence of control of stoichiometry in any given cell. In this vein the apparent increased variability of current amplitude with DCT + CaM expression (Fig. 1B) might be taken as a manifestation of lack of control of individual protein levels. Nonetheless, as first reported by Fuller et al. (15), we also report DCT blockade of IBa,L for CaV1.2Δ1801 expressed in HEK 293 cells (Fig. 2). Despite quantitative differences, the present results for DCT effects are in common with previous reports confirming an autoinhibitory function of DCT that may be propagated from DCT through the proximal carboxy terminus EF-hand to control channel gating (6).
The finding that CaM-LTCC PCT tethering is Ca2+ dependent (30) raises the idea that apparent DCT block is better conceptualized as a dynamic CaM displacement by DCT. Peptides to the CaM-interacting motif of PCT have autoagonist (11) function. Conversely, in the absence of CaM or in the presence of excess CaM1234 macroscopic LTCC conductance is decreased (29). In the present study CaM1234 and DCT had similar and nonsynergistic effects on LTCC current. We envision that for ICa,L, compared with IBa,L, sufficient Ca2+ entry is achieved to strengthen CaM-PCT interaction and thus prevents DCT from interfering with CaM-PCT function. The exception is low voltage whereby sufficiently low open channel probability limits Ca2+ entry (despite an increased driving force). This effect is subtle in patch-clamp recordings, but CICR amplifies Ca2+ signaling. Reverse-use dependence manifested as low frequency-dependent DCT attenuation of Ca2+ transients illustrates potential physiological relevance DCT modulation of LTCC activity.
The well-described Ca2+-dependent CaM-PCT interaction provides a logical framework to explain DCT effects. In this scheme, DCT is expected to be a more effective competitor for PCT than CaM at low Ca2+, and CaM-less LTCC have diminished ability to open. DCT blockade is not complete, and the remaining current has unaltered kinetics (present study), consistent with the idea that the open channels have active CaM-PCT complexes.
A developing mouse model system was adopted for studying the contribution of DCT to cardiomyocyte physiology. Specifically, our study addresses the effect of DCT on ICa,L in a native cell environment. Developing cardiomyocytes have an advantage over adult myocytes in addressing this specific aim. First, developing myocytes have relatively large ICa,L (7) (32). Second, developing cardiomyocytes can be efficiently transfected for exogenous protein expression (8) such as DCT and CaM demonstrated in this article. Finally, developing cardiomyocytes can be cultured in vitro for several days in contrast with adult cardiomyocytes, which undergo a dedifferentiation process. Although developing myocytes are not a substitute for human adult myocytes, they fit the criteria for asking questions about ICa,L current regulation by DCT. The physiological attributes of developing cardiomyocytes as a model system are also worthy of discussion. Developing cardiomyocytes have a relatively slow heart rate, compared with mature cells. Consequently the diastolic interval is relatively prolonged (12, 19). Developing cardiomyocytes have a comparatively long action potential duration (7, 36). Secondary to the reduced heart rate and prolonged action potential duration, excitation-contraction coupling is more reliant on external Ca2+ in immature compared with adult cardiomyocytes (2, 4, 37). Thus developing cardiomyocytes use a mixture of external and SR Ca2+ for excitation-contraction coupling approximating that of mature large mammalian systems.
The notion that DCT is a RUDI has potential physiological and therapeutic significance. The purpose of this study was to test the function of DCT in cardiomyocytes. As a result of our findings, we propose a new mechanism of regulation of LTCC function. Determining the degree of intrinsic RUDI that can be attributed to DCT in a cardiomyocyte will require further careful study. Ca2+-CaM antagonism of DCT RUDI requires simultaneous control of stoichiometries of CaM, LTCC, and DCT. Also, consideration of other PCT interacting proteins, such as RGKs (27), akap15, or CaVβ2, could potentially contribute to LTCC functional regulation. The significance of DCT as a RUDI extends beyond cardiomyocyte physiology. From a therapeutic perspective, overexpression of DCT is posited to have the beneficial impact of decreasing Ca2+ entry during diastole, yet sparing Ca2+ entry during systole. A key future stumbling block for application of DCT as a therapeutic is, of course, the requirement for cytosolic delivery.
In conclusion, our data identify DCT blockade of LTCC function, but only under conditions when either Ca2+ levels are low and at relatively low potentials. We show that DCT increases the stimulation frequency-dependent dynamic range of Ca2+ transients in cardiomyocytes, leading us to the new hypothesis that DCT is an intrinsic RUDI of LTCC function. A logical extension of our findings is that DCT may provide a novel therapeutic benefit by controlling Ca2+ entry at diastolic potentials while sparing Ca2+ entry for systole.
GRANTS
This work was supported by National Institutes of Health Grants HL-074091 (to J. Satin), HL-072936 (to D. A. Andres and J. Satin), and 2P20 RR-020171 from the National Center for Research Resources (to D. A. Andres) and National Heart, Lung, and Blood Institute Training Grant HL-072793 (to S. M. Crump).
DISCLOSURES
No conflicts of interest, financial or otherwise, are declared by the author(s).
AUTHOR CONTRIBUTIONS
Author contributions: S.M.C. and J.S. conception and design of research; S.M.C., D.A.A., and G.S. performed experiments; S.M.C. analyzed data; S.M.C. and J.S. interpreted results of experiments; S.M.C. prepared figures; S.M.C. and J.S. drafted manuscript; S.M.C., D.A.A., and J.S. edited and revised manuscript; S.M.C., D.A.A., and J.S. approved final version of manuscript.
REFERENCES
- 1. Balijepalli RC, Foell JD, Hall DD, Hell JW, Kamp TJ. Localization of cardiac L-type Ca2+ channels to a caveolar macromolecular signaling complex is required for beta-adrenergic regulation. Proc Natl Acad Sci USA 103: 7500–7505, 2006 [DOI] [PMC free article] [PubMed] [Google Scholar]
- 2. Bers DM. Cardiac excitation-contraction coupling. Nature 415: 198–205, 2002 [DOI] [PubMed] [Google Scholar]
- 3. Bers DM. Excitation-contraction coupling and cardiac contractile force. Boston: Kluwer Academic Publishers, 2001 [Google Scholar]
- 4. Bers DM, Stiffel VM. Ratio of ryanodine to dihydropyridine receptors in cardiac and skeletal muscle and implications for EC coupling. Am J Physiol Cell Physiol 264: C1587–C1593, 1993 [DOI] [PubMed] [Google Scholar]
- 5. Biel M, Ruth P, Bosse E, Hullin R, Stuhmer W, Flockerzi V, Hofmann F. Primary structure and functional expression of a high voltage activated calcium channel from rabbit lung. FEBS Lett 269: 409–412, 1990 [DOI] [PubMed] [Google Scholar]
- 6. Brunet S, Scheuer T, Catterall WA. Cooperative regulation of Cav1.2 channels by intracellular Mg2+, the proximal C-terminal EF-hand, and the distal C-terminal domain. J Gen Physiol 134: 81–94, 2009 [DOI] [PMC free article] [PubMed] [Google Scholar]
- 7. Cohen NM, Lederer WJ. Changes in the calcium current of rat heart ventricular myocytes during development. J Physiol 406: 115–146, 1988 [DOI] [PMC free article] [PubMed] [Google Scholar]
- 8. Crump SM, Correll RN, Schroder EA, Lester WC, Finlin BS, Andres DA, Satin J. L-type calcium channel α-subunit and protein kinase inhibitors modulate Rem-mediated regulation of current. Am J Physiol Heart Circ Physiol 291: H1959–H1971, 2006 [DOI] [PubMed] [Google Scholar]
- 9. Dai S, Hall DD, Hell JW. Supramolecular assemblies and localized regulation of voltage-gated ion channels. Physiol Rev 89: 411–452, 2009 [DOI] [PMC free article] [PubMed] [Google Scholar]
- 10. Doshi D, Marx SO. Ion channels, transporters, and pumps as targets for heart failure therapy. J Cardiovasc Pharmacol 54: 273–278, 2009 [DOI] [PMC free article] [PubMed] [Google Scholar]
- 11. Dzhura I, Wu Y, Zhang R, Colbran RJ, Hamilton SL, Anderson ME. C terminus L-type Ca2+ channel calmodulin-binding domains are ′auto-agonist′ ligands in rabbit ventricular myocytes. J Physiol 550: 731–738, 2003 [DOI] [PMC free article] [PubMed] [Google Scholar] [Retracted]
- 12. Fatkin D, Christe ME, Aristizabal O, McConnell BK, Srinivasan S, Schoen FJ, Seidman CE, Turnbull DH, Seidman JG. Neonatal cardiomyopathy in mice homozygous for the Arg403Gln mutation in the α cardiac myosin heavy chain gene. J Clin Invest 103: 147–153, 1999 [DOI] [PMC free article] [PubMed] [Google Scholar]
- 13. Frampton JE, Orchard CH, Boyett MR. Diastolic, systolic and sarcoplasmic reticulum [Ca2+] during inotropic interventions in isolated rat myocytes. J Physiol 437: 351–375, 1991 [DOI] [PMC free article] [PubMed] [Google Scholar]
- 14. Fu Y, Westenbroek RE, Yu FH, Clark JP, Marshall MR, Scheuer T, Catterall WA. Deletion of the distal C terminus of CaV1.2 channels leads to loss of β-adrenergic regulation and heart failure in vivo. J Biol Chem 286: 12617–12626, 2011 [DOI] [PMC free article] [PubMed] [Google Scholar]
- 15. Fuller MD, Emrick MA, Sadilek M, Scheuer T, Catterall WA. Molecular mechanism of calcium channel regulation in the fight-or-flight response. Sci Signal 3: ra70, 2010 [DOI] [PMC free article] [PubMed] [Google Scholar]
- 16. Gao T, Cuadra AE, Ma H, Bunemann M, Gerhardstein BL, Cheng T, Eick RT, Hosey MM. C-terminal fragments of the alpha 1C (CaV1.2) subunit associate with and regulate L-type calcium channels containing C-terminal-truncated alpha 1C subunits. J Biol Chem 276: 21089–21097, 2001 [DOI] [PubMed] [Google Scholar]
- 17. Gomez-Ospina N, Tsuruta F, Barreto-Chang O, Hu L, Dolmetsch R. The C terminus of the L-type voltage-gated calcium channel CaV1.2 encodes a transcription factor. Cell 127: 591–606, 2006 [DOI] [PMC free article] [PubMed] [Google Scholar]
- 18. Grandi E, Pasqualini FS, Bers DM. A novel computational model of the human ventricular action potential and Ca transient. J Mol Cell Cardiol 48: 112–121, 2010 [DOI] [PMC free article] [PubMed] [Google Scholar]
- 19. Green EL. Biology of the laboratory mouse. New York: Dover Publications, 1966 [Google Scholar]
- 20. Hohnloser SH, Woosley RL. Sotalol. N Engl J Med 331: 31–38, 1994 [DOI] [PubMed] [Google Scholar]
- 21. Hulme JT, Konoki K, Lin TW, Gritsenko MA, Camp DG, 2nd, Bigelow DJ, Catterall WA. Sites of proteolytic processing and noncovalent association of the distal C-terminal domain of CaV1.1 channels in skeletal muscle. Proc Natl Acad Sci USA 102: 5274–5279, 2005 [DOI] [PMC free article] [PubMed] [Google Scholar]
- 22. Hulme JT, Yarov-Yarovoy V, Lin TW, Scheuer T, Catterall WA. Autoinhibitory control of the CaV1.2 channel by its proteolytically processed distal C-terminal domain. J Physiol 576: 87–102, 2006 [DOI] [PMC free article] [PubMed] [Google Scholar]
- 23. Lester WC, Schroder EA, Burgess DE, Yozwiak D, Andres DA, Satin J. Steady-state coupling of plasma membrane calcium entry to extrusion revealed by novel L-type calcium channel block. Cell Calcium 44: 353–362, 2008 [DOI] [PMC free article] [PubMed] [Google Scholar]
- 24. Liao P, Yong TF, Liang MC, Yue DT, Soong TW. Splicing for alternative structures of Cav1.2 Ca2+ channels in cardiac and smooth muscles. Cardiovasc Res 68: 197–203, 2005 [DOI] [PubMed] [Google Scholar]
- 25. Mikami A, Imoto K, Tanabe T, Niidome T, Mori Y, Takeshima H, Narumiya S, Numa S. Primary structure and functional expression of the cardiac dihydropyridine-sensitive calcium channel. Nature 340: 230–233, 1989 [DOI] [PubMed] [Google Scholar]
- 26. Mikami A, Imoto K, Tanabe T, Niidome T, Mori Y, Takeshima H, Narumiya S, Numa S. Primary structure and functional expression of the cardiac dihydropyridine-sensitive calcium channel. Nature 340: 230–233, 1989 [DOI] [PubMed] [Google Scholar]
- 27. Pang C, Crump SM, Jin L, Correll RN, Finlin BS, Satin J, Andres DA. Rem GTPase interacts with the proximal CaV1.2 C-terminus and modulates calcium-dependent channel inactivation. Channels (Austin) 4: 192–202, 2010 [DOI] [PMC free article] [PubMed] [Google Scholar]
- 28. Perez-Reyes E, Castellano A, Kim HS, Bertrand P, Baggstrom E, Lacerda AE, Wei XY, Birnbaumer L. Cloning and expression of a cardiac/brain beta subunit of the L-type calcium channel. J Biol Chem 267: 1792–1797, 1992 [PubMed] [Google Scholar]
- 29. Peterson BZ, DeMaria CD, Adelman JP, Yue DT. Calmodulin is the Ca2+ sensor for Ca2+ -dependent inactivation of L-type calcium channels. Neuron 22: 549–558, 1999 [DOI] [PubMed] [Google Scholar]
- 30. Pitt GS, Zuhlke RD, Hudmon A, Schulman H, Reuter H, Tsien RW. Molecular basis of calmodulin tethering and Ca2+-dependent inactivation of L-type Ca2+ channels. J Biol Chem 276: 30794–30802, 2001 [DOI] [PubMed] [Google Scholar]
- 31. Schroder E, Byse M, Satin J. L-type calcium channel C terminus autoregulates transcription. Circ Res 104: 1373–1381, 2009 [DOI] [PMC free article] [PubMed] [Google Scholar]
- 32. Schroder EA, Wei Y, Satin J. The developing cardiac myocyte: maturation of excitability and excitation-contraction coupling. Ann N Y Acad Sci 1080: 63–75, 2006 [DOI] [PubMed] [Google Scholar]
- 33. Slish DF, Engle DB, Varadi G, Lotan I, Singer D, Dascal N, Schwartz A. Evidence for the existence of a cardiac specific isoform of the alpha 1 subunit of the voltage dependent calcium channel. FEBS Lett 250: 509–514, 1989 [DOI] [PubMed] [Google Scholar]
- 34. Tang ZZ, Liang MC, Lu S, Yu D, Yu CY, Yue DT, Soong TW. Transcript scanning reveals novel and extensive splice variations in human L-type voltage-gated calcium channel, Cav1.2 α1 subunit. J Biol Chem 279: 44335–44343, 2004 [DOI] [PubMed] [Google Scholar]
- 35. Van Petegem F, Chatelain FC, Minor DL., Jr Insights into voltage-gated calcium channel regulation from the structure of the CaV1.2 IQ domain-Ca2+/calmodulin complex. Nat Struct Mol Biol 12: 1108–1115, 2005 [DOI] [PMC free article] [PubMed] [Google Scholar]
- 36. Wahler GM, Dollinger SJ, Smith JM, Flemal KL. Time course of postnatal changes in rat heart action potential and in transient outward current is different. Am J Physiol Heart Circ Physiol 267: H1157–H1166, 1994 [DOI] [PubMed] [Google Scholar]
- 37. Wang LJ, Sobie EA. Mathematical model of the neonatal mouse ventricular action potential. Am J Physiol Heart Circ Physiol 294: H2565–H2575, 2008 [DOI] [PMC free article] [PubMed] [Google Scholar]
- 38. Wei X, Neely A, Lacerda AE, Olcese R, Stefani E, Perez-Reyes E, Birnbaumer L. Modification of Ca2+ channel activity by deletions at the carboxyl terminus of the cardiac alpha 1 subunit. J Biol Chem 269: 1635–1640, 1994 [PubMed] [Google Scholar]
- 39. Wu L, Ma J, Li H, Wang C, Grandi E, Zhang P, Luo A, Bers DM, Shryock JC, Belardinelli L. Late sodium current contributes to the reverse rate-dependent effect of IKr inhibition on ventricular repolarization. Circulation 123: 1713–1720, 2011 [DOI] [PMC free article] [PubMed] [Google Scholar]