

Abstract
The length-tension (L-T) relationships in airway and vascular smooth muscles have been shown to adapt with length changes over time. Our prior studies have shown that the active and passive L-T relationships in rabbit detrusor smooth muscle (DSM) can adapt and that DSM exhibits adjustable passive stiffness (APS) characterized by a passive L-T curve that is a function of strain and activation history. The present study demonstrates that passive tension due to APS can represent a substantial fraction of total tension over a broad length range. Our previous studies have shown that maximal KCl-induced contractions at short muscle lengths generate APS that is revealed by increased pseudo-steady-state passive tension at longer lengths compared with previous measurements at those lengths. The objective of the present study was to determine the mechanisms involved in APS generation. Increasing the number of KCl-induced contractions or the duration of a contraction increased the amount of APS generated. Furthermore, a fraction of APS was restored in calcium-free solution and was sensitive to the general serine and threonine protein kinase inhibitor staurosporine. Most importantly, rhythmic contraction (RC) generated APS, and because RC occurs spontaneously in human bladder, a physiological role for RC was potentially identified.
Keywords: lower urinary tract, bladder, smooth muscle mechanics, length adaptation, length-tension curve
the micturition cycle of the bladder has two phases: the filling phase in which the bladder stores urine under low pressure, and the emptying phase that occurs when there is a coordinated contraction of the detrusor smooth muscle (DSM). Human bladder contraction is initiated by an increase in parasympathetic tone with a corresponding release of acetylcholine at the neuromuscular junction, leading to increased intracellular calcium and smooth muscle contraction (1). Overactive bladder (OAB), involuntary contractions during the bladder filling phase, is a common condition affecting almost 17% of the adult population worldwide and in the U.S. ranks ahead of diabetes in a list of the 10 most common chronic disorders (29). Dysfunction during the storage/filling phase could lead to OAB symptoms, such as increased urgency and increased voiding frequency. Furthermore, dysfunction during the voiding phase could lead to symptoms such as hesitancy, weak stream, and incomplete bladder emptying.
Total tension produced by the detrusor muscle is the sum of its passive and active tensions. Until the 1990s, the passive and the active length-tension (L-T) relationships of smooth muscles were believed to be static, with a single passive tension (Tp) value and a single maximum active tension (Ta) value for each muscle length. More recent studies on vascular smooth muscle (VSM) (34, 42) and airway smooth muscle (ASM) (2, 4, 15, 19–20, 35) have challenged this assumption and demonstrated that both of these muscle types have dynamic L-T curves. In our previous studies on DSM (38–41), we showed that the L-Tp curve in DSM is dynamic and exhibits adjustable passive stiffness (APS) characterized by a passive curve that can be shifted along the length axis as a function of strain history and activation history. Furthermore, we found that 3 min of KCl or carbachol (CCh)-induced contraction at short muscle lengths permits regeneration of the passive stiffness softened by prior stretching to long muscle lengths (strain softening) and that the muscle length during the contraction is inversely proportional to the amount of APS generated (39). The present study investigates the effect of the number of contractions and length of contraction on APS regeneration and seeks to identify physiological mechanisms downstream from the contractile stimulus responsible for APS regeneration.
Urinary bladders of many mammalian species, such as rabbits (36), rats (11, 24), cats (18), guinea pigs (12), mice (6, 14, 22, 27), and humans (3), display spontaneous rhythmic contraction (SRC) during the filling phase (11, 18, 25, 36). SRC during filling displays weaker contractile amplitude than the “full” contraction responsible for voiding (8). Thus there are two distinct contractile phenomena in the bladder: SRC during the filling phase and voiding contraction during the voiding phase. Until very recently (3, 13), SRC activity has largely been ignored and its physiological function has yet to be identified.
The present study was designed to determine 1) whether APS is responsible for a significant percentage of the total tension in DSM, 2) the effect of the number and duration of KCl-induced contractions on APS formation, and 3) whether physiological phenomena of micturition and filling, specifically voiding contraction and SRC, are involved in APS formation.
METHODS
Tissue Preparation
All experiments involving animals were conducted within the appropriate animal welfare regulations and guidelines and were approved by the Virginia Commonwealth University Institutional Animal Care and Use Committee. Tissues were prepared as described previously (33, 37). In short, whole bladders were obtained from adult female New Zealand White rabbits (2–4 kg) that were preanesthetized before death through sternotomy, because the heart was used for other investigations. Bladders were washed, cleaned of adhering tissues, including fat and serosa, and stored in cold (0–4°C) modified physiological salt solution (PSS). Thin strips (∼0.2 mm thick) of longitudinal upper DSM, free of underlying urothelium and overlying serosa, were cut from the bladder wall above the trigone and close to the dome by following the natural bundling clearly demarcated when bladders were in cold buffer, as described previously (33).
Solutions
Modified PSS was composed of 140 mM NaCl, 4.7 mM KCl, 1.2 mM MgSO4, 1.6 mM CaCl2, 1.2 mM Na2HPO4, 2.0 mM morpholinopropanesulfonic acid (adjusted to pH 7.4 at either 0 or 37°C, as appropriate), 0.02 mM Na2-EDTA, and 5.6 mM dextrose. A Ca2+-free solution (0 Ca) was PSS without CaCl2. Muscle contractions were induced with PSS modified to include 110 mM KCl, substituted isosmotically for NaCl (KPSS).
Apparatus and Muscle Strip Setup
Each DSM strip was secured by small clips to a micrometer for manual length adjustments and to a force transducer (159901a; Radnoti Glass Technology, Monrovia, CA) to record isometric tension. Tension signals were digitized (PCI-6034E; National Instruments, Austin, TX) and stored electronically for analysis. Each tissue was secured such that its initial (cold) zero preload length was ∼3 mm and then equilibrated in aerated PSS at 37°C in a water-jacketed tissue bath for 45–60 min to allow it to gradually warm up and to permit development of SRC.
Tension Measurement Protocol
Isometric Tp and Ta were measured at a series of muscle lengths. For each pair of measurements, DSM strips were incubated for 2 min in 0 Ca to eliminate SRC, stretched or released to the muscle length of interest if necessary, and incubated for an additional 2 min in 0 Ca followed by 3 min in PSS and then 1 min in KPSS to induce a maximal contraction (Fig. 1A). We previously showed that incubation in PSS before a KCl-induced contraction increases Ta compared with incubation in 0 Ca (38). To account for the potential for tension development while tissues were incubated in PSS, Tp was taken as the lowest value in either PSS or 0 Ca, as previously described (38). Ta was calculated by subtracting Tp from the peak total KCl-induced tension (Tt).
Fig. 1.

A: sample data illustrating the tension measurement protocol. Detrusor smooth muscle (DSM) strips were incubated for 2 min in Ca2+-free solution (0 Ca); stretched or released to the muscle length of interest, if necessary; incubated for an additional 2 min in 0 Ca; incubated in modified physiological salt solution (PSS) for 3 min; and then incubated in PSS modified to include KCl rather than NaCl (KPSS) for 1 min to induce a contraction. T, tension; Tpeak, peak tension. B: reference length (Lref) identification protocol. Passive tension (Tp) and active tension (Ta) were measured at each length in a sequence of 3-mm steps from 3 mm to 12, 15, or 18 mm until a peak in the L-Ta curve was identified, and the corresponding length was designated as Lref. C: sample data from 3 tissues with Lref at 9 (●), 12 (▴), and 15 mm (■), respectively. Ta_max, maximum active tension.
Reference Length Determination Protocol
The APS regeneration protocols performed in this study were based on a reference length (Lref) for each tissue. To determine Lref, we made tension measurements at 3-mm increments (Fig. 1B) until a peak value on the L-Ta curve was identified, and this length was designated as Lref. Because of tissue variability and measurements being made in 3-mm increments, Lref was 9, 12, or 15 mm (Fig. 1C).
Passive L-T Curve Protocol
The L-T curve protocol illustrated in Fig. 2A was designed to confirm that a shift in the L-Tp curve due to APS produces a shift in the L-Tt curve. Tissues first underwent two maximal KCl-induced contractions at the 3-mm length, “wake up,” to ensure tissue viability. Tissues were then preconditioned seven times in 0 Ca to the maximum length in the protocol, 15 mm (Fig. 2A, open bar), because we have previously shown that peak Tp decreases with each stretch until it reaches equilibrium in six to seven stretches (39). The maximum length in the protocol, 15 mm, was chosen because it is five times the initial length of 3 mm and incorporates much of the sevenfold length range over which DSM can function (43). After the seven preconditioning stretches to 15 mm, L-T measurements were made at increasing lengths from 3.75 to 15 mm (Fig. 2A, “loading” protocol) and then at decreasing lengths from 15 to 3.75 mm (“unloading” protocol). We expected to see greater Tp during the loading compared with the unloading protocol because we previously showed that contractions at shorter muscle lengths establish APS (in this case, the contraction at 3.75 mm) (39), and we expected to see less Tp during the unloading protocol because of a reduction in APS due to the preceding stretch (strain softening) to the longer length (15 mm). Furthermore, based on our previous study of the effect of APS on Ta at a single muscle length, we expected the L-Tt curve to be modulated by L-Tp with little change in the L-Ta curve (40).
Fig. 2.
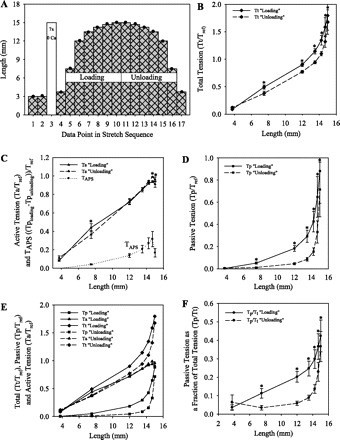
A: L-T curve protocol for preconditioned tissues. After 7 preconditioning stretches to 15 mm, L-T measurements were made at increasing lengths from 3.75 to 15 mm (“loading” protocol) and then at decreasing lengths (“unloading” protocol). Solid circles indicate KCl-induced contractions. B–E: tension values (means ± SE) were normalized to the maximum Ta value for each tissue (Tref) in L-Tt curves (B), L-Ta curves and Tp due to adjustable passive stiffness (APS), or TAPS curves (C), L-Tp curves (D), and L-T curves from B–D shown together (E). F: Tp as a fraction of Tt (Tp/Tt). *P < 0.05 indicates that the loading and unloading values are significantly different from each other (paired t-test, n = 7).
APS Regeneration Protocols
Effect of number or duration of KCl-induced contractions on APS.
The protocol in Fig. 3A was designed to test the hypothesis that APS regeneration, which we have previously shown involves contractions at short muscle lengths (39–41), depends on the number of contractions and on the duration of each contraction. After the determination of Lref (Fig. 1B), six pairs of Tp measurements were made at Lref (Fig. 3A, points 3 and 6, 8 and 12, 14 and 16, 18 and 20, 22 and 24, and 26 and 29) while in 0 Ca. Before each pair of Tp measurements were made, tissues were strain-softened seven times in 0 Ca to reduce Tp due to APS at shorter muscle lengths by stretching to 133% Lref and then releasing until they were approximately slack (Fig. 3A, points 2, 7, 13, 17, 21 and 25). After strain softening and release to Lref, the first pseudo-steady-state Tp measurement was made after 1 min of isometric tension redevelopment. Between the first and second Tp measurements in each set, tissues were released to 50% Lref and subjected to two, three, or one contraction (Fig. 3A, points 4 and 5, 9–11, 15, 19, and 27 and 28) to potentially restore APS lost as a result of the immediately preceding strain softening. We chose 50% Lref because tissues were typically slack at that length following strain softening, and we previously found that DSM strips redevelop greater APS following contractions at slack length compared with longer lengths (39). The timing of most contraction cycles was identical to the tension measurement cycle in Fig. 1A, which consisted of 4 min in 0 Ca, then 3 min in PSS, and finally 1 min in KPSS to induce each contraction. The exceptions were a longer, 24-min contraction after 2 min in 0 Ca (Fig. 3A, point 19; Fig. 3C, sample data) and incubation in 0 Ca for 4 min without a contraction (Fig. 3A, point 23). After the contraction(s) or incubation in 0 Ca, tissues were stretched to Lref in 0 Ca, and the second pseudo-steady-state Tp measurement was made after 10 min of isometric stress relaxation. The second measurement was made after 10 min at Lref, compared with 1 min for the first measurement, because the tissues took longer to stress relax than to redevelop to a pseudo-steady-state Tp value (Fig. 3D). The difference between the relaxed and redeveloped Tp values at Lref represented the amount of APS restored by the contraction(s) at 50% Lref (Fig. 3D). On the basis of our experience with APS (39–41), we expected to find that the amount of APS generated increased with the number of contractions and with the duration of contraction.
Fig. 3.

A: protocol to determine the effect of the number of contractions and the duration of a contraction on APS reformation. After the determination of Lref (Fig. 1B), 6 pairs of Tp measurements were made at Lref (shaded bars) while in 0 Ca. Before each pair of Tp measurements were made, tissues were strain-softened 7 times in 0 Ca by stretching to 133% Lref and then releasing until they were approximately slack (open bars). Tp was then measured after 1 min of isometric tension redevelopment at Lref (points 3, 8, 14, 18, 22, and 26), one or more contractions were performed at 50% Lref (hatched bars), and then Tp was measured after 10 min of stress relaxation at Lref (points 6, 12, 16, 20, 24, and 29). Between each pair of Tp measurements, 2 contractions, 3 contractions, 1 contraction, a long 24-min contraction, a 4-min incubation in 0 Ca with no contraction, or 2 contractions, respectively, were performed (points 4 and 5, 9–11, 15, 19, 23, and 27 and 28, respectively). Solid circles on the hatched bars indicate a contraction during that tension measurement cycle. B: Tp increase at Lref due to each set of contractions normalized to the increase due to 2 contractions [e.g., (Tp for point 6 minus Tp for point 3)/(Tp for point 6 minus Tp for point 3)]. Values are means ± SE (n = 4). *P < 0.05 indicates a significant difference compared with 1.0. ΩP < 0.025 indicates that incubation in 0 Ca without contraction produced a significantly smaller increase in Tp compared with one contraction. Cont, contractions. C: data from 1 experiment showing a 24-min KCl-induced contraction and washout (w) of the KPSS by 0 Ca. Tmax, maximum tension. D: 1-min Tp redevelopment for points 3 and 22 (inset) and 10-min Tp relaxation for point 6 following 2 contractions and for point 24 following incubation in 0 Ca (mean values, solid and shaded lines, respectively, n = 4). Two-phase exponential curves were fit to the redevelopment data (dotted lines) and relaxation data (dashed lines), extrapolated to 20 min (R2 ≥ 0.993 for all fits).
Effects of muscle length during contraction and 1 μM staurosporine on APS.
The protocol in Fig. 4A was designed to confirm that the amount of APS restored following isometric contractions is dependent on the muscle length during the contractions, as we previously showed (39), and to determine whether Tp due to APS at Lref could be increased by KCl-induced contractions at that length and whether any increase was due to a regulated process involving protein phosphorylation. After the determination of the Lref (Fig. 1B) and strain softening to 133% Lref, Tp was measured at 100% Lref before and after two KCl-induced contractions at 50% Lref (Fig. 4A, points 3–6) as in the previous protocol (Fig. 3A) and again before and after two KCl-induced contractions at 100% Lref (Fig. 4A, points 8–11). In the presence of 1 μM staurosporine, an agent known to nonselectively inhibit many of the protein kinases responsible for increasing the degree of myosin light chain phosphorylation, tissues were then incubated for 10 min in 0 Ca at 100% Lref and strain-softened to 133% Lref, and Tp was measured before and after two KCl-induced contractions at 100% Lref (Fig. 4A, points 12–16). We expected to find less APS generated by contractions at 100% Lref compared with contractions at 50% Lref and that both contractions and generation of APS were inhibited by staurosporine.
Fig. 4.

A: protocol to determine whether Tp at Lref due to APS could be increased by KCl-induced contractions at that length and whether any increase was inhibited by 1 μM staurosporine. After the determination of Lref (Fig. 1B), 3 pairs of Tp measurements were made while tissues remained in 0 Ca (shaded bars) as in the previous protocol (Fig. 3A). The first pair (points 3 and 6) measured the amount of Tp restored by two 1-min KCl-induced contractions at 50% Lref (points 4 and 5) following 7 strain-softening stretches to 133% Lref (point 2). The second (points 8 and 11) and third pairs (points 13 and 16) measured the amount of Tp restored by two 1-min KCl-induced contractions at 100% Lref (points 9 and 10 and points 14 and 15), also following 7 strain-softening stretches to 133% Lref (points 7 and 12, respectively), with the final pair of contractions inhibited by 1 μM staurosporine. B: increase in Tp at Lref due to 2 contractions at 50% Lref, 2 contractions at 100% Lref, and 2 contractions at 100% Lref inhibited by 1 μM staurosporine. Data were normalized to the increase due to the 2 contractions at 50% Lref. Values are means ± SE (n = 5). *P < 0.05 indicates a significant difference compared with 1.0. ΩP < 0.05 indicates that the increase in Tp was significantly less following 2 contractions at 100% Lref with staurosporine compared with those without staurosporine.
Effect of “voiding-like” contraction ± induced rhythmic contraction on APS.
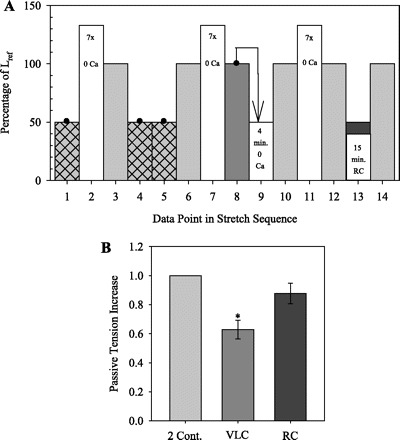
The protocol in Fig. 5A was designed to determine whether a “voiding-like” contraction (VLC) followed by 15 min of induced rhythmic contraction (RC), or a VLC followed by 15 min of incubation in PSS without RC (i.e., a VLC alone), causes regeneration of APS. After the determination of Lref (Fig. 1B) in three DSM strips from the same rabbit, tissues were strain-softened seven times to 133% Lref and Tp was measured at Lref before and after two contractions at 50% Lref, as in the previous protocols (Fig. 3A). Next, tissues were strain-softened to 133% Lref and released to Lref, where Tp was measured after 1 min of isometric tension redevelopment (Fig. 5A, points 7 and 8). Tissues were then subjected to a VLC in which they where contracted with KPSS at Lref until Tt reached its maximum value and then manually released (∼20–30 s) to 50% Lref while remaining in KPSS to mimic a voiding contraction (Fig. 5A, point 8). After the VLC, each of the three strips was first incubated in PSS+SC-560 (10−9–3 × 10⁻⁷ M), a cyclooxygenase-1 (COX-1) inhibitor, to abolish or prevent any natural SRC (Fig. 5A, point 9) (8). Prostaglandin E2 (PGE2; 10−9–3 × 10⁻⁷ M) was then added to PSS in one tissue bath (8) and CCh (0.1 or 0.3 μM) was added to PSS in another bath (26) until RC was established in both tissues. Each agonist or antagonist was added in half-log increments beginning at 10−9 M and ending with, at most, 3 × 10⁻⁷ M, until RC was either established by PGE2 or CCh or abolished by SC-560. Tp was then measured after 10 min of stress relaxation at Lref to determine the effect of the VLC plus the 15 min with or without RC on the restoration of APS (Fig. 5A, point 10). Finally, tissues were strain-softened again to 133% Lref, and Tp was measured at Lref before and after two contractions at 50% Lref. On the basis of our previous work (39–41) showing APS is restored by contractions at a short muscle length, we expected to find that either a VLC alone or a VLC followed by RC would also restore APS, thus identifying a potential physiological mechanism for generating APS.
Fig. 5.

A: protocol to determine whether a “voiding-like” contraction (VLC) followed by 15 min of rhythmic contraction (RC) causes regeneration of APS. After the determination of Lref (Fig. 1B), 3 pairs of Tp measurements were made at Lref (shaded bars) while in 0 Ca, as in the previous protocols (Fig. 3A). The first and third pairs measured the amount of Tp restored by two 1-min KCl-induced contractions at 50% Lref (points 4 and 5 and points 13 and 14) following 7 strain-softening stretches to 133% Lref (open bars). The second pair of Tp measurements (points 8 and 10) measured the amount of Tp restored by a VLC (point 8, arrow) plus 15 min in PSS with or without induced RC at 50% Lref (point 9). B: Tp increase at Lref due to the following: 2 contractions, 1 VLC plus 15 min RC induced with PGE2 (SC-560+PGE2), 1 VLC plus 15 min RC induced with carbachol (SC-560+CCh), and 1 VLC plus 15 min in PSS with RC abolished by SC-560 (SC-560). Data were normalized to the increase due to 2 contractions. Values are means ± SE (n = 3 or 4). *P < 0.05 indicates a significant difference compared with 1.0. C: selected data from 1 experiment showing induced RC due to either PGE2 or CCh and the absence of RC due to SC-560. Data are normalized to peak Ta of the first contraction (Ta_1).
Effect of VLC or 15 min RC on APS.
The protocol in Fig. 6A was designed to determine whether the APS restored following a VLC plus RC in the previous protocol (Fig. 5A) was restored as a result of the VLC or the RC, i.e., whether APS was restored during voiding or filling, or both. After the determination of the Lref (Fig. 1B), tissues were strain softened seven times to 133% Lref, and Tp was measured at Lref before and after two contractions at 50% Lref, as in the previous protocols (Fig. 3A). Next, tissues were strain softened to 133% Lref, released to Lref, where Tp was measured after 1 min of isometric tension redevelopment (Fig. 6A, points 7 and 8). Tissues were next subjected to a VLC to 50% Lref, incubated for 4 min in 0 Ca at that length, and then returned to Lref, where Tp was measured as before (Fig. 6A, points 8–10). Next, tissues were again strain-softened to 133% Lref and then released to 100% Lref, where Tp was measured as before and released without contraction to 50% Lref, where RC was established with PGE2 as before. After 15 min of rhythm, tissues were returned to Lref in 0 Ca, where Tp was measured as before. On the basis of results from the protocol in Fig. 5A, we expected to find that the VLC did not restore more APS than incubation in 0 Ca but that RC alone did restore more APS than incubation in 0 Ca or a VLC.
Fig. 6.
A: protocol to determine whether a VLC or 15 min of RC causes regeneration of APS. After the determination of Lref (Fig. 1B), 3 pairs of Tp measurements were made at Lref (shaded bars) while in 0 Ca, as in the previous protocols (Figs. 3A and 5A). The first pair measured the amount of Tp restored by two 1-min KCl-induced contractions at 50% Lref (points 4 and 5) following 7 strain-softening stretches to 133% Lref (open bars). The second pair of Tp measurements (points 8 and 10) measured the amount of Tp restored by a VLC (point 8, arrow), and the third pair measured the amount of Tp restored by 15 min of PGE2-induced RC at 50% Lref (point 13). B: Tp increase at Lref due to 2 contractions, VLC, or 15-min RC induced with PGE2. Data were normalized to the increase due to 2 contractions. Values are means ± SE (n = 4). *P < 0.05 indicates a significant difference compared with 1.0.
Effects of 1 μM staurosporine and distilled water on APS.
The protocol in Fig. 7A was designed to determine whether the APS restored following incubation in 0 Ca in the protocol in Fig. 3 was restored due to an active, regulated process involving protein phosphorylation. Tp was measured at Lref before and after 15 min of incubation in 0 Ca at 50% Lref and again after 15 min of incubation in 1 μM staurosporine to inhibit myosin light chain phosphorylation.
Fig. 7.
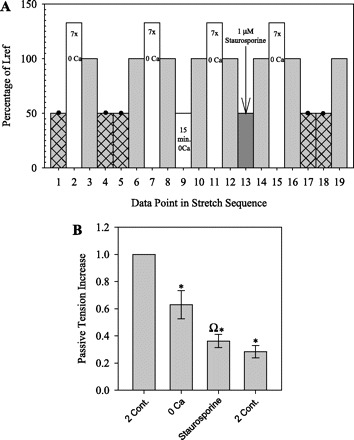
A: protocol to determine whether APS restored following incubation in 0 Ca is inhibited by 1 μM staurosporine. After the determination of Lref (Fig. 1B), 4 pairs of Tp measurements were made at Lref (shaded bars) while in 0 Ca, as in the previous protocols (Figs. 3A and 5A). The first and fourth pairs measured the amount of Tp restored by two 1-min KCl-induced contractions at 50% Lref (points 4 and 5 and points 17 and 18) following 7 strain-softening stretches to 133% Lref (open bars). The second pair of Tp measurements (points 8 and 10) measured the amount of Tp restored by 15 min in 0 Ca at 50% Lref (point 9), and the third pair of Tp measurements (points 12 and 14) measured the amount of Tp restored by 15 min in 0 Ca plus 1 μM staurosporine at 50% Lref (point 13, arrow). B: Tp increase at Lref due to the following: 2 contractions, 15 min in 0 Ca, or 15 min in 0 Ca plus 1 μM staurosporine. Data were normalized to the increase due to 2 contractions. Values are means ± SE (n = 4). *P < 0.05 indicates a significant difference compared with 1.0. ΩP < 0.025 indicates that the increase in Tp was significantly less following incubation in 0 Ca with staurosporine compared with that without staurosporine.
In another experiment added to the end of the protocol in Fig. 5A, Tp was measured at Lref after strain softening to 133% Lref and again after 40 min of incubation in distilled water at 50% Lref to kill the tissues. After the first 20 min of this incubation, tissues were exposed to KPSS for 1 min to determine whether they could contract. We expected to find that if the fraction of Tp restored during incubation in 0 Ca was due to passive viscoelasticity, then restoration of Tp would not be inhibited by staurosporine and might be exhibited by nonviable tissues.
Statistics and Curve Fitting
When two groups were compared, a t-test was used to determine significant differences, and when more than two groups were compared, a one-way ANOVA with the post hoc Student-Newman-Keuls test was used where appropriate. The null hypothesis was rejected at P < 0.05. The sample size (n) refers to the number of animals and not the number of tissues. Analyses and curve fitting were performed using Excel 2003 (Microsoft, Redmond, WA) or Prism 5.0 (GraphPad Software, La Jolla, CA).
RESULTS
Shifting of the L-Tp and L-Tt Curves Due to APS
DSM strips subjected to the protocol shown in Fig. 2A (see Passive L-T Curve Protocol) produced the L-T curves shown in Fig. 2, B–F. Preconditioning was performed to remove any “kinks” in the tissue (16), to establish any permanent damage that will occur due to stretching, especially local damage at the clamps, and, most importantly, to remove the amount of passive tension due to APS that will be lost due to strain softening the tissue to the maximum length in the protocol (39–41). Tp for the unloading protocol was significantly less than that for the loading protocol at lengths >3.75 mm (Fig. 2D). On the basis of our previous studies, we attribute the additional Tp identified by the loading protocol to APS established by the contractions at the shorter lengths, especially 3.75 mm, and then lost following the stretch to 15 mm (39–41). Tt was also significantly less for the unloading protocol compared with the loading protocol at lengths >3.75 mm (Fig. 2B). In contrast, Ta values for both protocols were not different between 12 and 14.25 mm, and Ta for the unloading protocol was greater than that for the loading protocol at both 14.7 and 15 mm (Fig. 2C). Thus the downward shift in the L-Tt curve for the unloading protocol compared with the loading protocol was primarily due to the shift in the L-Tp curve at lengths >7.5 mm, and the L-Ta and L-Tp curves shifted in opposite directions (loading vs. unloading) at 14.7 and 15 mm.
The L-Ta curves for the loading and unloading protocols both had ascending and descending limbs with a peak at 14.7 mm (Fig. 2C). Furthermore, the TAPS curve, calculated as the difference in the loading and unloading Tp curves attributed to APS, also had ascending and descending limbs with a peak value at 14.7 mm (Fig. 2C). TAPS was a substantial 27.0 ± 8.4% of active tension at this length. For the loading protocol, passive tension was >10% of total tension at lengths of 7.5 mm and above (Fig. 2F). For the unloading protocol, passive tension was a smaller fraction of total tension, contributing <10% at lengths of 13.25 mm and less. At 14.7 mm, where peak Ta was identified, Tp was a sizeable 32.7 ± 7.4% of Tt on the loading curve and 20.5 ± 5.4% of Tt on the unloading curve (Fig. 2F).
Effect of Number or Duration of KCl-Induced Contractions on APS Regeneration
DSM strips subjected to the protocol in Fig. 3A showed an increase in Tp of 0.33 ± 0.09 g at Lref (Tp for point 6 minus Tp for point 3, mean ± SE) following two 1-min contractions at 50% Lref, which represented 28.4 ± 8.7% of Ta produced by the first contraction. These curves were extrapolated to 20 min, and the predicted Tp increase of 0.35 g following two contractions (Tp for point 6 minus Tp for point 3) corresponded well with the 0.33 ± 0.09 g calculated using the 1-min redeveloped and 10-min relaxed Tp values. The normalized increases in Tp following three 1-min contractions and one long 24-min contraction (see Fig. 3C) at 50% Lref were not different from the increase due to two contractions (Fig. 3B), although the average normalized increases (1.05 ± 0.07 and 1.23 ± 0.15, respectively) were greater (Fig. 3B). The increase in Tp following a single 1-min contraction was significantly less than the increase due to two contractions (Fig. 3B, 0.72 ± 0.04) and significantly greater than that after incubation in 0 Ca with no contraction (Fig. 3B, 0.55 ± 0.05). Finally, two subsequent contractions produced an increase in Tp (0.94 ± 0.12) that was not different from the increase produced by the original pair of contractions (Fig. 3B). Together, these results show that the amount of APS restored is dependent on both the number of contractions and on the duration of contraction, with two or three short 1-min contractions or one long 24-min contraction at the shorter length restoring the most APS.
To verify that the timing of the Tp measurements was appropriate, we fit two-phase exponential curves to the average 1-min Tp redevelopment data for measurement points 3 and 22 (Fig. 3D, solid and shaded lines, respectively, fitted lines are broken) and for the average 10-min Tp relaxation data for points 6 and 24. These curves were extrapolated to 20 min, and the predicted Tp increase of 0.35 g following two contractions (point 6 minus point 3) corresponded well with the 0.33 ± 0.09 g calculated using the 1-min redeveloped and 10-min relaxed Tp values. Likewise, the predicted steady-state increase of 0.18 g following incubation in 0 Ca at 50% Lref corresponded well with the 0.17 ± 0.03 g calculated using the 1-min redeveloped and 10-min relaxed Tp values. This timing for Tp measurements was used in the other protocols in this study.
Effects of Muscle Length During Contraction and 1 μM Staurosporine on APS Regeneration
DSM strips subjected to the protocol in Fig. 4A showed an increase in Tp at 100% Lref following two contractions at 50% Lref (Fig. 4B) as in the preceding protocol. The normalized increase in Tp of 0.39 ± 0.14 following two contractions at 100% Lref was significantly less than the increase due to the control contractions at 50% Lref (Fig. 4B; P < 0.05, n = 5). These results confirm that generation of APS is dependent on muscle length (39) and indicate that APS can be generated at a particular muscle length by contractions at that length.
KCl-induced contractions in the presence of 1 μM staurosporine were reduced by ∼84%, and the normalized increase in Tp of 0.07 ± 0.03 following these contractions was significantly less than that without the drug (Fig. 4B, P < 0.05, n = 5). Thus most of the APS generation upon contraction at 100% Lref was inhibited by staurosporine, providing additional evidence that APS generation is an active process involving serine or threonine kinases.
Effect of VLC-Induced RC on APS Regeneration
DSM strips subjected to the protocol in Fig. 5A showed an increase in Tp at Lref following two 1-min contractions at 50% Lref (Fig. 5B) as in the previous protocol. The normalized increases in Tp following a VLC plus 15 min of PGE2- or CCh-induced RC (0.86 ± 0.11 and 0.81 ± 0.07, respectively, n = 4) were not significantly different from the increase due to the two control contractions (Fig. 5, B and C). In contrast, the increase in Tp of 0.54 ± 0.07 (n = 3) following a VLC plus 15 min in PSS without induced RC and with natural RC inhibited with SC-560 (Fig. 5, B and C) was reduced compared with the increase due to the two control contractions. In all tissues, two subsequent contractions produced increases in Tp that were not different from the increases produced by the original pair of contractions (Fig. 5B). Finally, in an additional experiment, one VLC plus 90 min of PGE2-induced RC restored 0.86 ± 0.10 Tp, which was not statistically different from two control contractions (P < 0.05, n = 5) and was the same average amount restored by one VLC plus 15 min of PGE2-induced RC (i.e., both 15 and 90 min of RC restored 0.86 Tp).
Effect of VLC or 15-min RC on APS Regeneration
DSM strips subjected to the protocol in Fig. 6A showed an increase in Tp at Lref following two 1-min contractions at 50% Lref (Fig. 6B) as in the previous two protocols. The normalized increase in Tp of 0.63 ± 0.06 following a VLC was less than the increase due to the control contractions (Fig. 6B), whereas the increase in Tp of 0.88 ± 0.07 due to 15 min of PGE2-induced RC without a VLC was not significantly different from the increase due to the two control contractions (Fig. 6B, P < 0.05, n = 4). Thus a VLC alone appears to restore less APS than RC alone.
Effects of 1 μM Staurosporine and Distilled Water on APS Regeneration
DSM strips subjected to the protocol in Fig. 7A showed a normalized increase of 0.63 ± 0.10 in Tp at Lref after 15 min of incubation in 0 Ca at 50% Lref and a 43% significantly smaller increase of 0.36 ± 0.05 in Tp after 15 min of incubation in 1 μM staurosporine (Fig. 7B). These results indicate that the Tp restored at Lref by 15 min in 0 Ca at 50% Lref was actively restored by a staurosporine-sensitive regulation system and not by passive viscoelastic effects.
Tissues incubated in distilled water for 20 min did not contract when exposed to KPSS, and after an additional 20 min in distilled water at 50% Lref, tissues showed no increase or decrease in Tp (0.00 ± 0.02, n = 4) at Lref. This finding indicates that the increase in Tp following incubation in 0 Ca plus 1 μM staurosporine was likely due to an intracellular mechanism that was abolished by distilled water.
DISCUSSION
Generation of APS in DSM
Adjustable passive stiffness in detrusor is reduced upon stretch to and then release from longer muscle lengths (39) and was responsible for a substantial fraction of Tp and Tt at longer muscle lengths (Fig. 2F) under the experimental conditions of this study. What remains to be determined is how much APS contributes to wall tension during bladder filling. Figure 8 summarizes the increases in pseudo-steady-state Tp measured at Lref following one or more muscle activations and/or drug treatments at 50% Lref. A single, maximal, 24-min KCl-induced contraction at 50% Lref or two or three 1-min KCl-induced contractions at 50% Lref led to the greatest increases in Tp at Lref (Figs. 3 and 8). Although these stimulations did not mimic the physiological behavior of the bladder, they revealed that the duration and/or number of stimulations influenced the increase in Tp and motivated our investigation of the effect of two physiological phenomena, voiding contraction and RC, on the restoration of APS.
Fig. 8.

Summary of the normalized increases in Tp at Lref following selected stimuli at 50% Lref for the protocols used in this study. Values are normalized to the increase in Tp following 2 maximal 1-min KCl-induced contractions. *P < 0.05 indicates a significant difference compared with 1.0.
SRC in rabbit DSM produces ∼5–12% of peak Ta (33), and because SRC occurs in human bladders (18), the most important finding of the present study may be that at least 15 min of RC induced with PGE2 or CCh permitted the regeneration of APS lost to strain softening and led to increases in Tp that were not different from increases produced by two maximal KCl contractions (Figs. 6 and 8). In contrast, a single maximal KCl-induced contraction or a VLC without subsequent RC yielded smaller increases in Tp (Figs. 3, 5, and 8). Together, these findings suggest that the duration of contraction may influence the restoration of APS to a greater degree than the magnitude of the contraction.
Ta produced by a long, 24-min contraction had two phases, a fast (phasic) phase that lasted ∼1 min and a long tonic phase with weaker amplitude that lasted ∼23 min (Fig. 3C). This tonic phase permitted a single long KCl-induced contraction to generate significantly more APS than a short contraction with little or no tonic phase (Figs. 3 and 8). Similarly, a VLC without subsequent RC restored less APS than RC alone (Figs. 6 and 8). Furthermore, a VLC without subsequent RC did not lead to a greater restoration of APS than incubation in 0 Ca (Figs. 5, 6, and 8), indicating that the VLC did not contribute to the restoration of APS. Thus a clear trend identified in Fig. 8 was that single, maximal, short phasic contractions restored less APS than tonic contractions and restored no more APS than incubation in 0 Ca (Fig. 8). Together, these data are consistent with a bladder model that includes either a single cross-bridge system that can be regulated to generate both Ta and APS or two contractile systems, one responsible for voiding, which produces the phasic portion of a sustained isometric contraction, and one responsible for RC and generation of APS, which produces the tonic portion of a sustained isometric contraction (Fig. 3C). Both models are consistent with Gillespie's conclusion that micturation and nonmicturation activity in the bladder are controlled by distinct systems (18).
A passive structural component, such as a cross-link, formed at a particular muscle length will likely not contribute to Tp until the muscle is stretched beyond that length. Therefore, we speculate that the increase in Tp at 100% Lref following isometric contractions at that length (Fig. 4) was due to an increase in tension in a series elastic component (41) that was internally stretched by cross bridges during the isometric contraction. Despite complete muscle inactivation and relaxation in 0 Ca, a particular cross bridge population then remained attached, preventing the series elastic component from returning to its original length, thus increasing Tp at that muscle length.
The data in Fig. 8 indicate that approximately one-half of the APS restored by two maximal KCl-induced contractions was also restored in a nominally Ca2+-free environment. However, the general serine and threonine kinase inhibitor staurosporine or prolonged exposure to the COX-1 inhibitor SC-560 inhibited the restoration of APS in 0 Ca by approximately one-half (Fig. 8), which indicates that APS generation may be regulated in part by a calcium-independent staurosporine-sensitive pathway. A Ca2+-free solution abolishes basal (spontaneous) RC and completely prevents KCl and bethanechol from causing contraction (23, 33). However, a Ca2+-free solution reduces but does not abolish basal myosin light chain (MLC) phosphorylation when tissues are stretched beyond their slack length. More importantly, a Ca2+-free solution does not reduce the high basal MLC phosphorylation level (∼20%) when tissues are at slack length (33). Moreover, release from a longer muscle length to the slack length actually increases the level of basal MLC phosphorylation (33). These data together are consistent with a model suggesting that restoration of APS when DSM was released to slack length (i.e., 50% Lref) in a Ca2+-free solution was due to an increase in MLC phosphorylation, resulting in activation of slowly detaching cross bridges. One cross-bridge model predicts that a decrease in the number of slowly cycling latch bridges, unphosphorylated myosin attached to actin (10, 21), may dominate stiffness changes in smooth muscle subjected to slow length fluctuations (28). Alternatively, APS could be due to catch-like links between thick and thin filaments instead of cross bridges (17), which may be regulated by myosin (7). The fraction of APS that was abolished only by distilled water could be due purely to mechanical alterations in nonlinear viscoelastic structures, rather than to biochemically regulated mechanisms. Alternatively, fluid redistribution alone involving passive or active processes could have produced greater pseudo-steady state Tp at Lref when tissues were released to that length compared with when they were stretched to that length.
Physiological Significance of APS and RC
Other studies suggest that rhythmic activity may relay bladder wall tension and volume information to the central nervous system (18, 27) and that PGE2 may be involved in maintaining bladder tone during distension (30). Our data show that RC can regenerate APS in rabbit detrusor, and because RC occurs in all mammalian bladders studied thus far, including human bladders (3), we have potentially identified a physiological role of RC in bladder. Moreover, because elevated levels of RC have been shown in patients with OAB disorder (5), a defect in the generation of APS may be associated with this disorder. The likely roles of APS in bladder function are 1) to maintain bladder shape while allowing the bladder to accommodate urine at relatively low pressures and 2) to maintain efficient spacing between actin and myosin filaments to enable efficient active tension generation for voiding throughout the broad range of muscle lengths over which detrusor operates. Passive stiffness is important during bladder filling because localized stretching of the bladder wall affects the signaling system that leads to urgency (9). Insufficient stiffness could allow increased deformation of the bladder and therefore increased bladder wall strain during changes in abdominal loading, which could lead to premature urgency. Elevated stiffness could lead to increased pressure and bladder wall stress, which could also lead to premature urgency. Thus any dysfunction in passive tension during the filling phase could contribute to OAB. Additional studies are necessary to determine whether the elevated levels of RC in patients with OAB may contribute to any dysfunction involving bladder wall stiffness or may be an attempt to compensate for a dysfunction involving bladder wall stiffness.
GRANTS
This study was supported by a grant from the Edwin Beer Research Program in Urology and Urology Related Fields from the New York Academy of Medicine (to J. E. Speich). Some bladders used for these studies were from rabbits used for vascular smooth muscle studies supported by National Heart, Lung, and Blood Institute Grant R01-HL61320 (to P. H. Ratz).
ACKNOWLEDGMENTS
We gratefully acknowledge the expert technical assistance of Amy S. Miner and the guidance and support of Dr. Harry P. Koo.
REFERENCES
- 1. Anderson KE, Arner A. Urinary bladder contraction and relaxation: physiology and pathophysiology. Physiol Rev 84: 935–986, 2004 [DOI] [PubMed] [Google Scholar]
- 2. Bai TR, Bates JH, Brusasco V, Camoretti-Mercado B, Chitano P, Deng LH, Dowell M, Fabry B, Ford LE, Fredberg JJ, Gerthoffer WT, Gilbert SH, Gunst SJ, Hai CM, Halayko AJ, Hirst SJ, James AL, Janssen LJ, Jones KA, King GG, Lakser OJ, Lambert RK, Lauzon AM, Lutchen KR, Maksym GN, Meiss RA, Mijailovich SM, Mitchell HW, Mitchell RW, Mitzner W, Murphy TM, Paré PD, Schellenberg RR, Seow CY, Sieck GC, Smith PG, Smolensky AV, Solway J, Stephens NL, Stewart AG, Tang DD, Wang L. On the terminology for describing the length-force relationship and its changes in airway smooth muscle. J Appl Physiol 97: 2029–2034, 2004 [DOI] [PubMed] [Google Scholar]
- 3. Biers SM, Reynard JM, Doore T, Brading AF. The functional effects of a c-kit tyrosine inhibitor on guinea-pig and human detrusor. BJU Int 97: 612–616, 2006 [DOI] [PubMed] [Google Scholar]
- 4. Bossé Y, Sobieszek A, Pare PD, Seow CY. Length adaptation of airway smooth muscle. Proc Am Thorac Soc 5: 62–67, 2008 [DOI] [PubMed] [Google Scholar]
- 5. Brading AF. A myogenic basis for the overactive bladder. Urology 50: 57–67, 1997 [DOI] [PubMed] [Google Scholar]
- 6. Brown SM, Bentcheva-Petkova LM, Liu L, Hristov KL, Chen M, Kellett WF, Meredith AL, Aldrich RW, Nelson MT, Petkov GV. Beta-adrenergic relaxation of mouse urinary bladder smooth muscle in the absence of large-conductance Ca2+-activated K+ channel. Am J Physiol Renal Physiol 295: F1149–F1157, 2008 [DOI] [PMC free article] [PubMed] [Google Scholar]
- 7. Butler TM, Mooers SU, Siegman MJ. Catch force links and the low to high force transition of myosin. Biophys J 90: 3193–3202, 2006. [DOI] [PMC free article] [PubMed] [Google Scholar]
- 8. Collins C, Klausner AP, Herrick B, Koo HP, Miner AS, Henderson SC, Ratz PH. Potential for control of detrusor smooth muscle spontaneous rhythmic contraction by cyclooxygenase products released by interstitial cells of Cajal. J Cell Mol Med. In press [DOI] [PMC free article] [PubMed] [Google Scholar]
- 9. Coolsaet BL, Van Duyl WA, Van Os-Bossagh P, De Bakker HV. New concepts in relation to urge and detrusor activity. Neurourol Urodyn 12: 463–471, 1993 [DOI] [PubMed] [Google Scholar]
- 10. Dillon PF, Aksoy MO, Driska SP, Murphy RA. Myosin phosphorylation and the cross-bridge cycle in arterial smooth muscle. Science 211: 495–497, 1981 [DOI] [PubMed] [Google Scholar]
- 11. Drake M, Gillespie J, Hedlund P, Harvey I, Lagou M, Andersson KE. Muscarinic stimulation of the rat isolated whole bladder: pathophysiological models of detrusor overactivity. Auton Autacoid Pharmacol 26: 261–266, 2006 [DOI] [PubMed] [Google Scholar]
- 12. Drake MJ, Harvey IJ, Gillespie JI. Autonomous activity in the isolated guinea pig bladder. Exp Physiol 88: 19–30, 2003 [DOI] [PubMed] [Google Scholar]
- 13. Drake MJ, Mills IW, Gillespie JI. Model of peripheral autonomous modules and a myovesical plexus in normal and overactive bladder function. Lancet 358: 401–403, 2001 [DOI] [PubMed] [Google Scholar]
- 14. Ekman M, Andersson KE, Arner A. Signal transduction pathways of muscarinic receptor mediated activation in the newborn and adult mouse urinary bladder. BJU Int 103: 90–97, 2009 [DOI] [PubMed] [Google Scholar]
- 15. Ford LE. Plasticity in airway smooth muscle: an update. Can J Physiol Pharmacol 83: 841–850, 2005 [DOI] [PubMed] [Google Scholar]
- 16. Ford LE, Gilbert SH. The significance of variable passive compliance in smooth muscle. J Appl Physiol 102: 1735–1736, 2007 [DOI] [PubMed] [Google Scholar]
- 17. Franke AS, Mooers SU, Narayan SR, Siegman MJ, Butler TM. Myosin cross-bridge kinetics and the mechanism of catch. Biophys J 93: 554–565, 2007 [DOI] [PMC free article] [PubMed] [Google Scholar]
- 18. Gillespie JI. The autonomous bladder: a view of the origin of bladder overactivity and sensory urge. BJU Int 93: 478–483, 2004 [DOI] [PubMed] [Google Scholar]
- 19. Gunst SJ, Tang DD, Opazo Saez A. Cytoskeletal remodeling of the airway smooth muscle cell: a mechanism for adaptation to mechanical forces in the lung. Respir Physiol Neurobiol 137: 151–168, 2003 [DOI] [PubMed] [Google Scholar]
- 20. Gunst SJ, Wu MF. Selected contribution plasticity of airway smooth muscle stiffness and extensibility role of length adaptive mechanisms. J Appl Physiol 90: 741–749, 2001 [DOI] [PubMed] [Google Scholar]
- 21. Hai CM, Murphy RA. Cross-bridge phosphorylation and regulation of latch state in smooth muscle. Am J Physiol Cell Physiol 254: C99–C106, 1988 [DOI] [PubMed] [Google Scholar]
- 22. Herrera GM, Etherton B, Nausch B, Nelson MT. Negative feedback regulation of nerve-mediated contractions by KCa channels in mouse urinary bladder smooth muscle. Am J Physiol Regul Integr Comp Physiol 289: R402–R409, 2005 [DOI] [PubMed] [Google Scholar]
- 23. Jezior JR, Brady JD, Rosenstein DI, McCammon KA, Miner AS, Ratz PH. Dependency of detrusor contractions on calcium sensitization and calcium entry through LOE-908-sensitive channels. Br J Pharmacol 134: 78–87, 2001 [DOI] [PMC free article] [PubMed] [Google Scholar]
- 24. Kanai A, Roppolo J, Ikeda Y, Zabbarova I, Tai C, Birder L, Griffiths D, de Groat W, Fry C. Origin of spontaneous activity in neonatal and adult rat bladders and its enhancement by stretch and muscarinic agonists. Am J Physiol Renal Physiol 292: F1065–F1072, 2007 [DOI] [PMC free article] [PubMed] [Google Scholar]
- 25. Kinder RB, Mundy AR. Pathophysiology of idiopathic detrusor instability and detrusor hyper-reflexia. An in vitro study of human detrusor muscle. Br J Urol 60: 509–515, 1987 [DOI] [PubMed] [Google Scholar]
- 26. Klausner AP, Rourke KF, Miner AS, Ratz PH. Potentiation of carbachol-induced detrusor smooth muscle contractions by beta-adrenoceptor activation. Eur J Pharmacol 606: 191–198, 2009 [DOI] [PMC free article] [PubMed] [Google Scholar]
- 27. Lagou M, Drake MJ, Markerink-Van Ittersum M, De Vente J, Gillespie JI. Interstitial cells and phasic activity in the isolated mouse bladder. BJU Int 98: 643–650, 2006 [DOI] [PubMed] [Google Scholar]
- 28. Mijailovich SM, Butler JP, Fredberg JJ. Perturbed equilibria of myosin binding in airway smooth muscle: bond-length distributions, mechanics, and ATP metabolism. Biophys J 79: 2667–2681, 2000 [DOI] [PMC free article] [PubMed] [Google Scholar]
- 29. Mullins CD. New perspectives on overactive bladder and its treatment. Am J Manag Care 15: S88–S89, 2009 [PubMed] [Google Scholar]
- 30. Poggesi L, Nicita G, Castellani S, Selli C, Galanti G, Turini D, Masotti G. The role of prostaglandins in the maintenance of the tone of the rabbit urinary bladder. Invest Urol 17: 454–458, 1980 [PubMed] [Google Scholar]
- 33. Ratz PH, Miner AS. Length-dependent regulation of basal myosin phosphorylation and force in detrusor smooth muscle. Am J Physiol Regul Integr Comp Physiol 284: R1063–R1070, 2003 [DOI] [PubMed] [Google Scholar]
- 34. Seow CY. Response of arterial smooth muscle to length perturbation. J Appl Physiol 89: 2065–2072, 2000 [DOI] [PubMed] [Google Scholar]
- 35. Seow CY, Pratusevich VR, Ford LE. Series-to-parallel transition in the filament lattice of airway smooth muscle. J Appl Physiol 89: 869–876, 2000 [DOI] [PubMed] [Google Scholar]
- 36. Shenfeld OZ, McCammon KA, Blackmore PF, Ratz PH. Rapid effects of estrogen and progesterone on tone and spontaneous rhythmic contractions of the rabbit bladder. Urol Res 27: 386–392, 1999 [DOI] [PubMed] [Google Scholar]
- 37. Shenfeld OZ, Morgan CW, Ratz PH. Bethanechol activates a post-receptor negative feedback mechanism in rabbit urinary bladder smooth muscle. J Urol 159: 252–257, 1998 [DOI] [PubMed] [Google Scholar]
- 38. Speich JE, Almasri AM, Bhatia H, Klausner AP, Ratz PH. Adaptation of the length-active tension relationship in rabbit detrusor. Am J Physiol Renal Physiol 297: F1119–F1128, 2009 [DOI] [PMC free article] [PubMed] [Google Scholar]
- 39. Speich JE, Borgsmiller L, Call C, Mohr R, Ratz PH. ROK-induced cross-link formation stiffens passive muscle: reversible strain-induced stress softening in rabbit detrusor. Am J Physiol Cell Physiol 289: C12–C21, 2005 [DOI] [PubMed] [Google Scholar]
- 40. Speich JE, Dosier C, Borgsmiller L, Quintero K, Koo HP, Ratz PH. Adjustable passive length-tension curve in rabbit detrusor smooth muscle. J Appl Physiol 102: 1746–1755, 2007 [DOI] [PubMed] [Google Scholar]
- 41. Speich JE, Quintero K, Dosier C, Borgsmiller L, Koo HP, Ratz PH. A mechanical model for adjustable passive stiffness in rabbit detrusor. J Appl Physiol 101: 1189–1198, 2006 [DOI] [PubMed] [Google Scholar]
- 42. Syyong H, Cheung C, Solomon D, Seow CY, Kuo KH. Adaptive response of pulmonary arterial smooth muscle to length change. J Appl Physiol 104: 1014–1020, 2008 [DOI] [PubMed] [Google Scholar]
- 43. Uvelius B. Isometric and isotonic length-tension relations and variations in cell length in longitudinal smooth muscle from rabbit urinary bladder. Acta Physiol Scand 97: 1–12, 1976. [DOI] [PubMed] [Google Scholar]