

Abstract
In sensory cortical networks, peripheral inputs differentially activate excitatory and inhibitory neurons. Inhibitory neurons typically have larger responses and broader receptive field tuning compared with excitatory neurons. These differences are thought to underlie the powerful feedforward inhibition that occurs in response to sensory input. In the motor cortex, as in the somatosensory cortex, cutaneous and proprioceptive somatosensory inputs, generated before and during movement, strongly and dynamically modulate the activity of motor neurons involved in a movement and ultimately shape cortical command. Human studies suggest that somatosensory inputs modulate motor cortical activity in a center excitation, surround inhibition manner such that input from the activated muscle excites motor cortical neurons that project to it, whereas somatosensory input from nearby, nonactivated muscles inhibit these neurons. A key prediction of this hypothesis is that inhibitory and excitatory motor cortical neurons respond differently to somatosensory inputs. We tested this prediction with the use of multisite extracellular recordings in anesthetized rats. We found that fast-spiking (presumably inhibitory) neurons respond to tactile and proprioceptive inputs at shorter latencies and larger response magnitudes compared with regular-spiking (presumably excitatory) neurons. In contrast, we found no differences in the receptive field size of these neuronal populations. Strikingly, all fast-spiking neuron pairs analyzed with cross-correlation analysis displayed common excitation, which was significantly more prevalent than common excitation for regular-spiking neuron pairs. These findings suggest that somatosensory inputs preferentially evoke feedforward inhibition in the motor cortex. We suggest that this provides a mechanism for dynamic selection of motor cortical modules during voluntary movements.
Keywords: fast-spiking, feedforward inhibition, network, receptive field, regular-spiking
extensive research has focused on input processing within cortical networks of all sensory modalities. Comparisons between excitatory and inhibitory cortical networks consistently show that inhibitory interneurons are more broadly tuned and tend to respond more strongly to inputs (Bruno and Simons 2002; Gibson et al. 1999; Keller 2001; Porter et al. 2001; Swadlow 2002). These increased response properties facilitate feedforward inhibition in response to thalamocortical input (Agmon and Connors 1992; Beierlein et al. 2003; Gabernet et al. 2005; Gil and Amitai 1996; Inoue and Imoto 2006; Sun et al. 2006). This inhibition, widespread within the cortex, dominates excitatory responses and sharpens them in a center-surround arrangement whereby inputs originating from a neuron receptive field activate that neuron and inputs from adjacent regions inhibit it. The importance of this center-surround arrangement has been demonstrated clearly for processing of tactile (for principle vs. adjacent whiskers, see Brumberg et al. 1996; for whisker direction tuning, see Wilent and Contreras 2005; for review, see Miller et al. 2001) and visual (Benevento et al. 1972; Blakemore and Tobin 1972; but see Ozeki et al. 2009) sensory input. In the auditory cortex, the same intracortical feedforward inhibition underlies the ability to perceptually separate two temporally adjacent stimuli (Wehr and Zador 2005). This inhibition-mediated sculpting of excitatory cortical input is thought to be a key feature of perceptual processing.
Evidence points to a similar arrangement in motor cortex such that afferents originating from the muscle field represented by a motor cortical neuron are able to excite that neuron and, at the same time, inhibit motor cortical neurons projecting to other muscle fields (Rosenkranz and Rothwell 2003). In this study, we address the question of how the properties of motor cortical neurons mediate this feedforward arrangement. Somatosensory afferents, both thalamocortical and corticocortical, target both excitatory and inhibitory neurons in motor cortex (reviewed in Keller 1999). We hypothesize that, as in the somatosensory cortex, the inhibitory neurons are more sensitive to these inputs and will therefore fire readily in response to somatosensory inputs. This will explain the widespread suppression that occurs in motor cortex in response to somatosensory inputs (Rosenkranz and Rothwell 2003). However, when a cortical neuron muscle field is stimulated (its excitatory center), somatosensory afferents will transiently converge and summate to drive that cortical neuron to spike threshold. This will explain the excitation of cortical neurons in response to peripheral stimulation of their muscle field.
Consistent with our hypothesis, we found that, compared with excitatory neurons, inhibitory neurons in motor cortex respond more readily to tactile stimulation. In addition, inhibitory neurons are activated synchronously by widespread divergent input from the periphery. Taken together, these data are consistent with powerful feedforward inhibition underlying center-excitation, surround inhibition evoked by afferent input during motor control.
MATERIALS AND METHODS
All procedures were approved by the University of Maryland School of Medicine Animal Care and Use Committee. Experiments were conducted according to institutional guidelines and federal regulations.
Surgical procedures.
Six female Sprague-Dawley rats, weighing 250–300 g, were used in this study. Rats were anesthetized with halothane (1–2%) and placed on a thermoregulated heating pad to maintain body temperature at 37°C. Lidocaine was applied locally, and a craniotomy was performed over M1.
Extracellular recordings.
Rats remained anesthetized under halothane, administered through a face mask, while head-fixed in a stereotaxic apparatus, and depth of anesthesia was monitored every 15 min by testing reflexes to pinching of the skin and cornea stimulation. Recordings of local field potential were used continually to confirm that remained in Guedel's anesthesia stage III-3 for the duration of the recordings. Extracellular recordings of single units were obtained with a 16-channel, multielectrode array (4 shafts separated by 125 μm, each having 4 recording sites separated by 100 μm; NeuroNexus Technologies, Ann Arbor, MI). The array was advanced through the hindlimb representation in M1 (0.5–1.5 mm anterior and 1–2 mm lateral to bregma; Sapienza et al. 1981). The depth of individual units was calculated based on an electrode map provided by NeuroNexus and on micrometer readings. Spike waveforms were digitized through a Plexon (Dallas, TX) data acquisition system, sampled at 40 kHz, and sorted offline with Plexon Offline Sorter. Detected waveforms with a signal-to-noise ratio of 3:1 were recorded; all others were ignored. Autocorrelograms generated with NeuroExplorer software (Nex Technologies, Littleton, MA) were used to confirm that recordings were obtained from single units.
Evoked responses.
The tip of the array was advanced in steps of 50 μm, and a handheld tactile probe (wooden, 2-mm diameter) was applied to the dorsal and plantar surfaces of the hindpaw while all 16 channels were simultaneously monitored. Receptive fields were defined as all locations on the surface of the skin that responded to brushing and tapping with the tactile probe with a clearly discernible increase in firing rate above spontaneous firing rate. Once a well-isolated unit was identified, its receptive field and the receptive fields of any other units detected through other channels were mapped with the handheld probe. Calibrated tactile stimuli (50 stimuli, 1 Hz, 5-ms duration; pipette tip attached to a linear DC-servomotor served as probe; V101 electrodynamic mechanical stimulator; LDS Group, Royston, United Kingdom) delivered to the receptive field area evoking the greatest response were recorded. Responses were recorded for all isolated units. Following tactile stimuli, vibratory stimuli (50 trains of 10 at 80 Hz, 6.25-ms duration) were applied. Spontaneous activity was then recorded for 90 s.
Data analysis.
Statistical analyses were performed with Intercooled Stata (Stata, College Station, TX). Between-group statistical comparisons were assessed with the nonparametric Wilcoxon rank-sum test. K-means cluster analysis was performed to partition the waveform scatter plot into two clusters.
Classification of units.
Excitatory and inhibitory motor cortical neurons were identified based on their extracellular waveform patterns. The initial wave duration was measured from the onset to its recrossing of baseline, and the duration of the second phase was measured from the end of the initial wave to its recrossing of baseline (Bruno and Simons 2002).
Responses to calibrated stimuli.
Timestamps of well-isolated units and of stimulus triggers were exported to MATLAB software (MathWorks, Natick, MA) for analyses using custom-written algorithms. To quantify neuronal responses to stimulation, peristimulus time histograms (PSTHs; 50 stimuli, 1-ms bin width) were constructed, and significant stimulus-evoked responses were defined as PSTH bins with response magnitudes that significantly exceeded (99% confidence interval) spontaneous activity levels, computed from a 100-ms period preceding the stimuli. Response onset was defined as the 1st of 2 consecutive bins (poststimulus) displaying significant responses and response offset as 3 consecutive bins in which response magnitude falls below the 99% confidence interval. Response magnitude was defined as the total number of spikes per stimulus occurring between response onset and offset. During vibratory stimulation, the 1st stimulus was used as the trigger. Responses to each stimulus in the vibratory stimuli train was also computed as the total number of significant spikes within the 12.5-ms period between each stimulation.
Cross-correlations.
Spontaneous activity of isolated units (see above) was recorded for 15 min and used for cross-correlation analysis. The maximum distance between simultaneously recorded units was 250 μm. For each pair of units, cross-correlograms (±50 ms, 1-ms bin size) were computed to determine the probability of a spike from one unit (target) in relation to the spike from another unit (reference) as a function of time. Excitation of the target unit was indicated by a peak exceeding the upper 99% confidence limit, inhibition by a trough that dropped below the lower 99% confidence limit.
RESULTS
We hypothesized that excitatory and inhibitory neurons in the motor cortex respond differently to somatosensory input. Specifically, we hypothesized that inhibitory neurons would respond more readily and have larger receptive fields.
We used an established method to identify putative excitatory and inhibitory neurons from their extracellularly recorded waveforms (Mountcastle et al. 1969; Simons 1978). Units classified as fast-spiking (FSUs) are widely accepted to represent parvalbumin-containing, GABAergic interneurons (DeFelipe et al. 2002; Kawaguchi 1995; Kawaguchi and Kubota 1996). The vast majority of regular-spiking units (RSUs) are excitatory, pyramidal projection neurons. However, some classes of cortical inhibitory neurons have action potential waveforms that meet the RSU criteria (Gibson et al. 1999; Kawaguchi and Kubota 1993). It is therefore likely that some of our RSU population represent inhibitory interneurons.
Classification of RSUs and FSUs.
As has been shown in other studies, excitatory and inhibitory cortical neurons can be determined based on their extracellular action potential waveform patterns (Bruno and Simons 2002; McCormick et al. 1985; Simons 1978). We measured the duration of the initial wave, from onset to its recrossing of baseline, and the duration of the 2nd phase, measured from the end of the initial wave to its recrossing of baseline (Fig. 1A, inset). A scatter plot was created, and k-means cluster analysis was performed to identify 2 distinct groups (Fig. 1A) corresponding to RSUs and FSUs. Seventy-eight units were characterized: 48 were classified as RSUs, and 30 were classified as FSUs. In agreement with Bruno and Simons (2002), the RSU cluster had longer initial (mean 306 ± 48 μs, median 300, range 220–400) and secondary (741 ± 54 μs, median 753, range 600–800; see materials and methods) phases than FSU initial (mean 246 ± 51 μs, median 250, range 145–350) and secondary (mean 448 ± 71 μs, median 450, range 300–585) phases. Our values are slightly larger than the values obtained in the rat somatosensory cortex by Bruno and Simons (2002), who also reported more discrete clustering of RSUs and FSUs, based on action potential indices. This may reflect differences between somatosensory and motor cortices, as recently observed in primate motor cortex (Levy et al. 2010). Nevertheless, as we show below, our main conclusions are not affected by the method used to classify these neuronal groups.
Fig. 1.
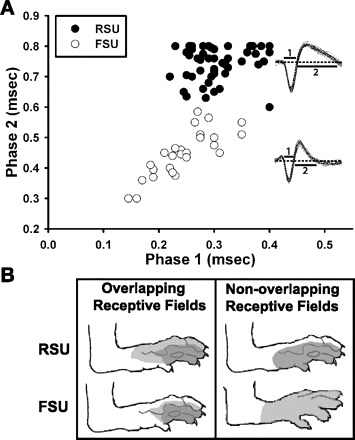
Motor cortical neurons types can be differentiated from extracellular waveform patterns. A: scatter plot of initial and secondary action potential phase durations for regular-spiking units (RSUs; n = 48; ●) and fast-spiking units (FSUs; n = 30; ○). Inset: example waveforms of each cell type with different action potential phases labeled (dashed line = baseline). B: representative receptive fields for an RSU-FSU pair with overlapping receptive fields (left) and an RSU-FSU pair with nonoverlapping receptive fields (FSU responds to stimulation of dorsal surface, RSU to plantar surface; right). Darker gray indicates region evoking most spikes.
Receptive fields.
In sensory cortices, RSUs and FSUs can differ in their receptive field properties. Studies in somatosensory, visual, and auditory cortices show that FSUs respond more readily and have larger (somatosensory) or more broadly tuned (visual and auditory) receptive fields (Atencio and Schreiner 2008; Bruno and Simons 2002; Simons and Carvell 1989; Swadlow and Weyand 1987). We compared receptive fields between RSUs and FSUs in rat motor cortex by measuring the body surface area from which responses could be evoked in these neurons (see materials and methods). Statistical comparison showed no difference between RSUs and FSUs (normalized surface area, Wilcoxon rank-sum test, P = 0.2; RSUs, n = 16 cells; FSUs, n = 11 cells; Fig. 1B). As the vast majority of our recorded units were from the hindpaw representation, receptive fields showed a high degree of overlap in hindpaw surface area. However, there was one exception in which receptive fields did not overlap. Shown in Fig. 1B are two example RSU-FSU pairs that responded to tactile stimulation of the hindpaw and had overlapping (left) or nonoverlapping (right) receptive fields.
Responses to tactile stimuli.
Having distinguished RSUs from FSUs, we sought to compare response properties of each cell type. To do this, we applied calibrated tactile stimuli to the skin (see materials and methods). Following receptive field characterization with a handheld probe, the calibrated probe was positioned to evoke the greatest response. Compared with RSUs, FSUs responded with a shorter onset latency (mean 11 ± 3 ms, median 10, range 6–21, n = 21 cells; RSUs, mean 15 ± 6 ms; median 14, range 4–29; n = 27; Wilcoxon rank-sum test, P = 0.004; Fig. 2B). Response magnitude was greater for FSUs compared with RSUs (mean 0.77 ± 0.74 spikes per stimulus; median 0.56, range 0.06–3.3; RSUs, 0.30 ± 0.40; median 0.09, range 0–1.3; P < 0.001; Fig. 2C), and response duration was longer for FSUs compared with RSUs (mean 9.9 ± 6.5 ms, median 10, range 2–33; RSUs, mean 6.3 ± 4.6, median 5.0, range 2–18; P = 0.01; Fig. 2D). To determine whether the response properties within each cell types varied according to cortical layer, we compared superficial (layer II/III) and deep (layer V) neurons. None of the response parameters examined above were significantly different between superficial and deep RSUs (onset latency, P = 0.4; response magnitude, P = 0.9; response duration, P = 0.3; n = 4 deep, 21 superficial cells; Wilcoxon rank-sum test) or between superficial and deep FSUs (onset latency, P = 0.9; response magnitude, P = 0.5; response duration, P = 0.07; n = 14 deep, 7 superficial cells).
Fig. 2.

RSU and FSU responses to tactile stimuli. A: peristimulus time histograms (PSTH; 1-ms bin) of example sensory-evoked responses demonstrate that FSU responses are markedly higher than RSU responses. Dashed lines represent 99% confidence interval. B–D: grouped response data. Boxes represent the 25th and 75th percentile of distribution, solid horizontal lines depict the means, and dashed lines represent mean values; whiskers show the 10th and 90th percentiles. B: FSUs (n = 21 cells) have significantly shorter response onset latency than RSUs (n = 27 cells) to tactile stimuli. C: tactile stimuli evoked significantly more spikes per stimulus in FSUs compared with RSUs. D: tactile response duration was significantly longer in FSUs compared with RSUs.
Responses to vibratory stimuli.
Vibratory stimuli preferentially activate Ia proprioceptive muscle afferents (Burke et al. 1976; Roll et al. 1989; Woolsey et al. 1952). As was the case with tactile stimuli, responses to vibratory stimuli evoked shorter latency responses in FSUs compared with RSUs (mean 12 ± 3 ms, median 10, range 9–17, n = 11 cells; RSUs, mean 15 ± 5, median 15, range 8–26, n = 31; Wilcoxon rank-sum test, P = 0.047; Fig. 3A). In addition, response magnitude was greater for FSUs (mean 0.98 ± 1.1 spikes per stimulus, median 0.58, range 0.12–3.2; RSUs, mean 0.41 ± 0.45, median 0.25, range 0–1.7; P = 0.02; Fig. 3B) as well as response duration (mean 14 ± 8 ms, median 13, range 2–28; RSUs, mean 7 ± 5, median 6, range 2–20; P = 0.01; Fig. 3C). Comparing responses from each cell type in the superficial cortical layers with those of the deep layers revealed no differences in response magnitude or duration (RSUs layer II/III vs. layer IV/V: response magnitude: P = 0.3; response duration: P = 0.3; FSUs layer II/III vs. layer V: response magnitude: P = 0.4). Layer II/III RSUs, however, showed a shorter onset latency than RSUs in layers IV and V (mean 11 ± 2.1, median 11, range 8–13, n = 7 cells; layers IV and V: mean 16 ± 4.9, median 16, range 9–26, n = 24; P = 0.006). In contrast, FSUs from superficial and deep layers showed no difference in onset latencies (P = 0.6). The high-frequency protocol allowed us to compare stimulus-evoked adaptation between RSUs and FSUs. Studies in the rat barrel cortex using depolarizing current injection (Beierlein et al. 2003; Gibson et al. 1999; Porter et al. 2001) and high-frequency stimulation (whisker deflections; Simons 1978) show that adaptation is more pronounced for RSUs than FSUs. Consistent with these reports, the response to vibratory stimuli was significantly higher for FSUs following the third stimulation in the stimuli train (mean 0.32 ± 0.31 spikes per stimulus, median 0.29, range 0–1.0, n = 14 cells; RSU: 0.13 ± 0.25, median 0.01, range 0–1.2, n = 33 cells; Wilcoxon rank-sum test, P = 0.006; Fig. 3D; see materials and methods). Responses to stimuli 4–10 are not significantly different between RSUs and FSUs. This may reflect comparable degrees of adaptation in both cell types at these later stimuli. Given the decreased level of stimuli entrainment of FSU responses at 40 Hz (Khatri et al. 2004; Simons 1978), comparable responses might be expected at the 80 Hz used here. Moreover, adaptation may explain the lack of significant differences in overall response magnitude and response duration to vibratory stimulation.
Fig. 3.

RSU and FSU responses to vibratory stimuli. Compared with RSUs (n = 31 cells), FSUs (n = 11 cells) responded to vibratory stimuli with shorter onset latencies (A) and with greater response magnitudes (B) and response durations (C). Boxes represent the 25th and 75th percentile of distribution, and dashed lines represent mean values; whiskers show the 10th and 90th percentiles. D: example responses of an RSU (gray) and an FSU (black) to stimuli 1–3 of the vibratory train. Triangles represent stimuli beginning at time 0; dashed lines represent 99% confidence intervals. Note the rapid attenuation of the RSU response compared with the FSU response.
Spontaneous firing rate.
Spontaneous activity was recorded from 50 isolated motor cortical units. We found no difference in spontaneous firing rates of RSUs and FSUs (RSU, mean 2.7 ± 3.2 Hz, median 1.1, range 0–12, n = 33 cells; FSU, mean 1.6 ± 1.4, median 1.4, range 0–4.9, n = 17; Wilcoxon rank-sum test, P = 0.8). A comparison of spontaneous activity showed that deep layer RSUs fire at a higher rate than superficial RSUs (layer II/III: mean 0.62 ± 0.76 Hz, median 0.18, range 0–1.7, n = 5 cells; layer IV/V: 3.2 ± 3.4, median 1.9, range 1–12, n = 26; P = 0.04). Spontaneous firing rate between superficial and deep FSU neurons was not significantly different.
That RSU and FSU have similar spontaneous firing rates raised concerns that the statistical method by which we distinguished these groups may not have led to accurate classifications. To address this concern, we reanalyzed spontaneous firing rate as well as all of the response data after removal of ⅓ of the units (27) with intermediate waveform durations (phase 1 = 0.25–0.3 ms). The results of this analysis were indistinguishable from those performed with all the neurons included: spontaneous firing rates of FSUs and RSUs remained indistinguishable, and the differences noted above for response latency and magnitude remained unchanged.
Cross-correlations.
One hundred eighty-two cross-correlograms between unit pairs were compiled for identified RSUs and FSUs. Of these, 79 cross-correlograms resulted in significant features. All pairs were recorded from different electrodes located on the same or immediately adjacent electrode shaft, and their calculated separation ranged from 100 to 250 μm.
The most common feature between pairs of RSUs (Fig. 4A) and pairs of FSUs (Fig. 4B) was a central peak, indicative of excitation by a common input source (for review, see Fetz et al. 1991). Common excitation occurred in nearly half of RSU pairs (12 out of 25 pairs, 48%). Strikingly, all FSU pairs displayed common excitation (15 out of 15 pairs), significantly more prevalent than common excitation between RSU pairs (P < 0.001, χ2 test). Common excitation also occurred among mixed RSU-FSU pairs (17 out of 39 pairs, 44%), which is also statistically less prevalent than commonly excited FSU pairs (P < 0.001).
Fig. 4.

Cross-correlation histograms from motor cortical RSUs and FSUs. Firing probability histograms were constructed with 1-ms bins. Dashed horizontal lines indicate 99% confidence limits. For each panel, 1st unit type in label indicates reference unit, 2nd indicates target. Central peaks above the 99% confidence limit indicate common excitatory input to a pair of RSUs (A) and a pair of FSUs (B). C: a peak to the right of time 0 indicates serial excitation between an RSU-RSU pair. D and E: cross-correlograms of a reciprocally innervated RSU-FSU pair. D: example serial excitation of target FSU by a reference RSU. E: reversing the target and reference roles of units in D shows inhibition of the target RSU (histogram drops below lower 99% confidence limit) by reference FSU. F: FSU-RSU pair, with RSU showing a trend toward inhibition that does not pass the lower 99% confidence limit. The RSU also displays excitation just before time 0.
The 2nd most common feature between pairs of RSUs was a peak appearing after time 0, corresponding to increased firing probability of the target cell after a reference cell spike at time 0 (11 out of 25 unit pairs, 44%; see materials and methods). These were interpreted as serial excitation of the target cell by the reference cell (Fig. 4C; Fetz et al. 1991; Fetz and Gustafsson 1983). Not surprisingly, the most common output from an RSU to an FSU was serial excitation (19 out of 23 pairs, 83%; Fig. 4D). Some RSU-FSU pairs within this group (4 out of 23 unit pairs, 17%) displayed both common and serial excitation, indicated by a central peak and a peak appearing after time 0.
In 6 out of 16 FSU-RSU pairs (38%; FSU is reference, RSU is target), cross-correlograms showed a trough that failed to reach below the lower 99% confidence limit. An example of this activity is seen in Fig. 4F. In this example, inhibition was preceded by excitation from another unit, indicative of both excitatory and inhibitory inputs on the target RSU. However, serial inhibition, in which the trough does reach below the lower 99% confidence limit, was observed (1 out of 16 pairs, 6%; Fig. 4E). Additionally, 1 FSU-RSU pair displayed common excitation followed by a nonsignificant trend toward inhibition (out of 16 unit pairs, 6%).
RSU-FSU interactions.
Cross-correlograms from 8 RSU-FSU pairs showed evidence for reciprocal connectivity. In 6 of these pairs, FSUs showed either serial inhibition or a nonsignificant trend toward inhibition on a target RSU. Three of these pairs displayed common excitation. When unit pairs were analyzed with the FSUs as targets, all pairs showed serial excitation on the FSU (3 out of 8 pairs, 38%), a combination serial and common excitation (4 out of 8 pairs, 50%), or serial excitation preceded by a trend toward inhibition (1 out of 8 pairs, 13%). Example cross-correlograms from a reciprocal pair is shown in Fig. 4: an RSU causes serial excitation of the FSU (Fig. 4D), and the FSU imparts inhibition of the RSU (Fig. 4E).
DISCUSSION
The motor cortex contains multiple, noncontiguous, highly overlapping representations of muscles and movements (Penfield and Rasmussen 1950; Woolsey et al. 1952; for review, see Schieber 2001). This arrangement might impart computational advantages during movement execution by virtue of the close apposition of neurons involved in the same movement, such as the neurons controlling shoulder and wrist muscles during movement (Aflalo and Graziano 2006; Sanes and Donoghue 2000; Schieber 2001). A distributed, redundant organization also offers advantages for regulating the rapid plasticity in motor cortex that results from motor training or disease states (Keller 1999; Nudo 2006; Sanes and Donoghue 2000). From this, it follows that during the execution of voluntary movements, this distributed network must organize dynamically to generate multijointed motor actions. The key question, and the one we aim to address, therefore, is: what are the parameters encoded by the activity of motor cortical neurons that govern the synthesis of movement commands?
FSUs respond to tactile stimuli more robustly than RSUs.
Excitatory and inhibitory neurons contribute in unique ways to cortical information processing. In this study, we compared the response properties of putative excitatory (RSUs) and inhibitory (FSUs) neurons in the motor cortex to tactile and vibratory stimuli. We found that FSUs respond to stimuli with greater responsivity, at a shorter latency, and with longer durations compared with RSUs. Studies in the somatosensory cortex showed that stimulation of thalamocortical afferents (Cruikshank et al. 2007; Porter et al. 2001) as well as stimulation by whisker deflection (Bruno and Simons 2002; Simons 1978; Zhu and Connors 1999) evokes more robust activation of inhibitory interneurons, and at shorter latencies, compared with excitatory neurons. Similarly, inhibitory interneurons in the awake rabbit have more broadly tuned receptive fields and lower whisker deflection thresholds for activation (Swadlow 2003). A recent study in which thalamocortical afferents were stimulated with light following infection with the light-activated protein channelrhodopsin confirms these results (Cruikshank et al. 2010). Studies in other sensory cortices indicate that increased responsivity and more broadly tuned receptive fields are common properties of inhibitory interneurons across modalities. In the visual cortex, interneurons with action potentials of short duration similar to FSUs respond at short latency and have receptive fields that are not orientation selective (Swadlow and Weyand 1987). FSUs in the auditory cortex likewise responded to stimuli at short latencies and with broader spectral tuning compared with RSUs (Atencio and Schreiner 2008). Taken together, these and our data suggest that afferent inputs to both sensory and motor cortical areas preferentially activate inhibitory neurons.
FSUs share greater common excitation.
Besides their greater tactile responses, FSU-FSU pairs showed greater incidence of common activation than RSU-RSU pairs (Fig. 4). This marks another similarity to the somatosensory cortex where the sharp synchrony of presumptive inhibitory neurons within the same barrel is mediated by highly convergent/divergent, monosynaptic thalamocortical input (Swadlow 1995; Swadlow and Gusev 2002; Swadlow et al. 1998; for reviews, see Swadlow 2002, 2003). A recent study showed that connectivity between topographically aligned, thalamus-barrel cortex pairs was twice as likely for FSUs than for RSUs (Bruno and Simons 2002). Likewise, activity of FSU pairs in the dorsolateral prefrontal cortex exhibit greater correlation than RSU-RSU or RSU-FSU pairs (Constantinidis and Goldman-Rakic 2002). Moreover, synaptic efficacy is significantly greater for thalamocortical afferents projecting onto FSUs than onto RSUs (Cruikshank et al. 2007; Porter et al. 2001). Greater common input to FSUs alone could explain the increased common excitation seen in our study. In addition, gap junction coupling between cortical inhibitory neurons (Beierlein et al. 2000; Galarreta and Hestrin 1999; Gibson et al. 1999) would further contribute to synchronous activity.
A network of highly responsive, synchronized inhibitory interneurons would be effective in suppressing excitatory drive within a network. Taken together with the latency data, activation of this network that precedes that of the excitatory network further supports the notion that simultaneous excitation of projection neurons may be required to overcome feedforward inhibition.
RSU and FSU receptive fields are similar.
Contrary to other cortical areas studied to date, we did not find a difference in receptive field size between excitatory and inhibitory neurons (Armstrong-James et al. 1993; Bruno and Simons 2002; Simons and Carvell 1989). It is important to note that the majority of our recordings were from the hindpaw representation of the motor cortex (Neafsey et al. 1986), and, as such, nearly all the mapped receptive fields overlapped extensively. This sampling bias is likely to have affected our comparisons of receptive field sizes. Further studies in this area will be needed to definitively address this question.
Overlap of rat somatosensory and motor cortices.
Considering the significant overlap of hindpaw representations in the rat somatosensory and motor cortices (Chapin 1986; Sapienza et al. 1981), a subgroup of cells analyzed in this study are likely somatosensory in origin. We attempted to maximize recordings from motor cortical neurons by targeting the rostral portion of the M1 hindpaw representation where the S1 representation is scarcer (see materials and methods). The fact that our data include some of somatosensory neurons, however, does not affect our conclusion that greater responsivity of FSUs contributes to the feedforward inhibition of a center-surround arrangement as S1 afferents converge on motor cortical loci (Aizawa and Tanji 1994; Godschalk et al. 1984; Porter 1992; Swadlow 1994; Zarzecki 1991), and thus S1 and M1 inputs are likely to affect M1 neurons in a similar manner.
Recent evidence from the sensory cortex suggests that the increased responsivity of inhibitory compared with excitatory neurons is not due to differences in intrinsic cellular properties but to the differences in the strength of thalamocortical inputs targeting each cell type (Cruikshank et al. 2007; Porter et al. 2001). Considered together, the current findings of increased interneuronal responsivity and their high tendency to be coactivated are consistent with a feedforward inhibitory motor cortical network powerfully activated by divergent thalamocortical input. This arrangement, which, in S1, serves to sharpen sensory-evoked responses that lead to perception, may increase output contrast in motor cortex to functionally link areas involved in movement.
GRANTS
The project described was supported by National Institute of Neurological Disorders and Stroke Grant R01-NS-35360.
DISCLOSURES
The content is solely the responsibility of the authors and does not necessarily represent the official views of the National Institute of Neurological Disorders and Stroke or the National Institutes of Health.
REFERENCES
- Aflalo TN, Graziano MS. Possible origins of the complex topographic organization of motor cortex: reduction of a multidimensional space onto a two-dimensional array. J Neurosci 26: 6288–6297, 2006 [DOI] [PMC free article] [PubMed] [Google Scholar]
- Agmon A, Connors BW. Correlation between intrinsic firing patterns and thalamocortical synaptic responses of neurons in mouse barrel cortex. J Neurosci 12: 319–329, 1992 [DOI] [PMC free article] [PubMed] [Google Scholar]
- Aizawa H, Tanji J. Corticocortical and thalamocortical responses of neurons in the monkey primary motor cortex and their relation to a trained motor task. J Neurophysiol 71: 550–560, 1994 [DOI] [PubMed] [Google Scholar]
- Armstrong-James M, Welker E, Callahan CA. The contribution of NMDA and non-NMDA receptors to fast and slow transmission of sensory information in the rat Sl barrel cortex. J Neurosci 13: 2149–2160, 1993 [DOI] [PMC free article] [PubMed] [Google Scholar]
- Atencio CA, Schreiner CE. Spectrotemporal processing differences between auditory cortical fast-spiking and regular-spiking neurons. J Neurosci 28: 3897–3910, 2008 [DOI] [PMC free article] [PubMed] [Google Scholar]
- Beierlein M, Gibson JR, Connors BW. A network of electrically coupled interneurons drives synchronized inhibition in neocortex. Nat Neurosci 3: 904–910, 2000 [DOI] [PubMed] [Google Scholar]
- Beierlein M, Gibson JR, Connors BW. Two dynamically distinct inhibitory networks in layer 4 of the neocortex. J Neurophysiol 90: 2987–3000, 2003 [DOI] [PubMed] [Google Scholar]
- Benevento LA, Creutzfeldt OD, Kuhnt U. Significance of intracortical inhibition in the visual cortex. Nat New Biol 238: 124–126, 1972 [DOI] [PubMed] [Google Scholar]
- Blakemore C, Tobin EA. Lateral inhibition between orientation detectors in the cat's visual cortex. Exp Brain Res 15: 439–440, 1972 [DOI] [PubMed] [Google Scholar]
- Brumberg JC, Pinto DJ, Simons DJ. Spatial gradients and inhibitory summation in the rat whisker barrel system. J Neurophysiol 76: 130–140, 1996 [DOI] [PubMed] [Google Scholar]
- Bruno RM, Simons DJ. Feedforward mechanisms of excitatory and inhibitory cortical receptive fields. J Neurosci 22: 10966–10975, 2002 [DOI] [PMC free article] [PubMed] [Google Scholar]
- Burke D, Hagbarth KE, Lofstedt L, Wallin BG. The responses of human muscle spindle endings to vibration of non-contracting muscles. J Physiol 261: 673–693, 1976 [DOI] [PMC free article] [PubMed] [Google Scholar]
- Chapin JK. Laminar differences in sizes, shapes, and response profiles of cutaneous receptive fields in the rat SI cortex. Exp Brain Res 62: 549–559, 1986 [DOI] [PubMed] [Google Scholar]
- Constantinidis C, Goldman-Rakic PS. Correlated discharges among putative pyramidal neurons and interneurons in the primate prefrontal cortex. J Neurophysiol 88: 3487–3497, 2002 [DOI] [PubMed] [Google Scholar]
- Cruikshank SJ, Lewis TJ, Connors BW. Synaptic basis for intense thalamocortical activation of feedforward inhibitory cells in neocortex. Nat Neurosci 10: 462–468, 2007 [DOI] [PubMed] [Google Scholar]
- Cruikshank SJ, Urabe H, Nurmikko AV, Connors BW. Pathway-specific feedforward circuits between thalamus and neocortex revealed by selective optical stimulation of axons. Neuron 65: 230–245, 2010 [DOI] [PMC free article] [PubMed] [Google Scholar]
- DeFelipe J, Elston GN, Fujita I, Fuster J, Harrison KH, Hof PR, Kawaguchi Y, Martin KA, Rockland KS, Thomson AM, Wang SS, White EL, Yuste R. Neocortical circuits: evolutionary aspects and specificity versus non-specificity of synaptic connections. Remarks, main conclusions and general comments and discussion. J Neurocytol 31: 387–416, 2002 [DOI] [PubMed] [Google Scholar]
- Fetz EE, Gustafsson B. Relation between shapes of post-synaptic potentials and changes in firing probability of cat motoneurones. J Physiol 341: 387–410, 1983 [DOI] [PMC free article] [PubMed] [Google Scholar]
- Fetz EE, Toyama K, Smith W. Synaptic interactions between cortical neurons. In: Cerebral Cortex, Vol. IX: Altered Cortical States, edited by Peters A, Jones EG. New York: Plenum Press, 1991, p. 1–47 [Google Scholar]
- Gabernet L, Jadhav SP, Feldman DE, Carandini M, Scanziani M. Somatosensory integration controlled by dynamic thalamocortical feed-forward inhibition. Neuron 48: 315–327, 2005 [DOI] [PubMed] [Google Scholar]
- Galarreta M, Hestrin S. A network of fast-spiking cells in the neocortex connected by electrical synapses. Nature 402: 72–75, 1999 [DOI] [PubMed] [Google Scholar]
- Gibson JR, Beierlein M, Connors BW. Two networks of electrically coupled inhibitory neurons in neocortex. Nature 402: 75–79, 1999 [DOI] [PubMed] [Google Scholar]
- Gil Z, Amitai Y. Properties of convergent thalamocortical and intracortical synaptic potentials in single neurons of neocortex. J Neurosci 16: 6567–6578, 1996 [DOI] [PMC free article] [PubMed] [Google Scholar]
- Godschalk M, Lemon RN, Kuypers HG, Ronday HK. Cortical afferents and efferents of monkey postarcuate area: an anatomical and electrophysiological study. Exp Brain Res 56: 410–424, 1984 [DOI] [PubMed] [Google Scholar]
- Inoue T, Imoto K. Feedforward inhibitory connections from multiple thalamic cells to multiple regular-spiking cells in layer 4 of the somatosensory cortex. J Neurophysiol 96: 1746–1754, 2006 [DOI] [PubMed] [Google Scholar]
- Kawaguchi Y. Physiological subgroups of nonpyramidal cells with specific morphological characteristics in layer II/III of rat frontal cortex. J Neurosci 15: 2638–2655, 1995 [DOI] [PMC free article] [PubMed] [Google Scholar]
- Kawaguchi Y, Kubota Y. Correlation of physiological subgroupings of nonpyramidal cells with parvalbumin- and calbindinD28k-immunoreactive neurons in layer V of rat frontal cortex. J Neurophysiol 70: 387–396, 1993 [DOI] [PubMed] [Google Scholar]
- Kawaguchi Y, Kubota Y. Physiological and morphological identification of somatostatin- or vasoactive intestinal polypeptide-containing cells among GABAergic cell subtypes in rat frontal cortex. J Neurosci 16: 2701–2715, 1996 [DOI] [PMC free article] [PubMed] [Google Scholar]
- Keller A. Intrinsic synaptic interactions in the barrel cortex. Proceedings of the Fourth Meeting of the German Neuroscience Society Göttingen, Germany, 2001, p. 138 [Google Scholar]
- Keller A. The role of intrinsic circuitry in motor cortex plasticity. In: The Changing Nervous System: Neurobehavioral Consequences of Early Brain Disorders, edited by Broman SA, Fletcher JM. New York: Oxford Univ. Press, 1999, p. 428 [Google Scholar]
- Khatri V, Hartings JA, Simons DJ. Adaptation in thalamic barreloid and cortical barrel neurons to periodic whisker deflections varying in frequency and velocity. J Neurophysiol 92: 3244–3254, 2004 [DOI] [PubMed] [Google Scholar]
- Levy SC, Law AJ, Davidson AG, Schieber MH. Fast-spiking to regular-spiking contnuum among primate motor cortex neurons (Online). Program no. 494.16.2010 Neuroscience Meeting Planner San Diego, CA: Society for Neuroscience, 2010 [Google Scholar]
- McCormick DA, Connors BW, Lighthall JW, Prince DA. Comparative electrophysiology of pyramidal and sparsely spiny stellate neurons of the neocortex. J Neurophysiol 54: 782–806, 1985 [DOI] [PubMed] [Google Scholar]
- Miller KD, Pinto DJ, Simons DJ. Processing in layer 4 of the neocortical circuit: new insights from visual and somatosensory cortex. Curr Opin Neurobiol 11: 488–497, 2001 [DOI] [PubMed] [Google Scholar]
- Mountcastle VB, Talbot WH, Sakata H, Hyvarinen J. Cortical neuronal mechanisms in flutter-vibration studied in unanesthetized monkeys. Neuronal periodicity and frequency discrimination. J Neurophysiol 32: 452–484, 1969 [DOI] [PubMed] [Google Scholar]
- Neafsey EJ, Bold EL, Haas G, Hurley-Gius KM, Quirk G, Sievert CF, Terreberry RR. The organization of the rat motor cortex: a microstimulation mapping study. Brain Res 396: 77–96, 1986 [DOI] [PubMed] [Google Scholar]
- Nudo RJ. Mechanisms for recovery of motor function following cortical damage. Curr Opin Neurobiol 16: 638–644, 2006 [DOI] [PubMed] [Google Scholar]
- Ozeki H, Finn IM, Schaffer ES, Miller KD, Ferster D. Inhibitory stabilization of the cortical network underlies visual surround suppression. Neuron 62: 578–592, 2009 [DOI] [PMC free article] [PubMed] [Google Scholar]
- Penfield W, Rasmussen T. The Cerebral Cortex of Man: A Clinical Study of Localization of Function. New York: MacMillan, 1950 [Google Scholar]
- Porter JT, Johnson CK, Agmon A. Diverse types of interneurons generate thalamus-evoked feedforward inhibition in the mouse barrel cortex. J Neurosci 21: 2699–2710, 2001 [DOI] [PMC free article] [PubMed] [Google Scholar]
- Porter LL. Patterns of projections from area 2 of the sensory cortex to area 3a and to the motor cortex in cats. Exp Brain Res 91: 85–93, 1992 [DOI] [PubMed] [Google Scholar]
- Roll JP, Vedel JP, Ribot E. Alteration of proprioceptive messages induced by tendon vibration in man: a microneurographic study. Exp Brain Res 76: 213–222, 1989 [DOI] [PubMed] [Google Scholar]
- Rosenkranz K, Rothwell JC. Differential effect of muscle vibration on intracortical inhibitory circuits in humans. J Physiol 551: 649–660, 2003 [DOI] [PMC free article] [PubMed] [Google Scholar]
- Sanes JN, Donoghue JP. Plasticity and primary motor cortex. Annu Rev Neurosci 23: 393–415, 2000 [DOI] [PubMed] [Google Scholar]
- Sapienza S, Talbi B, Jacquemin J, Albe-Fessard D. Relationship between input and output of cells in motor and somatosensory cortices of the chronic awake rat. A study using glass micropipettes. Exp Brain Res 43: 47–56, 1981 [DOI] [PubMed] [Google Scholar]
- Schieber MH. Constraints on somatotopic organization in the primary motor cortex. J Neurophysiol 86: 2125–2143, 2001 [DOI] [PubMed] [Google Scholar]
- Simons DJ. Response properties of vibrissa units in rat SI somatosensory neocortex. J Neurophysiol 41: 798–820, 1978 [DOI] [PubMed] [Google Scholar]
- Simons DJ, Carvell GE. Thalamocortical response transformation in rat vibrissa/barrel system. J Neurophysiol 61: 311–330, 1989 [DOI] [PubMed] [Google Scholar]
- Sun QQ, Huguenard JR, Prince DA. Barrel cortex microcircuits: thalamocortical feedforward inhibition in spiny stellate cells is mediated by a small number of fast-spiking interneurons. J Neurosci 26: 1219–1230, 2006 [DOI] [PMC free article] [PubMed] [Google Scholar]
- Swadlow HA. Efferent neurons and suspected interneurons in motor cortex of the awake rabbit: axonal properties, sensory receptive fields, and subthreshold synaptic inputs. J Neurophysiol 71: 437–453, 1994 [DOI] [PubMed] [Google Scholar]
- Swadlow HA. Fast-spike interneurons and feedforward inhibition in awake sensory neocortex. Cereb Cortex 13: 25–32, 2003 [DOI] [PubMed] [Google Scholar]
- Swadlow HA. Influence of VPM afferents on putative inhibitory interneurons in S1 of the awake rabbit: evidence from cross-correlation, microstimulation, and latencies to peripheral sensory stimulation. J Neurophysiol 73: 1584–1599, 1995 [DOI] [PubMed] [Google Scholar]
- Swadlow HA. Thalamocortical control of feed-forward inhibition in awake somatosensory ‘barrel’ cortex. Philos Trans R Soc Lond B Biol Sci 357: 1717–1727, 2002 [DOI] [PMC free article] [PubMed] [Google Scholar]
- Swadlow HA, Beloozerova IN, Sirota MG. Sharp, local synchrony among putative feed-forward inhibitory interneurons of rabbit somatosensory cortex. J Neurophysiol 79: 567–582, 1998 [DOI] [PubMed] [Google Scholar]
- Swadlow HA, Gusev AG. Receptive-field construction in cortical inhibitory interneurons. Nat Neurosci 5: 403–404, 2002 [DOI] [PubMed] [Google Scholar]
- Swadlow HA, Weyand TG. Corticogeniculate neurons, corticotectal neurons, and suspected interneurons in visual cortex of awake rabbits: receptive-field properties, axonal properties, and effects of EEG arousal. J Neurophysiol 57: 977–1001, 1987 [DOI] [PubMed] [Google Scholar]
- Wehr M, Zador AM. Synaptic mechanisms of forward suppression in rat auditory cortex. Neuron 47: 437–445, 2005 [DOI] [PubMed] [Google Scholar]
- Wilent WB, Contreras D. Dynamics of excitation and inhibition underlying stimulus selectivity in rat somatosensory cortex. Nat Neurosci 8: 1364–1370, 2005 [DOI] [PubMed] [Google Scholar]
- Woolsey CN, Settlage PH, Meyer DR, Sencer W, Pinto Hamuy T, Travis AM. Patterns of localization in precentral and “supplementary” motor areas and their relation to the concept of a premotor area. Res Publ Assoc Res Nerv Ment Dis 30: 238–264, 1952 [PubMed] [Google Scholar]
- Zarzecki P. The distribution of corticocortical, thalamocortical, and callosal inputs on identified motor cortex output neurons: mechanisms for their selective recruitment. Somatosens Mot Res 8: 313–325, 1991 [DOI] [PubMed] [Google Scholar]
- Zhu JJ, Connors BW. Intrinsic firing patterns and whisker-evoked synaptic responses of neurons in the rat barrel cortex. J Neurophysiol 81: 1171–1183, 1999 [DOI] [PubMed] [Google Scholar]