

Abstract
Understanding how sensory neurons transmit information about relevant stimuli remains a major goal in neuroscience. Of particular relevance are the roles of neural variability and spike timing in neural coding. Peripheral vestibular afferents display differential variability that is correlated with the importance of spike timing; regular afferents display little variability and use a timing code to transmit information about sensory input. Irregular afferents, conversely, display greater variability and instead use a rate code. We studied how central neurons within the vestibular nuclei integrate information from both afferent classes by recording from a group of neurons termed vestibular only (VO) that are known to make contributions to vestibulospinal reflexes and project to higher-order centers. We found that, although individual central neurons had sensitivities that were greater than or equal to those of individual afferents, they transmitted less information. In addition, their velocity detection thresholds were significantly greater than those of individual afferents. This is because VO neurons display greater variability, which is detrimental to information transmission and signal detection. Combining activities from multiple VO neurons increased information transmission. However, the information rates were still much lower than those of equivalent afferent populations. Furthermore, combining responses from multiple VO neurons led to lower velocity detection threshold values approaching those measured from behavior (∼2.5 vs. 0.5–1°/s). Our results suggest that the detailed time course of vestibular stimuli encoded by afferents is not transmitted by VO neurons. Instead, they suggest that higher vestibular pathways must integrate information from central vestibular neuron populations to give rise to behaviorally observed detection thresholds.
Keywords: vestibular neurons, neural variability, information processing, neural coding, population coding
understanding sensory processing remains an important goal in neuroscience that is complicated by the fact that neurons display variability in their responses to repeated presentations of a given stimulus (Dean 1981; Mainen and Sejnowski 1995; Tolhurst et al. 1983). This variability generally increases when going from peripheral to central brain areas (Gabbiani et al. 1996; Shadlen and Newsome 1998; Softky and Koch 1993), and its functional role has been a topic of intense debate and investigation in recent years (Stein et al. 2005): is it merely an unavoidable consequence of noise, or does it carry important information? Studies exploiting systems with well-characterized anatomy and physiology, such as the vestibular system, are required to yield significant insight into the function of variability in neural coding.
The vestibular system provides information about head motion relative to space that is necessary for maintaining posture, computing spatial orientation, and perceiving self-motion. Peripheral vestibular afferents respond to either angular or linear accelerations and are categorized as either regular or irregular based on their resting discharge variabilities (Baird et al. 1988; Fernandez et al. 1988; Goldberg 2000). Recent results have shown differential information coding for these two classes: regular afferents transmit detailed information about head rotations in part through precise spike timing, whereas irregular afferents tend to respond selectively to high-frequency features exclusively through changes in firing rate (fr) (Sadeghi et al. 2007a). Whereas anatomic studies report almost complete overlap in the terminal fields of regular and irregular afferents in each of the major subdivisions of the vestibular nuclei (Sato et al. 1989), the results of electrophysiological experiments suggest that individual central neurons in the vestibular nuclei can differ regarding the proportion of inputs they receive from regular vs. irregular afferents (Boyle et al. 1992; Goldberg et al. 1987). To date, however, the effects of neural variability and the putative contributions of each afferent class in determining information coding within vestibular nuclei are not known. Here, we addressed this question for the first time by studying the responses of vestibular-only (VO) neurons, which contribute to vestibulospinal reflexes as well as higher-order vestibular processing (reviewed in Angelaki and Cullen 2008), using signal detection and information theory, both of which take variability into account (Chacron et al. 2005b; Sadeghi et al. 2007a).
Our results show that VO neurons possess resting discharge variabilities that are even greater than those of afferents. This variability played a detrimental role in that individual VO neurons transmitted less information than individual afferents. Moreover, the detection thresholds from single VO neurons were an order of magnitude greater than those observed from behavior (Grabherr et al. 2008). Previous studies have shown that combining multiple neurons can average away variability and therefore improve information transmission and signal detection (reviewed in Stein et al. 2005).
We found that combining the activities of VO neurons led to large improvements (>300%) in information transmission. Surprisingly, however, the information rates obtained were still lower than those obtained by pooling afferents (∼50 bits/s vs. ∼110 bits/s). Moreover, pooling VO neurons led to lower detection thresholds values that approached but did not reach those seen from behavior (∼2.5 vs. 0.5–1°/s). Together, these findings suggest that higher vestibular pathways must integrate inputs from a large (∼40) pool of central vestibular neurons to fully recover the information that is transmitted by afferents and potentially explain the organism's behavioral performance.
MATERIALS AND METHODS
Three macaque monkeys (2 Macaca mulatta and 1 M. fascicularis) were prepared for chronic extracellular recording using aseptic surgical techniques. All procedures were approved by the McGill University Animal Care Committee and were in compliance with the guidelines of the Canadian Council on Animal Care.
Surgical preparation.
Animals were initially given glycopyrrolate (0.005 mg/kg im) to stabilize heart rate and reduce salivation and were then preanesthetized using ketamine hydrochloride (12–15 mg/kg im), diazepam (1 mg/kg im), and buprenorphine (0.01 mg/kg im). Surgical levels of anesthesia were induced using 2–3% isoflurane gas, inhaled through an endotracheal tube, and were then maintained at 0.8–1.5%. During the surgery, a dental acrylic implant was fastened to each animal's skull using stainless steel screws. A stainless steel post was embedded within the implant to restrain the animal's head during the experiment, and two stainless steel recording chambers were positioned stereotaxically on the skull to allow recording from 1) the vestibular nerve where it emerges from the internal auditory meatus, and 2) the vestibular nuclei. Immediately following the surgery, the animals were administered buprenorphine (0.01 mg/kg im) for postoperative analgesia and the antibiotic cefazolin (Ancef; 25 mg/kg im for 5 days). Animals were given ≥2 wk to recover from the surgery before experiments began. Additional details regarding the surgical preparation can be found in Sadeghi et al. (2006) and Sylvestre and Cullen (1999).
Data acquisition.
The experimental setup and methods of data acquisition have been previously described for both vestibular afferents (Cullen and Minor 2002; Sadeghi et al. 2007a,b) and vestibular nuclei neurons (Roy and Cullen 2004). During experimental sessions, the monkey was comfortably seated in a primate chair mounted on a vestibular turntable (Fig. 1A). The animal's head was completely restrained using a custom head holder (Roy and Cullen 2001). Eye movements were recorded using the magnetic search coil technique (CNC Engineering), and turntable velocity was measured using an angular velocity sensor (Watson) positioned on the monkey's head post. Gaze position and table velocity were collected using the QNX-based real-time data acquisition system REX, sampled at 1 kHz, low-pass-filtered at 250 Hz (analog 8-pole Bessel filter), and stored to digital audiotape for subsequent playback.
Fig. 1.
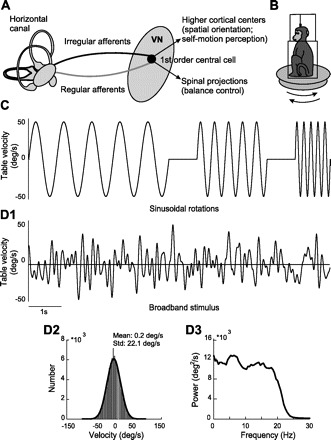
Experimental setup and stimuli used. A: general description of the vestibular system. Vestibular information is transmitted from the sensory end-organs through 2 types of afferents (regular and irregular) and converges on 1st order central cells in the vestibular nuclei (VN), which then project to other centers. B: during the experiment, the monkey was comfortably seated in a chair placed on a turntable. C: examples of horizontal sinusoidal stimuli for different frequencies (1, 2, and 4 Hz reaching 50°/s peak velocity). D1: an example time series of the broadband (0–20 Hz) noise stimulus used to further characterize neuronal responses. D2: velocities were distributed normally with 0 mean and 20°/s SD (Std.). D3: the power spectrum of the noise stimulus had relative constant power for frequencies up to 20 Hz.
In this study, we made recordings from two classes of cells: 1) vestibular afferents that innervate the horizontal semicircular canals, and 2) a group of neurons in the medial vestibular nuclei, termed VO neurons. The extracellular single-unit activity of vestibular afferents was measured using glass microelectrodes (24–27 MΩ), and recording depth was controlled using a precision hydraulic microdrive (Narishige, Tokyo, Japan). The vestibular nerve was approached through the floccular lobe of the cerebellum, as identified by its eye-movement-related activity (Cullen and Minor 2002; Lisberger and Pavelko 1986). Entry to the nerve was preceded by a silence, indicating that the electrode had left the cerebellum. The extracellular single-unit activity of neurons in the vestibular nuclei was recorded with enamel-insulated tungsten microelectrodes (3–7 MΩ), the depths of which were controlled as during afferent recording. The location of the vestibular nuclei was determined relative to the abducens nuclei (Sylvestre and Cullen 1999). Central vestibular neurons were carefully characterized based on their stereotypical discharge patterns during head rotations and eye movements (Roy and Cullen 2004).
Action potentials from extracellular recordings were discriminated using a windowing circuit (BAK Electronics); Schmitt trigger levels and window size were manually set and monitored throughout playback sessions to check carefully the isolation of each unit. Spike trains were digitized at 1 kHz and imported into MATLAB (MathWorks, Natick, MA) along with the recorded gaze position and table velocity signals (see above) to be analyzed with custom-written algorithms.
Experimental design.
Horizontal semicircular canal afferents and VO neurons of the medial vestibular nuclei are modulated in response to horizontal vestibular stimulation but are insensitive to eye movements (Cullen and McCrea 1993; Goldberg 2000; McCrea et al. 1999; Roy and Cullen 2001, 2004; Sadeghi et al. 2007b; Scudder and Fuchs 1992). To confirm that each neuron in our sample discharged in a manner consistent with previous analyses, responses were characterized during voluntary eye movements and passive whole body rotations. Monkeys were trained to track a small visual target (HeNe Laser) projected onto a white cylindrical screen located 60 cm away from the head for a juice reward. Both afferents and VO cells were unresponsive to saccadic eye movements, smooth pursuit, and ocular fixation made to track the target. Rotation about an earth vertical axis (1 Hz, 50°/s peak velocity) either in the dark [vestibuloocular reflex (VOR)] or when fixating a target that moved with the vestibular turntable (VOR cancellation) led to comparable responses in afferents as well as VO neurons.
We then used 2 types of head-velocity stimuli to further characterize the responses of vestibular afferents and central neurons. The 1st type consisted of single-frequency sinusoidal rotations at frequencies of 0.6–16 Hz (0.6, 1, 2, 4, 8, and 16 Hz, 50°/s peak velocity). At least 10 cycles of stimulation were applied for each frequency. Second, we applied broadband noise stimuli characterized by a Gaussian distribution of rotational velocities with 0 mean and 20°/s SD that was low-pass-filtered at 20 Hz. The acceleration profile of this stimulus had a Gaussian distribution with 0 mean and 2,000°/s2 SD. We note that vestibular afferents and VO neurons have relatively high resting rates (∼60–100 spikes/s). As done previously (Sadeghi et al. 2007a), all stimuli were designed to give rises to modulations in fr around the resting value that did not elicit static nonlinearities such as saturation and rectification. These noise stimuli lasted for 80 s and were presented only once to each neuron. This stimulus was repeated up to 3 times for n = 14 VO neurons, n = 9 regular afferents, and n = 13 irregular afferents. The power spectrum of the resultant stimulus was constant up to 20 Hz (Fig. 1D).
Analysis of background activity.
Regularity of resting discharge of vestibular neurons was measured by their coefficient of variation (CV). The distribution of interspike intervals (ISIs) was recorded during spontaneous background activity, and CV was calculated from the mean (μ) and standard deviation (σ) of this distribution (CV = σ/μ). Since CV varies with the mean ISI, we used the normalized measure CV* (Goldberg et al. 1984) to classify vestibular neurons, which is defined by:
| (1) |
where it is assumed that μ is in seconds. Although this measure was initially developed to remove the dependence of CV on the resting rate for otolith afferents, it can also be applied to canal afferents (Goldberg et al. 1984). Furthermore, as shown in Fig. 2, the application of this measure to VO neurons resulted in a CV* that was not correlated with the resting rate, and thus this measure allowed us to study the influence of variability on sensory coding, independently of the expected (“trivial”) increase that follows increases in fr. Vestibular afferents with a CV* < 0.15 were classified as regular, whereas those with a CV* > 0.15 were classified as irregular as done previously (Haque et al. 2004; Sadeghi et al. 2007a,b).
Fig. 2.

The coefficient of variation (CV) decreases as a function of the resting discharge rate for vestibular only (VO) neurons. A: CV as a function of the resting discharge rate. Both VO neurons and irregular afferents showed a negative correlation of their CV with the resting firing rate. B: the normalized coefficient of variation (CV*) does not show any significant correlation with resting discharge rate.
Traditional linear system analysis.
For sinusoidal stimuli s(t), the spike train was convolved with a Kaiser window with cutoff frequency 0.1 Hz above the stimulus frequency to obtain a measure of the time-dependent fr [fmeasured(t)] (Cherif et al. 2008; Oppenheim and Schafer 1989). The response gain was then computed by fitting a first order model to the data. The model assumes that the time-dependent fr is given by festimated(t) = b + g·s(t − td), where the parameter b stands for the bias, g, the gain, and td, the latency, respectively. We used a least-squares regression to find the parameter values that provide the maximum variance accounted for (VAF) (Sadeghi et al. 2007b). A minimum of 10 cycles were included in the fit, and the VAF was computed as:
| (2) |
where var is the variance, and fmeasured(t) represents the actual fr (Roy and Cullen 2001; Sylvestre and Cullen 1999).
For noise stimuli, the spike train from neuron i was converted into a binary sequence ri(t) with binwidth 1 ms. The value of bin j was set to 1 if it contained an action potential and 0 otherwise as previously described (Sadeghi et al. 2007a). The stimulus s(t) was also sampled with time step 1 ms. The response gain was computed from G(f) = Psr(f)/Pss(f) where |Psr(f)| is the cross-spectrum between the stimulus s(t) and binary sequence r(t), and Pss(f) is the power spectrum of the stimulus s(t).
Stimulus reconstruction and mutual information estimates.
We used the stimulus reconstruction technique to estimate the time-varying stimulus from a population of n neurons using their spike trains ri(t) (the index i refers to the ith neuron) recorded during broadband noise vestibular stimulation. This approach assumes that the time-dependent stimulus can be estimated by convolving each spike train ri(t) with a separate kernel Ki(t) and then summing the respective contributions (Dan et al. 1998; Krahe et al. 2002; Warland et al. 1997):
| (3) |
The optimal set of kernels Ki(τ) {i.e., that which minimizes the mean-square error ε2 = <[s(t) − sest(t)]2>} is a solution to the following system of equations (Dayan and Abbott 2001):
| (4) |
where
is the Fourier transform of Ki(t), and Prirj(f) is the cross-spectrum between binary sequences ri(t) and rj(t). We note that the optimal filter can be non-0 for both negative and positive times. We assessed the quality of linear stimulus reconstruction by computing the coding fraction as follows (Gabbiani 1996; Rieke et al. 1996):
, where σ is the standard deviation of the stimulus s(t). The CF ranges between 0 and 1 and represents the fraction of the stimulus that is correctly estimated.
It is often assumed that the fact that the optimal filter is nonzero for positive times implies that it is noncausal because the occurrence of a spike can be then used to predict the future temporal dynamics of the stimulus (Bialek and Rieke 1991; Rieke et al. 1996; Theunissen et al. 1996). A standard procedure to correct for this is to set all values of the filter for positive time to zero. However, nonzero values for the filter at positive times do not necessarily imply that it violates temporal causality and may simply reflect the fact that the neural responses lead the input. This is the case here as both peripheral and central vestibular neuronal responses have been previously shown to lead the head velocity input during steady state (Goldberg 2000; Goldberg and Fernandez 1971b; Hullar et al. 2005; Sadeghi et al. 2007a,b). We corrected for this by taking population-averaged time delay between each group's response and the head velocity stimulus and setting the filter values at times greater than this delay to zero. As such, not all values of the filter for positive times were set to zero, merely those greater than the delay. Recomputing the CF as defined above using this filter did not qualitatively affect the nature of our results as it led to only small decreases in the CF estimates (<5%; data not shown).
We then used the indirect method to compute a lower bound on the mutual information (MI) transmitted by neurons (n) about a time-varying stimulus [s(t)] (Borst and Theunissen 1999). The noise in the reconstruction was defined as n(t) = s(t) − sest(t), and a signal-to-noise ratio was defined as SNRlower(f) = Pss(f)/Pnn(f). Here, Pss(f) is the power spectrum of the stimulus s(t), and Pnn(f) is the power spectrum of the noise n(t). We note that this methodology assumes that the noise n(t) obeys a Gaussian probability distribution with zero mean. We have verified that this was the case for all the neurons in our dataset, and an example is shown in Supplemental Fig. S1A (available in the data supplement online at the Journal of Neurophysiology web site). Specifically, we quantified the goodness of fit by computing the mean square error between the probability distribution of n(t) and the Gaussian fit normalized by the maximum probability for each individual neuron. We obtained 3.3 ± 0.1% for VO neurons, 4.3 ± 0.3% for regular afferents, and 3.3 ± 0.2% for irregular afferents. The lower-bound MI rate density is then given by MIlower(f) = log2[1 + SNRlower(f)] and is expressed in bits (Borst and Theunissen 1999). The MI rate is obtained by integrating the MI density up to 20 Hz and is expressed in bits per second. We note that we can simply integrate the MI density across frequency because the noise stimuli used in this study have a Gaussian probability distribution and are stationary and that the indirect method assumes a linear decoder for which there can be no interactions among different frequencies (Rieke et al. 1996). For n = 1, the expression for the MI rate density used here is equal to the one used in previous studies (Chacron et al. 2003; Rieke et al. 1996; Sadeghi et al. 2007a). For n = 1, we divided the MIlower(f) density by the mean fr of the neuron during stimulation to account for the fact that the MI rate density increases with fr (Borst and Haag 2001). This normalized MI rate density is then expressed in bits per spike per Hertz, and the corresponding normalized MI rate is expressed in bits per spike. Intuitively, X bits of information means that the system can discriminate between 2X stimuli (Shannon 1948). As such, information theory is related to signal detection theory (Green and Swets 1966), which has been used previously to characterize the responses of vestibular neurons to sensory input (Gu et al. 2007, 2008; Liu et al. 2010). We note that the calculation of the lower bound on the information rate density can be obtained from the response to a segment of unrepeated Gaussian noise as was done previously (Bialek and Rieke 1991; Chacron et al. 2004; Clague et al. 1997; Gabbiani 1996; Metzner et al. 1998; Roddey and Jacobs 1996; Sadeghi et al. 2007a; Theunissen et al. 1996; Wessel et al. 1996).
To compute the MI, we actually convolved each spike train with a separate optimal filter and then summed the contributions of each neuron to obtain a lower bound on the MI rate as was done previously (Dan et al. 1998; Krahe et al. 2002; Warland et al. 1997). We thus considered a “labeled-line” code in our calculations (i.e., we took into account which neurons fired which spikes) as described previously (Panzeri et al. 2003; Reich et al. 2001). Note that if we had instead first summed the activities of multiple neurons and then convolved with the optimal filter to obtain an estimate of MI, then this estimate would be lower than the one that was obtained here and would be considered a “summed-population” code (Panzeri et al. 2003; Reich et al. 2001). We considered a labeled-line code here as our goal is to get an estimate of the largest amount of information that could be decoded by higher centers.
We note that the indirect method used here provides a lower bound on the MI rate and is exact when the neurons are in the linear regime (Borst and Theunissen 1999). Although we expect that this method will yield a reliable estimate of the MI as all our neurons displayed large spontaneous activity and our stimuli led to smooth modulations of these fr, we specifically tested this by computing an upper bound on the MI rate in the following way for single neurons. We first quantified the variability in the neural response r(t) to repeated presentations of the same stimulus s(t) using the response-response coherence CRR(f). Specifically, let R1, R2, and R3 be the responses obtained from three presentations of the stimulus s(t). We assume that Ri(t) = <R(t)> + ni(t) and can now define the signal-to-noise ratio as SNRupper(f) = P<R><R>(f)/Pnn(f), where P<R><R>(f) is the power spectrum of the average response <R(t)>. The upper bound on the MI rate is then given by MIupper(f) = log2[1 + SNRupper(f)] (Borst and Theunissen 1999; Haag and Borst 1998; Passaglia and Troy 2004). Equivalently, one can compute the coherence between the responses (Ri) obtained when presenting the same stimulus s(t) and obtain the upper bound on the MI rate density as (Chacron 2006; Krahe et al. 2008; Marsat and Pollack 2004, 2005; Middleton et al. 2009):
| (5) |
with CRR(f) defined as (Roddey et al. 2000):
| (6) |
where is the cross-spectrum between responses Ri and Rj. Moreover, the average < … >x is over index x, and the average < … >i,j is over all possible combinations of i and j such that j < i. Previous studies have shown that the response-response coherence is a number between zero and one that measures the strength to which the responses obtained to repeated presentations of the same stimulus are correlated at frequency (f) (Roddey et al. 2000). In practice, we computed the response-response coherence using:
| (7) |
Intuitively, any trial-to-trial variability in the neural response to repeated presentations of the same stimulus will decrease CRR(f). Previous studies have shown that CRR(f)1/2 measures the maximum possible fraction of the response at f that can be accurately reproduced using an optimal encoding model, which is in general nonlinear (Roddey et al. 2000). It is thus not surprising that the CRR(f)1/2 is related to an upper bound on the MI rate density as it is only limited by trial-to-trial variability in the response. We note that the upper-bound calculation assumes that the noise ni(t) are normally distributed (Borst and Theunissen 1999). We have verified that this is the case for our dataset by fitting a Gaussian distribution with zero mean (Supplemental Fig. S1B). Specifically, we quantified the goodness of fit by computing the mean square error between the probability distribution of ni(t) and the Gaussian fit normalized by the maximum probability for each individual neuron. We obtained 3.7 ± 0.4% for VO neurons, 4.0 ± 0.2% for regular afferents, and 4.5 ± 0.4% for irregular afferents. Additionally, we found that the mean fr and its variance showed little correlation for VO neurons (r = 0.2 ± 0.06) as well as regular (r = 0.03 ± 0.05) and irregular (r = 0.06 ± 0.05) afferents. We also divided the upper-bound estimate on the MI rate by the mean fr during stimulation and compared the two estimates of the MI density for single neurons in our dataset. We note that studies in other systems have used more direct methods to estimate the MI without making assumptions on the nature of the decoder (Belitski et al. 2008; Chacron 2006; Passaglia and Troy 2004; Reinagel and Reid 2000). However, these calculations require quantities of data that exceed those that can currently be obtained from isolated single vestibular neurons during the physical movement that was produced by the broadband noise stimuli used in the present study. This is because our noise stimuli produced high-frequency shaking head movements, which in turn resulted in small displacements of the brainstem relative to the microelectrode tip. Thus it was considerably more difficult to maintain neuronal isolation during broadband noise stimulation than during stimulation with the lower frequency sinusoidal stimuli (<5 Hz) that are typically employed. Finally, other methods assume that information is contained in the time-dependent fr (Brenner et al. 2000). The time-dependent fr is computed using the peristimulus time histogram in response to a time-varying stimulus, which is obtained by averaging over multiple stimulus presentations. As such, this estimate of information is based on the strength of modulation of the fr caused by the stimulus and is not appropriate here as we are trying to determine the effects of variability on information transmission. In contrast, the lower- and upper-bound measures are based on the signal-to-noise ratio, and both take variability into account.
All spectral quantities (i.e., power-spectra, cross-spectra) were estimated using a multitaper technique with eight Slepian functions (Jarvis and Mitra 2001). These are merely used to lower the variance in our estimates of the spectral quantities used in the calculation of MI and will not introduce a bias in our estimates as used here (data not shown). Note that the long stimulus duration (80 s) gives rise to negligible bias in the estimates of all spectral quantities used to compute the lower and upper bounds on the MI density as in previous studies (Chacron 2006; Sadeghi et al. 2007a; Wessel et al. 1996).
We also computed the CF and MI by using the head acceleration signal rather than the head velocity signal as an input. The head acceleration signal was obtained by differentiating the head velocity signal and was used in the algorithms described above. Because differentiation is a linear transformation, we did not expect that the estimates obtained using acceleration would differ significantly from those obtained with velocity (Machens et al. 2001). Indeed, this was the case for our dataset (data not shown).
Jitter analysis.
To assess the presence of a temporal code in the neural response, we added random spike-timing jitter to the spike trains (Jones et al. 2004; Kreiman et al. 2000; Sadeghi et al. 2007a). Jitter that was drawn from a Gaussian distribution with zero mean and 2-ms SD was added to each spike time. Note that the jitter time scale of 2 ms is much smaller than the stimulus time scale of 50 ms and is thus not expected to affect the coding of information at time scales over which the stimulus varies significantly (i.e., at frequencies contained within the stimulus) (Dayan and Abbott 2001; Jones et al. 2004; Sadeghi et al. 2007b). We note, however, that addition of spike-timing jitter can affect coding at time scales significantly greater than those contained in the jitter (Jones et al. 2004; Sadeghi et al. 2007b). In fact, addition of jitter with a time scale of 5 ms led to a significant decrease in gain for both afferents and VO neurons (data not shown).
Detection thresholds.
fr Estimates were plotted as a function of the shifted stimulus s(t) to obtain instantaneous fr-head velocity curves. We then computed the mean and variance of the fr distribution for each head velocity using a binwidth of 1°/s. The degree of overlap between the fr distribution obtained for a given head velocity and that obtained for 0 velocity was quantified using ROC analysis (Green and Swets 1966). The velocity detection threshold was defined as the minimum value of head velocity that gave rise to a probability of correct detection equal to 76%. This calculation was performed for responses to sinusoidal stimulation at different frequencies (Sadeghi et al. 2007a). We also computed the velocity threshold for discriminating between 8- and 16-Hz sinusoidal rotations in the same manner as described above except that the fr distribution for a given value of head velocity for 8-Hz stimulation was compared with that obtained for the same value of head velocity for 16-Hz stimulation. As we developed our experimental paradigms to quantify steady-state vestibular neuron responses to time-varying stimuli, our approach was not designed to quantify differences between the steady-state and transient responses.
Population detection thresholds.
We computed the velocity detection threshold from n neurons responding to the same sinusoidal stimuli with a given f in the following way. First, we corrected for phases differences between the responses of individual neurons and aligned all spike trains such that they were in phase with the stimulus. Second, the population activity was computed as the sum of all individual spike trains. This population activity was convolved with a Kaiser window with cutoff frequency 0.1 Hz above the stimulus frequency to obtain an estimate of the population fr (Cherif et al. 2008). This estimate was used to compute the velocity detection threshold as described above. Our final estimate of the population detection threshold was averaged over ≤500 combinations of neurons from our dataset.
To quantify the effects of aligning the spike trains such that they were all in phase with the stimulus, we also computed the population detection thresholds by shifting all the responses of a given neuron group (i.e., of VO, regular afferent, or irregular afferent) by the population-averaged mean time delay between that neuron group response and the head velocity stimulus. We note that, unlike the first method, this preserves the temporal relationship between the spike trains of a given neuron group (i.e., of VO, regular afferent, or irregular afferent) as they are shifted by the same time value. The detection thresholds computed from this method did not differ significantly from those computed with the previous method for a given dataset (data not shown).
RESULTS
We recorded from 23 horizontal canal afferents and 21 VO neurons from 3 macaque monkeys. Ten afferents were classified as regular and the remaining 13 as irregular using previously established criteria (Sadeghi et al. 2007a).
Analysis of spontaneous activity.
VO neurons displayed spontaneous activity that was quite variable (mean fr = 56.2 ± 5.5 spikes/s; CV* = 0.53 ± 0.05). The ISI distribution from a representative example cell is shown in Fig. 3A and displayed greater variance than the ISI distributions from example regular (Fig. 3B) and irregular (Fig. 3C) afferents. We also quantified the spontaneous activity of VO neurons by computing the spike train power spectrum, which was relatively independent of frequency: this is indicative of the firing statistics being close to Poisson (Holden 1976; Cox and Lewis 1966) (Fig. 3D). For comparison, representative power spectra of regular and irregular afferents are also shown (Fig. 3D). Whereas the regular afferent displayed peaks in the power spectrum at its firing frequency (∼100 Hz) as well as at integer multiples of this frequency (i.e., higher harmonics), the irregular afferent displayed considerably less structure consisting of a broad and shallow peak at its firing frequency (∼110 Hz). On average, VO neurons displayed significantly lower fr than both regular and irregular afferents (Fig. 3E; VO vs. regular, P < 10−3; VO vs. irregular, P < 10−5; t-tests) and significantly larger spike train variability as quantified by CV* (Fig. 3F; VO vs. regular, P < 10−5; VO vs. irregular, P < 10−3; Wilcoxon rank sum tests).
Fig. 3.

Spontaneous activity of a typical VO neuron compared with that of vestibular afferents. A: interspike interval (ISI) histogram from a typical VO neuron (CV*VO = 0.43). B and C: ISI histograms from typical regular and irregular afferents, respectively (CV*reg = 0.04 and CV*irreg = 0.3). D: spike train power spectra for the same example VO neuron and afferents. E: resting discharge rates for VO neurons and afferents. F: box plots of the CV* of the population of VO neurons and afferents. VO neurons were significantly more irregular than either group of afferents. **Statistical significance using a t-test at the P < 0.01 level. spk, Spikes.
Most importantly, VO neurons displayed higher power in their baseline activities than both irregular and regular afferents in the temporal frequency range corresponding to natural head rotations of 0–20 Hz (Huterer and Cullen 2002) (Fig. 3D, shaded area). This is primarily due to their higher resting discharge variability as quantified by CV* (Cox and Lewis 1966) and has important consequences for information transmission. Notably, sensory stimuli must perturb the resting discharge activity to be perceived by the organism, and a more variable resting discharge will make such a distinction more difficult (Chacron et al. 2001, 2005b; Sadeghi et al. 2007a). The theoretical implications of this finding are that the spike train power spectrum of the spontaneous activity can be seen as a “noise spectrum” that influences the amount of noise at each frequency during stimulation. Lower noise over specific frequency ranges will give rise to higher signal-to-noise ratios and thus better information transmission (Chacron et al. 2005a,b). We thus next investigated the responses of VO neurons to sensory stimulation with frequencies up to 20 Hz.
Responses of VO neurons to sinusoidal head rotations.
We first used traditional linear system identification measures of gain and phase to quantify VO neuron responses to sinusoidal head rotations ranging in frequency from 0.6 to 16 Hz. Overall, the population-averaged gains or sensitivities of VO neurons increased with frequency (Fig. 4A). The phase lead between the neuronal firing and head velocity stimulation also increased as a function of frequency (Fig. 4B). For comparison, population-averaged gain and phase curves are shown for both regular and irregular afferents. The frequency-dependent change in sensitivity of VO neurons was significantly greater than that of regular afferents [VO vs. regular, P = 0.007, t-test, degrees of freedom (df) = 18] but was similar to that of irregular afferents (P = 0.2, t-test, df = 18; Fig. 4A). VO neurons also displayed increasing phase leads that were greater than those of regular afferents but similar to those of irregular afferents (Fig. 4B; VO vs. regular, P = 0.04; VO vs. irregular, P = 0.18, t-tests; df = 18 in both cases).
Fig. 4.

Population-averaged gains and phases as a function of frequency for VO neurons in response to sinusoidal stimulation. A: comparison of population-averaged gains of VO neurons and afferents obtained during sinusoidal horizontal rotations. Note that VO neuronal gains increased as a function of frequency in a manner that mirrored the frequency dependence of irregular afferents. As a result, the gains of both groups of cells were comparable at 16 Hz. B: population-averaged phases of VO neurons and afferents to sinusoidal horizontal rotations. The error bars show 1 SE. ** And * indicate statistically significant differences between cell groups at 16 Hz using a t-test at the P = 0.01 and 0.05 levels, respectively.
Reconstructing time-varying stimuli from VO neural activity.
Central neuron responses to vestibular input have been traditionally characterized by estimating the gain and phase over several cycles of sinusoidal head rotation using the linear system identification approach described above. However, a limitation of this approach is that it averages response variability to obtain robust estimates (Chacron et al. 2005b; Sadeghi et al. 2007a). To ascertain whether the variability displayed by VO neurons influences their capacity to transmit information, we used information theoretic analysis (Borst and Theunissen 1999; Rieke et al. 1996; Sadeghi et al. 2007a). Specifically, we used the stimulus reconstruction technique to reconstruct the time-varying profiles of random head rotations from the spike train of a given VO neuron using an optimal linear filter (Dayan and Abbott 2001; Gabbiani and Koch 1998; Rieke et al. 1996).
A representative example is shown in Fig. 5A. The stimulus reconstruction from this VO neuron was poor as quantified by a low CF of 0.25 (the CF is simply the fraction of the stimulus that is correctly reconstructed; Fig. 5A). The optimal reconstruction filter, which was convolved with the spike train to obtain the reconstructed stimulus, is also shown (Fig. 5A, inset) and is qualitatively similar to that obtained for irregular afferents (compare with Fig. 2B of Sadeghi et al. 2007b). This filter was biphasic and has a strong oscillatory component. On average, VO neurons displayed lower CF than both regular (VO vs. regular, P < 10−4, Wilcoxon rank sum test; df = 30) and irregular afferents (P < 10−4, Wilcoxon rank sum test; df = 33; Fig. 5B, inset).
Fig. 5.

VO neurons display poor stimulus reconstruction. A: table velocity (gray) and reconstructed table velocity (dashed black) for a typical VO neuron. The spike train and the time-dependent firing rate in response to this stimulus are also shown at the bottom. This example neuron displayed a poor coding fraction (CF) of 0.25 indicating that, on average, only 25% of the stimulus could be reconstructed. The inset shows the optimal filter waveform that was convolved with the spike train to maximally reconstruct the table velocity. B: CF of VO neurons and afferents as a function of CV*. We found a significant negative correlation (r = −0.67, P < 10−4; n = 43), which implies that increasing resting discharge variability is detrimental to stimulus reconstruction. The inset shows the population-averaged CF of the VO neurons and the afferents. The vertical bars shows 1 SE. Comparison with average afferent responses revealed that VO neurons displayed lower CF than both regular (Reg) and irregular (Irreg) afferents (**statistical significance at the P < 0.01 level using a Wilcoxon rank sum test). C: CF of VO neurons and afferents plotted as a function of mean resting discharge. We found a significant positive correlation (r = 0.57, P < 10−4; n = 43) indicating that higher resting discharge is beneficial to stimulus reconstruction.
We found a negative correlation between CV* computed from the resting discharge and the CF over our sample of VO neurons and afferents (Fig. 5B; r = 0.67, P < 10−4; n = 43). Furthermore, we found a positive correlation between the CF and the spontaneous fr (Fig. 5C; r = 0.57, P < 10−4; n = 43) indicating that the lower fr and higher resting discharge variability as quantified by CV* of VO neurons were detrimental to their ability to encode time-varying head rotations. Finally, we computed the correlation between CF and CV. As expected, this correlation was stronger (r = 0.71 vs. 0.67 with probability of no correlation P < 0.01) in magnitude than the correlation between CF and CV*. This is because of the strong correlation between CF and fr. By plotting CF as a function of CV* (Fig. 5B), we effectively removed the effects of differences between the fr of afferents and VO neurons such that we can conclude that between-population differences in CF are not due to differences in fr. We note that the correlation between CF and CV* for each neuron group were not significant (VO: r = −0.08, P = 0.75; regular: r = 0.40, P = 0.25; irregular: r = 0.20, P = 0.52). Therefore, the differences in CF seen across all three neuron groups may be due to between-population parameters other than the resting discharge variability as quantified by CV*.
Information transmission by individual VO neurons is lower than that of afferents.
The stimulus reconstruction technique takes into account all frequency components of the stimulus and thus does not necessarily quantify the ability of a neuron to selectively encode individual frequency components. Therefore, we next computed the MI density between the neuronal spike train and the applied head rotation stimulus as a function of temporal frequency (Borst and Theunissen 1999). We computed both lower and upper bounds on the MI density and found that these had similar shapes as a function of frequency for VO neurons (Fig. 6A). Moreover, both the lower and upper bounds had a frequency dependence similar to that of response gain: this indicates that the higher values of sensitivity observed at higher frequencies give rise to higher values of information density. Overall, both VO neurons and irregular afferents displayed similar MI density curves (compare with Fig. 4B of Sadeghi et al. 2007b).
Fig. 6.

VO neurons display lower information rates than afferents. A: population-averaged gains (dashed) as well as lower (blue) and upper (red) mutual information (MI) density curves as a function of frequency for VO neurons. The gray bands show 1 SE. Note that, since the upper bound is by definition always higher than or equal to the lower bound for each individual neuron, the fact that the population-averaged curves were close to one another implies that they must also be close for most individual VO neurons. B: population-averaged lower-bound estimates of the MI rate (bits per second) for VO neurons and afferents. C: population-averaged lower-bound estimates of the MI rate normalized by the mean firing rate (bits per spike) for VO neurons and afferents. This normalization accounts for the dependence of MI on the firing rate (see text for explanation). D: population-averaged upper-bound estimates of the MI rate (bits per second) for VO neurons and afferents. E: population-averaged upper-bound estimates of the MI rate normalized by the mean firing rate (bits per spike) for VO neurons and afferents. ** And * indicate statistical significance using a t-test at the P = 0.01 and 0.05 levels, respectively.
We note that the information density curve is related to the Fourier transform of the reconstruction filter shown in Fig. 5A (Rieke et al. 1996; Theunissen et al. 1996). In particular, the biphasic nature of the filter in the time domain gives rise to a low information density for low frequencies, and the strong oscillatory component in the time domain gives rise to a high information density at high frequencies. Overall, VO neurons displayed lower-bound estimates of the MI that were lower than that of regular (P < 10−5, t-test, df = 21) or irregular afferents (P < 10−6, t-test, df = 25; Fig. 6B). As the MI has been shown to increase with fr (Borst and Haag 2001), we normalized the lower-bound estimates of the MI of VO neurons and afferents by their fr during stimulation to remove any effects due to differences in firing frequency. We found that VO neurons still had lower normalized lower-bound estimates of the MI than those of regular (P < 10−6, t-test, df = 21) and irregular afferents (P < 10−3, t-test, df = 25; Fig. 6C). Moreover, VO neurons displayed upper-bound estimates of the MI that were lower than that of regular (P < 10−4, t-test, df = 21) or irregular afferents (P < 10−3, t-test, df = 25; Fig. 6D). Normalizing the upper-bound estimates of the MI by the fr during stimulation preserved this difference as the normalized upper bound of the MI of VO neurons was still significantly lower than the normalized upper bound of either regular (P < 10−4, t-test, df = 21) or irregular (P = 0.03, t-test, df = 25) afferents (Fig. 6E). We conclude that the lower information rates displayed by VO neurons are not simply a consequence of their lower fr or of the methodology that we used to compute information rates. Rather, these are at least partly caused by the higher variability displayed by VO neurons compared with irregular and regular afferents.
Contributions of spike timing to information processing by central vestibular neurons.
It was recently shown that the precise spike timing of regular afferents carries information about head velocity (Sadeghi et al. 2007b). We therefore investigated whether central VO neurons also transmit information through precise spike timing by applying spike-timing jitter (Jones et al. 2004; Kreiman et al. 2000). Jitter drawn from a Gaussian distribution with zero mean and 2-ms SD (Fig. 7A) was added to each spike time (Fig. 7B). The time scale of the jitter introduced was much smaller than that of the stimulus (50 ms) and thus theoretically should not perturb the encoding of information by the time-dependent fr (Theunissen and Miller 1995). This was confirmed by plotting the population-averaged gain curves as a function of frequency with and without jitter (Fig. 7C): jitter had minimal effect on the gain even at the highest frequencies. Similarly, our results show that addition of jitter had minimal effect on the information density (Fig. 7D). Addition of jitter also had minimal effects on stimulus reconstruction (Fig. 7B).
Fig. 7.
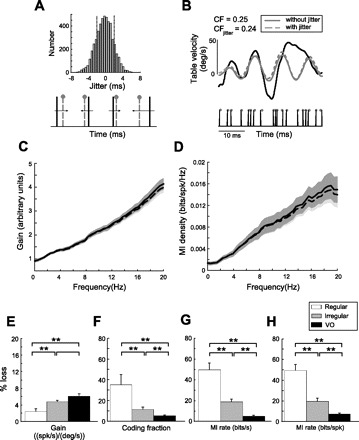
Effects of spike-timing jitter on the gain and MI density of VO neurons. A: a random number drawn from a normal distribution centered at 0 ms with a SD of 2 ms was added to the time of each spike. B: example reconstruction of the velocity input (gray) from the original spike train before (black) and after (red) addition of 2-ms jitter. Addition of jitter had minimal effect on the CF. C and D: gain and MI curves with (dashed) and without (solid) addition of 2-ms jitter. Light and dark gray bands indicate 1 SE for the curves with and without jitter, respectively. E: population-averaged gain loss (percentage) of VO neurons and afferents after the addition of jitter was negligible in all cases. F–H: population-averaged percentage loss of CF, MI (bits per second), and MI per spike (bits per spike) values of VO neurons and afferents resulting from the addition of jitter, respectively. For all 3 measures, VO neurons showed significantly less percentage loss than both regular and irregular afferents. **Statistical significance at the P = 0.01 level using a t-test.
We quantified these results by computing the fractional information loss caused by adding jitter to the spike trains of VO neurons. Furthermore, we also computed this loss for regular and irregular afferents that were recorded during identical stimulation for comparison. Although all three groups showed minimal losses in gain contingent on addition of jitter (Fig. 7E), VO neurons displayed percentage losses in CF (Fig. 7F) and lower-bound estimates of the MI (Fig. 7G) that were smaller (∼6%) than those displayed by regular (∼50%) and irregular afferents (∼20%) using this approach. This was also seen when we normalized the lower-bound estimate of the MI by fr (Fig. 7H), hence this effect was not due to the larger fr displayed by afferents. Although these changes were statistically significant (P < 10−3, paired t-test, df = 24), we note that their magnitude was minimal for VO neurons (<10% in all cases) and furthermore significantly less than those observed for afferents. We also computed the loss in the upper-bound estimate of the MI brought about by jittering the spike times. We found that the loss in information was not significantly different than that obtained for the lower-bound estimate for regular (P = 0.9, t-test, df = 14), irregular (P = 0.9, t-test, df = 20), or VO neurons (P = 0.3, t-test, df = 24). We therefore conclude that minimal information is contained in the spike timing of VO neurons.
Detection thresholds of VO neurons.
The lower information rates obtained under broadband noise stimulation for VO neurons compared with either regular or irregular afferents suggest that they would be less able to discriminate between head rotations of different amplitudes. On the other hand, their higher gains would suggest that they could better discriminate between these same stimuli. We thus used signal detection theory to quantify the degree of overlap between the fr distribution obtained for a given head velocity and that obtained for zero velocity (Green and Swets 1966). VO neurons were stimulated using sinusoidal head rotations of different frequencies (Fig. 8A). The fr distribution obtained for a given velocity value (Vi) was compared with the fr distribution obtained for zero velocity (Fig. 8B). This was done for velocities ranging between 0 and 50°/s with higher velocities resulting in better discrimination. The detection threshold VT was chosen as the velocity value that gave rise to a 76% probability of correct detection (Fig. 8C). Detection thresholds for VO neurons were significantly greater than those displayed by regular afferents for frequencies ≤4 Hz (P < 0.04, t-tests, df > 21) but not for higher frequencies (P > 0.2, t-tests, df > 18). In contrast, irregular afferents had detection thresholds that were comparable with those of VO neurons for all frequencies (P > 0.46, t-tests, df > 21; Fig. 8D). In addition, we confirmed (Sadeghi et al. 2007) that irregular afferents had higher detection thresholds than regular afferents across this same frequency range (P < 0.02, t-tests, df > 9).
Fig. 8.
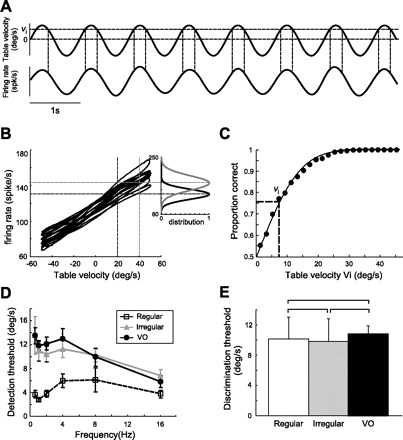
Individual VO neurons display velocity detection thresholds that are greater than or equal to those of afferents. A: table velocity (upper) and time-dependent firing rate (lower) during sinusoidal stimulation. A comparison was made between the distribution of the instantaneous firing rate when the table velocity is equal to a given value (Vi) and that obtained when the table velocity is equal to 0. B: plot of the instantaneous firing rate as a function of table velocity for an example VO neuron. Also shown are schematic representations of the instantaneous firing rate distributions for Vi = 20 and 40°/s. C: neurometric function obtained using receiver operating characteristic (ROC) analysis of the firing-rate distributions for different values of Vi. The detection threshold corresponds to 76% probability of correct detection (dashed lines). D: population-averaged detection threshold values for VO neurons and afferents as a function of the sinusoidal stimulus frequency. Error bars indicate 1 SE. E: velocity thresholds of VO neurons and afferents for discriminating between 8- and 16-Hz sinusoidal head rotations.
We next tested whether the lower information rates obtained for VO neurons would lead to worse discrimination between different stimuli. Specifically, we computed the velocity threshold for discriminating 8- and 16-Hz sinusoidal head rotations. Our results show that these thresholds were similar for VO neurons, regular afferents, and irregular afferents (Fig. 8E; VO vs. regular, P = 0.83, Wilcoxon rank sum test; df = 6, VO vs. irregular, P = 0.76, Wilcoxon rank sum test; df = 6, regular vs. irregular, P = 0.94, Wilcoxon rank sum test; df = 6). This can be explained in part by the fact that the gains of VO neurons were larger than those of afferents, which partially compensates for their larger resting discharge variability.
Population coding.
Our results so far show that whereas VO neurons displayed higher gains than either regular or irregular afferents, they conversely displayed lower information rates and higher detection thresholds due to their larger variability. This latter finding is surprising given that VO neurons are thought to receive input from multiple afferents and could thus be expected to display higher information rates as a result of averaging this input (Zohary et al. 1994). One possible explanation is that VO neurons give a distributed representation of sensory input: all the information about relevant stimuli could thus be found within the population rather than within any individual neuron. We tested this hypothesis in two ways. First, we pooled spiking activity from multiple VO neurons in response to the same noise stimulus and computed the MI available from this population (Machens et al. 2001; Warland et al. 1997). Second, we pooled recordings from multiple VO neurons to the same sinusoidal stimulus and computed the velocity detection threshold.
For noise stimuli, our results show that combining VO neural spike trains can lead to large increases in the MI density (Fig. 9A). This increase was relatively uniform across all frequencies contained in the stimulus (Fig. 9B). We therefore quantified these changes by computing the MI (i.e., integrating the MI density over frequency) as a function of population size for regular afferents, irregular afferents, and VO neurons. Our results show that, although the MI increased as a function of increasing population size for all 3 neuron groups, VO neuron populations of a given size transmitted less information than either regular or irregular afferent populations of the same size (Fig. 9C). Similar results were obtained for the analysis of CF (Fig. 9D). However, we found that the relative increase in the MI was higher for VO neurons (>300%) than for afferents (∼150%; Fig. 9E). The CF obtained from a population of 10 VO neurons also was significantly larger (>200%) than that obtained from an individual VO neuron. In contrast, the CF obtained from a population of 10 regular or irregular afferents was only 80% larger than that of an individual afferent (Fig. 9F). These results suggest that information about the detailed time course of vestibular stimuli is not transmitted by VO neurons. It is possible that instead these neurons might detect specific stimulus features. For example, VO neurons might preferentially respond to/detect high-frequency transients, consistent with our recent proposal that irregular afferents likely play a more important role in encoding high-frequency head rotations compared with regular afferents (Sadeghi et al. 2007a).
Fig. 9.

Combining the activities of multiple VO neurons causes significant increases in MI rate and thus better stimulus estimation. A: population-averaged MI density curves as a function of frequency for broadband stimuli increase as a function of the population size (n). The gray line shows the MI rate for a single neuron (i.e., n = 1) for comparison. B: population-averaged MI density curves as a function of population size. Individual curves show this relationship for different frequencies between 4 and 20 Hz. C and D: MI rate and CF for VO neurons and afferents as a function of n, respectively. E and F: percentage increase of the MI rate and CF for VO neurons and afferents as a function of n, respectively.
We thus next combined the activities of VO neurons in response to sinusoidal stimuli and recomputed the velocity detection thresholds. This led to a significant decrease in the velocity detection threshold that was uniform across frequencies (Fig. 10A). The percentage decrease in threshold was also relatively uniform across frequency (Fig. 10B). We thus quantified the improvement in detection threshold obtained by combining the activities of VO, regular, or irregular afferent spike trains for 1-Hz sinusoidal rotations. Increases in population size led to significant (>50%) decreases in the velocity detection thresholds for all 3 neuron groups. However, the velocity detection threshold obtained from combining regular afferent spike trains plateaued at ∼2°/s, whereas those obtained from irregular afferents and VO neurons continued to decrease (Fig. 10C). To better quantify this observation, we performed a linear least-squares fit to the last 4 data points for each neuron class and computed the slope of the fitted line. This quantity was significantly larger in magnitude for VO and irregular afferents compared with regular afferents (Fig. 10D). Extrapolation of these results suggest that the behaviorally observed velocity detection threshold values (∼1°/s) could be achieved by combining the activities of large numbers of VO neurons (∼40).
Fig. 10.

Combining the activities of multiple VO neurons causes a significant decrease in the velocity detection threshold. A: population-averaged detection threshold values for VO neurons decrease as a function of the population size. Error bars indicate 1 SE. The gray line shows the velocity detection threshold for n = 1 for comparison. B: thresholds normalized relative to the values at n = 1 as a function of frequency. A similar amount of decrease can be observed over all the frequencies for each population size. C: population-averaged detection threshold values for VO neurons and afferents for 1-Hz sinusoidal stimulation as a function of the population size n. The last 4 data points were used to compute the rate at which the detection threshold decreases as a function of n (black and gray lines). D: rate of decrease of the velocity detection threshold for VO neurons and afferents. *Statistical significance at the P = 0.05 level using a t-test.
DISCUSSION
Summary of results.
We studied the responses of VO neurons in the vestibular nuclei and compared them with those of vestibular afferents. VO neurons and irregular afferents displayed greater gains compared with regular afferents over the range of behaviorally relevant frequencies (0–20 Hz). In contrast, VO neurons had lower information rates and higher detection thresholds compared with either irregular or regular afferents. Notably, the lower information rates displayed by VO neurons were not simply a consequence of their lower fr but instead partly due to their higher variability. By adding spike-timing jitter, we further found that minimal information is contained in the spike timing of VO neurons suggesting that they use a rate code to transmit information rather than a temporal code. Overall, our results showed that the capacity of individual VO neurons for information transmission and stimulus discrimination was worse than that of individual peripheral afferents. This suggests that individual VO neurons do not transmit information about the detailed time course of head rotations. Thus we tested the possibility that this information is instead contained in the activities of multiple VO neurons. Specifically, we computed the MI and velocity detection threshold available when pooling our single-unit recordings from VO neurons and afferents in response to the same stimuli. Although the information transmitted by VO neuron populations of a given size were lower than the information transmitted by afferent populations of the same size, extrapolation of our results (Fig. 10C) suggest that the behaviorally observed velocity detection threshold values (0.5–1°/s) might be achieved by combining the activities of large numbers (∼40) of VO neurons.
The role of variability in neural coding.
Our finding that VO neurons display greater resting discharge variability as quantified by CV* and lower information rates compared with afferents appears to be a general feature of sensory processing. Indeed, in the electrosensory system, which shares many similarities with the vestibular system as both have evolved from the lateral line (Romer and Parsons 1977), central neurons also sometimes display larger variability and lower information rates than peripheral neurons (Gabbiani et al. 1996). In the visual system, LGN relay cells transmit detailed information in their spike trains as they are highly reproducible (Reinagel and Reid 2000) and preserve information transmitted from the retina (Rathbun et al. 2010; Sincich et al. 2009; Wang et al. 2010). However, this information is apparently lost at the level of the cortex where neurons also display larger variability in their responses (London et al. 2010; Shadlen and Newsome 1998). The higher variability displayed by cortical neurons might be a consequence of their using a temporal code to transmit information or might serve to prevent entrainment (phase locking), which could be important for the encoding of high-frequency velocity and acceleration signals (Stein et al. 2005). However, the former proposal does not appear to be applicable here as negligible information was contained in the spike times of VO neurons. As such, our results suggest that the spike timing code observed for regular afferents (Sadeghi et al. 2007a) is converted to a rate code in the vestibular nuclei. Similar principles appear to apply to other sensory systems (Ahissar et al. 2000; Salinas et al. 2000).
Alternatively, the large variability of VO neurons might be needed to make central neurons more selective in their responses to the sparsely distributed features of natural stimuli (i.e., the sparse coding hypothesis) (Rolls and Tovee 1995; Vinje and Gallant 2000). Such a strategy is also thought to be used by the electrosensory system (Gabbiani et al. 1996). Indeed, our results are consistent with this hypothesis as they show that VO central neurons do not encode information about the detailed time course of head rotations and suggest that these might instead respond to specific features. Notably, we hypothesize that both VO neurons and irregular afferents preferentially respond to/detect high-frequency transients. This idea is supported not only by the analysis of the MI density of irregular vs. regular afferents (Sadeghi et al. 2007a) and VO neurons (present study), but also by characterizations of response gain and phase (afferents: Goldberg and Fernández 1971a,b; Hullar et al. 2005; Ramachandran and Lisberger 2006; Sadeghi et al. 2007a,b; and VO neurons: present study). Moreover, although there is no evidence that different afferent classes preferentially contribute to different vestibular pathways (e.g., oculomotor vs. vestibulospinal) (Boyle et al. 1992; Highstein et al. 1987), it has been suggested that pathways dominated by irregular afferent input might mediate behaviorally appropriate changes in vestibular processing such as those necessitated in VOR pathways for changes in viewing distance (Chen-Huang et al. 1997; Migliaccio et al. 2004). Additional studies will be needed to address this proposal as well as to establish the central mechanisms by which vestibular nuclei neurons integrate inputs from both afferent classes to achieve this behaviorally dependent modulation of pathway efficacy.
We note that our analysis assumes that the variabilities of VO neurons to repeated presentations of the same stimulus are uncorrelated. Although it is clear that correlations between these variabilities (i.e., noise correlations) can theoretically affect the nature of the neural code (Abbott and Dayan 1999; Averbeck and Lee 2006), recent results suggest that these may be weaker than previously assumed in other systems (Averbeck and Lee 2006; Cohen and Maunsell 2009; Ecker et al. 2010; Schneidman et al. 2006). The effects of noise correlations on population coding by VO neurons cannot be assessed using single-unit recordings. Future studies using multiunit recordings will be required to address this interesting issue. In addition, we note that our estimates of the MI transmitted by populations of central and peripheral vestibular neurons rely on a lower bound and might thus underestimate the true amount of information transmitted. Because the upper-bound estimate of the MI that we used is only valid for single neurons, it cannot be used when combining the activities of multiple neurons without making explicit assumptions about the nature of such combinations. Although it is possible to directly estimate the MI (Belitski et al. 2008; Chacron 2006; Passaglia and Troy 2004; Reinagel and Reid 2000; Strong et al. 1998), such calculations require datasets that exceed those that are currently obtainable from vestibular neurons due to technical limitations and thus cannot be used here.
Implications for vestibular processing.
During everyday life, the vestibular system encodes head movement relative to space and in turn plays a vital role in estimating our spatial orientation and self-motion relative to the world. However, to date, surprisingly little quantification has been done of our ability to perceive vestibular stimuli. Several pioneering studies attempted to quantify thresholds for the detection of angular motion (Clark 1967; Guedry 1974). Most recently, Grabherr et al. (2008) measured detection thresholds as a function of frequency (0.05–5 Hz) and found that velocity thresholds reached a value of 0.5–1°/s for frequencies >0.5 Hz. Although behavioral studies have shown that our ability to detect head movement is very impressive, the detection thresholds of individual vestibular afferent fibers are an order of magnitude larger (Sadeghi et al. 2007a).
To understand how such remarkable behavioral abilities emerge, we recorded from vestibular nuclei neurons that receive direct monosynaptic projections from the vestibular nerve (McCrea et al. 1987; Scudder and Fuchs 1992). These neurons make contributions to vestibulospinal reflexes as well as higher-order vestibular processing including the computation of spatial orientation (reviewed in Angelaki and Cullen 2008). VO neurons project to the flocculus (Cheron et al. 1996; Zhang et al. 1993) and are reciprocally interconnected to the nodulus/uvula (Reisine and Raphan 1992) of the cerebellum. Importantly, the latter connection underlies the prolongation (as compared with that of the vestibular VIIIth nerve) of the time constant for which self-motion is perceived. In addition, recent studies have shown that the vestibular thalamus (i.e., the ventroposterior thalamus) receives direct input from VO neurons (Marlinski and McCrea 2009). This thalamic area in turn relays vestibular information to cortical areas (such as area parietoinsular vestibular cortex) in which neurons are sensitive to vestibular stimulation (Büttner and Lang 1979; Grusser et al. 1990; Magnin and Fuchs 1977).
It is important to note that, in addition to the VO neurons, there are two other physiological classes of neuron in the vestibular nuclei that encode head motion, namely 1) position-vestibular-pause neurons that mediate the VOR, and 2) eye-head (or alternatively, floccular target neurons), which are involved in VOR adaptation (reviewed in Cullen and Roy 2004). It is, however, unlikely that these groups of neurons project to higher vestibular centers (i.e., cortex via thalamus) for several reasons. First, studies using intracellular staining (e.g., McCrea et al. 1987) and spike-triggered averaging of electromyograms (Scudder and Fuchs 1992) have shown that these neurons preferentially project to the extraocular motoneurons. Second, recent electrophysiological studies have explicitly shown that neurons in the vestibular thalamus are not sensitive to eye movements (i.e., they respond only to vestibular signals like VO neurons in the medial vestibular nucleus). Notably, neurons in the vestibular nuclei that target the vestibular thalamus as well as their targets within the thalamus are insensitive to eye movements [thalamus projecting vestibular nuclei neurons (Marlinski and McCrea 2009) and ventroposterior thalamus (Marlinski and McCrea 2008; Meng and Angelaki 2010)].
Our results show that the detection thresholds of individual VO cells are higher than those observed behaviorally (<1°/s) (Becker et al. 2000; Mergner et al. 1993). In contrast, previous studies have reported similar discrimination performances for single central neurons and the organism (Britten et al. 1992). The behavioral vestibular detection threshold might thus emerge by combining the activities of multiple VO neurons in higher-order brain areas. This could be achieved by pooling the activities of a large population or, alternatively, by selectively pooling the activities from a specific subset of neurons as has been shown in area MT (Purushothaman and Bradley 2005). Our results are consistent with the former hypothesis because: 1) contrary to MT neurons, VO neurons do not show specific tuning [i.e., neurons respond linearly to velocity (Roy and Cullen 2004)]; and 2) pooling across our entire VO neuron dataset significantly improved the detection threshold, which is contrary to what is observed in MT (Purushothaman and Bradley 2005). Indeed, our results show that combining the activities of multiple neurons significantly decreased velocity detection thresholds to values that approached those measured from behavior. Although our methodology for computing the population detection threshold assumes that all neuronal responses were temporally aligned, similar results were obtained without such alignment. This is most likely because groups of regular and irregular afferents and VO neurons each show little intragroup variability in the phase of their responses to sinusoidal stimuli (Sadeghi et al. 2007b, 2009).
Conclusions.
Taken together, our results show for the first time that neural variability has important consequences on the coding of information by neurons within the vestibular nuclei. Our results suggest that these neurons do not transmit information about the detailed time course of vestibular stimuli but instead detect specific features. Our results further show that combining the activities of large VO neuron populations is necessary to explain the velocity detection thresholds measured in psychophysical experiments.
GRANTS
This research was supported by the Canadian Institutes of Health Research and the “Fonds Québécois de la Recherche sur la Nature et les Technologies”.
DISCLOSURES
No conflicts of interest, financial or otherwise, are declared by the author(s).
Supplementary Material
ACKNOWLEDGMENTS
We thank S. G. Sadeghi for providing assistance with the afferents recordings and S. Nuara and W. Kucharski for excellent technical assistance.
REFERENCES
- Abbott LF, Dayan P. The effect of correlated variability on the accuracy of a population code. Neural Comput 11: 91–101, 1999 [DOI] [PubMed] [Google Scholar]
- Ahissar E, Sosnik R, Haidarliu S. Transformation from temporal to rate coding in a somatosensory thalamocortical pathway. Nature 406: 302–306, 2000 [DOI] [PubMed] [Google Scholar]
- Angelaki DE, Cullen KE. Vestibular system: the many facets of a multimodal sense. Annu Rev Neurosci 31: 125–150, 2008 [DOI] [PubMed] [Google Scholar]
- Averbeck BB, Lee D. Effects of noise correlations on information encoding and decoding. J Neurophysiol 95: 3633–3644, 2006 [DOI] [PubMed] [Google Scholar]
- Baird RA, Desmadryl G, Fernandez C, Goldberg JM. The vestibular nerve of the chinchilla. II. Relation between afferent response properties and peripheral innervation patterns in the semicircular canals. J Neurophysiol 60: 182–203, 1988 [DOI] [PubMed] [Google Scholar]
- Becker W, Jurgens R, Boss T. Vestibular perception of self-rotation in different postures: a comparison between sitting and standing subjects. Exp Brain Res 131: 468–476, 2000 [DOI] [PubMed] [Google Scholar]
- Belitski A, Gretton A, Magri C, Murayama Y, Montemurro MA, Logothetis NK, Panzeri S. Low-frequency local field potentials and spikes in primary visual cortex convey independent visual information. J Neurosci 28: 5696–5709, 2008 [DOI] [PMC free article] [PubMed] [Google Scholar]
- Bialek W, Rieke F. Reading a neural code. Science 252: 1854–1857, 1991 [DOI] [PubMed] [Google Scholar]
- Borst A, Haag J. Effects of mean firing on neural information rate. J Comput Neurosci 10: 213–221, 2001 [DOI] [PubMed] [Google Scholar]
- Borst A, Theunissen F. Information theory and neural coding. Nat Neurosci 2: 947–957, 1999 [DOI] [PubMed] [Google Scholar]
- Boyle R, Goldberg JM, Highstein SM. Inputs from regularly and irregularly discharging vestibular nerve afferents to secondary neurons in squirrel monkey vestibular nuclei. III. Correlation with vestibulospinal and vestibuloocular output pathways. J Neurophysiol 68: 471–484, 1992 [DOI] [PubMed] [Google Scholar]
- Brenner N, Strong SP, Koberle R, Bialek W, de Ruyter van Steveninck RR. Synergy in a neural code. Neural Comput 12: 1531–1552, 2000 [DOI] [PubMed] [Google Scholar]
- Britten KH, Shadlen MN, Newsome WT, Movshon JA. The analysis of visual motion: a comparison of neuronal and psychophysical performance. J Neurosci 12: 4745–4765, 1992 [DOI] [PMC free article] [PubMed] [Google Scholar]
- Büttner U, Lang W. The vestibulocortical pathway: neurophysiological and anatomical studies in the monkey. Prog Brain Res 50: 581–588, 1979 [DOI] [PubMed] [Google Scholar]
- Chacron MJ. Nonlinear information processing in a model sensory system. J Neurophysiol 95: 2933–2946, 2006 [DOI] [PMC free article] [PubMed] [Google Scholar]
- Chacron MJ, Longtin A, Maler L. Delayed excitatory and inhibitory feedback shape neural information transmission. Phys Rev E Stat Nonlin Soft Matter Phys 72: 051917, 2005a [DOI] [PMC free article] [PubMed] [Google Scholar]
- Chacron MJ, Longtin A, Maler L. Negative interspike interval correlations increase the neuronal capacity for encoding time-varying stimuli. J Neurosci 21: 5328–5343, 2001 [DOI] [PMC free article] [PubMed] [Google Scholar]
- Chacron MJ, Longtin A, Maler L. The effects of spontaneous activity, background noise, and the stimulus ensemble on information transfer in neurons. Network 14: 803–824, 2003 [PubMed] [Google Scholar]
- Chacron MJ, Longtin A, Maler L. To burst or not to burst? J Comput Neurosci 17: 127–136, 2004 [DOI] [PMC free article] [PubMed] [Google Scholar]
- Chacron MJ, Maler L, Bastian J. Electroreceptor neuron dynamics shape information transmission. Nat Neurosci 8: 673–678, 2005b [DOI] [PMC free article] [PubMed] [Google Scholar]
- Chen-Huang C, McCrea RA, Goldberg JM. Contributions of regularly and irregularly discharging vestibular-nerve inputs to the discharge of central vestibular neurons in the alert squirrel monkey. Exp Brain Res 114: 405–422, 1997 [DOI] [PubMed] [Google Scholar]
- Cherif S, Cullen KE, Galiana HL. An improved method for the estimation of firing rate dynamics using an optimal digital filter. J Neurosci Methods 173: 165–181, 2008 [DOI] [PubMed] [Google Scholar]
- Cheron G, Escudero M, Godaux E. Discharge properties of brain stem neurons projecting to the flocculus in the alert cat. I. Medical vestibular nucleus. J Neurophysiol 76: 1759–1774, 1996 [DOI] [PubMed] [Google Scholar]
- Clague H, Theunissen F, Miller JP. Effects of adaptation on neural coding by primary sensory interneurons in the cricket cercal system. J Neurophysiol 77: 207–220, 1997 [DOI] [PubMed] [Google Scholar]
- Clark B. Thresholds for the perception of angular acceleration in man. Aerospace Med 38: 443–450, 1967 [PubMed] [Google Scholar]
- Cohen MR, Maunsell JH. Attention improves performance primarily by reducing interneuronal correlations. Nat Neurosci 12: 1594–1600, 2009 [DOI] [PMC free article] [PubMed] [Google Scholar]
- Cox DR, Lewis PA. The Statistical Analysis of Series of Events. London: Methuen, 1966 [Google Scholar]
- Cullen KE, McCrea RA. Firing behavior of brain stem neurons during voluntary cancellation of the horizontal vestibuloocular reflex. I. Secondary vestibular neurons. J Neurophysiol 70: 828–843, 1993 [DOI] [PubMed] [Google Scholar]
- Cullen KE, Minor LB. Semicircular canal afferents similarly encode active and passive head-on-body rotations: implications for the role of vestibular efference. J Neurosci 22: RC226, 2002 [DOI] [PMC free article] [PubMed] [Google Scholar]
- Cullen KE, Roy JE. Signal processing in the vestibular system during active versus passive head movements. J Neurophysiol 91: 1919–1933, 2004 [DOI] [PubMed] [Google Scholar]
- Dan Y, Alonso JM, Usrey WM, Reid RC. Coding of visual information by precisely correlated spikes in the lateral geniculate nucleus. Nat Neurosci 1: 501–507, 1998 [DOI] [PubMed] [Google Scholar]
- Dayan P, Abbott LF. Theoretical Neuroscience: Computational and Mathematical Modeling of Neural Systems. Cambridge, MA: MIT Press, 2001 [Google Scholar]
- Dean AF. The variability of discharge of simple cells in the cat striate cortex. Exp Brain Res 44: 437–440, 1981 [DOI] [PubMed] [Google Scholar]
- Ecker AS, Berens P, Keliris GA, Bethge M, Logothetis NK, Tolias AS. Decorrelated neuronal firing in cortical microcircuits. Science 327: 584–587, 2010 [DOI] [PubMed] [Google Scholar]
- Fernandez C, Baird RA, Goldberg JM. The vestibular nerve of the chinchilla. I. Peripheral innervation patterns in the horizontal and superior semicircular canals. J Neurophysiol 60: 167–181, 1988 [DOI] [PubMed] [Google Scholar]
- Gabbiani F. Coding of time varying signals in spike trains of linear and half-wave rectifying neurons. Network: Computation in Neural Systems 7: 61–85, 1996 [DOI] [PubMed] [Google Scholar]
- Gabbiani F, Koch C. Principles of spike train analysis. In: Methods in Neuronal Modeling: From Ions to Networks, edited by Koch C, Segev I. Cambridge, MA: MIT Press, 1998, p. 313–360 [Google Scholar]
- Gabbiani F, Metzner W, Wessel R, Koch C. From stimulus encoding to feature extraction in weakly electric fish. Nature 384: 564–567, 1996 [DOI] [PubMed] [Google Scholar]
- Goldberg JM. Afferent diversity and the organisation of central vestibular pathways. Exp Brain Res 130: 277–297, 2000 [DOI] [PMC free article] [PubMed] [Google Scholar]
- Goldberg JM, Fernández C. Physiology of peripheral neurons innervating semicircular canals of the squirrel monkey. I. Resting discharge and response to constant angular acceleration. J Neurophysiol 34: 635–660, 1971a [DOI] [PubMed] [Google Scholar]
- Goldberg JM, Fernandez C. Physiology of peripheral neurons innervating semicircular canals of the squirrel monkey. II. Response to sinusoidal stimulation and dynamics of peripheral vestibular system. J Neurophysiol 34: 661–675, 1971b [DOI] [PubMed] [Google Scholar]
- Goldberg JM, Highstein SM, Moschovakis AK, Fernandez C. Inputs from regularly and irregularly discharging vestibular nerve afferents to secondary neurons in the vestibular nuclei of the squirrel monkey. I. An electrophysiological analysis. J Neurophysiol 58: 700–718, 1987 [DOI] [PubMed] [Google Scholar]
- Goldberg JM, Smith CE, Fernandez C. Relation between discharge regularity and responses to externally applied galvanic currents in vestibular nerve afferents of the squirrel monkey. J Neurophysiol 51: 1236–1256, 1984 [DOI] [PubMed] [Google Scholar]
- Grabherr L, Nicoucar K, Mast FW, Merfeld DM. Vestibular thresholds for yaw rotation about an earth-vertical axis as a function of frequency. Exp Brain Res 186: 677–681, 2008 [DOI] [PubMed] [Google Scholar]
- Green D, Swets J. Signal Detection Theory and Psychophysics. New York: John Wiley & Sons, 1966 [Google Scholar]
- Grusser OJ, Pause M, Schreiter U. Vestibular neurones in the parieto-insular cortex of monkeys (Macaca fascicularis): visual and neck receptor responses. J Physiol 430: 559–583, 1990 [DOI] [PMC free article] [PubMed] [Google Scholar]
- Gu Y, Angelaki DE, Deangelis GC. Neural correlates of multisensory cue integration in macaque MSTd. Nat Neurosci 11: 1201–1210, 2008 [DOI] [PMC free article] [PubMed] [Google Scholar]
- Gu Y, DeAngelis GC, Angelaki DE. A functional link between area MSTd and heading perception based on vestibular signals. Nat Neurosci 10: 1038–1047, 2007 [DOI] [PMC free article] [PubMed] [Google Scholar]
- Guedry F. Psychophysics of vestibular sensation. In: Handbook of Sensory Physiology, edited by Kornhuber HH. New York: Springer, 1974, p. 1–154 [Google Scholar]
- Haag J, Borst A. Active membrane properties and signal encoding in graded potential neurons. J Neurosci 18: 7972–7986, 1998 [DOI] [PMC free article] [PubMed] [Google Scholar]
- Haque A, Angelaki DE, Dickman JD. Spatial tuning and dynamics of vestibular semicircular canal afferents in rhesus monkeys. Exp Brain Res 155: 81–90, 2004 [DOI] [PubMed] [Google Scholar]
- Highstein SM, Goldberg JM, Moschovakis AK, Fernandez C. Inputs from regularly and irregularly discharging vestibular nerve afferents to secondary neurons in the vestibular nuclei of the squirrel monkey. II. Correlation with output pathways of secondary neurons. J Neurophysiol 58: 719–738, 1987 [DOI] [PubMed] [Google Scholar]
- Holden AV. Models of the Stochastic Activity of Neurons. Berlin: Springer, 1976 [Google Scholar]
- Hullar TE, Della Santina CC, Hirvonen T, Lasker DM, Carey JP, Minor LB. Responses of irregularly discharging chinchilla semicircular canal vestibular-nerve afferents during high-frequency head rotations. J Neurophysiol 93: 2777–2786, 2005 [DOI] [PubMed] [Google Scholar]
- Huterer M, Cullen KE. Vestibuloocular reflex dynamics during high-frequency and high-acceleration rotations of the head on body in rhesus monkey. J Neurophysiol 88: 13–28, 2002 [DOI] [PubMed] [Google Scholar]
- Jarvis MR, Mitra PP. Sampling properties of the spectrum and coherency of sequences of action potentials. Neural Comput 13: 717–749, 2001 [DOI] [PubMed] [Google Scholar]
- Jones LM, Depireux DA, Simons DJ, Keller A. Robust temporal coding in the trigeminal system. Science 304: 1986–1989, 2004 [DOI] [PMC free article] [PubMed] [Google Scholar]
- Krahe R, Bastian J, Chacron MJ. Temporal processing across multiple topographic maps in the electrosensory system. J Neurophysiol 100: 852–867, 2008 [DOI] [PMC free article] [PubMed] [Google Scholar]
- Krahe R, Kreiman G, Gabbiani F, Koch C, Metzner W. Stimulus encoding and feature extraction by multiple sensory neurons. J Neurosci 22: 2374–2382, 2002 [DOI] [PMC free article] [PubMed] [Google Scholar]
- Kreiman G, Krahe R, Metzner W, Koch C, Gabbiani F. Robustness and variability of neuronal coding by amplitude sensitive afferents in the weakly electric fish eigenmania. J Neurophysiol 84: 189–224, 2000 [DOI] [PubMed] [Google Scholar]
- Lisberger SG, Pavelko TA. Vestibular signals carried by pathways subserving plasticity of the vestibulo-ocular reflex in monkeys. J Neurosci 6: 346–354, 1986 [DOI] [PMC free article] [PubMed] [Google Scholar]
- Liu S, Yakusheva T, Deangelis GC, Angelaki DE. Direction discrimination thresholds of vestibular and cerebellar nuclei neurons. J Neurosci 30: 439–448, 2010 [DOI] [PMC free article] [PubMed] [Google Scholar]
- London M, Roth A, Beeren L, Hausser M, Latham PE. Sensitivity to perturbations in vivo implies high noise and suggests rate coding in cortex. Nature 466: 123–127, 2010 [DOI] [PMC free article] [PubMed] [Google Scholar]
- Machens CK, Stemmler MB, Prinz P, Krahe R, Ronacher B, Herz AV. Representation of acoustic communication signals by insect auditory neurons. J Neurosci 21: 3215–3227, 2001 [DOI] [PMC free article] [PubMed] [Google Scholar]
- Magnin M, Fuchs AF. Discharge properties of neurons in the monkey thalamus tested with angular acceleration, eye movement and visual stimuli. Exp Brain Res 28: 293–299, 1977 [DOI] [PubMed] [Google Scholar]
- Mainen ZF, Sejnowski TJ. Reliability of spike timing in neocortical neurons. Science 268: 1503–1506, 1995 [DOI] [PubMed] [Google Scholar]
- Marlinski V, McCrea RA. Activity of ventroposterior thalamus neurons during rotation and translation in the horizontal plane in the alert squirrel monkey. J Neurophysiol 99: 2533–2545, 2008 [DOI] [PubMed] [Google Scholar]
- Marlinski V, McCrea RA. Self-motion signals in vestibular nuclei neurons projecting to the thalamus in the alert squirrel monkey. J Neurophysiol 101: 1730–1741, 2009 [DOI] [PMC free article] [PubMed] [Google Scholar]
- Marsat G, Pollack GS. Differential temporal coding of rhythmically diverse acoustic signals by a single interneuron. J Neurophysiol 92: 939–948, 2004 [DOI] [PubMed] [Google Scholar]
- Marsat G, Pollack GS. Effect of the temporal pattern of contralateral inhibition on sound localization cues. J Neurosci 25: 6137–6144, 2005 [DOI] [PMC free article] [PubMed] [Google Scholar]
- McCrea RA, Gdowski GT, Boyle R, Belton T. Firing behavior of vestibular neurons during active and passive head movements: vestibulo-spinal and other non-eye-movement related neurons. J Neurophysiol 82: 416–428, 1999 [DOI] [PubMed] [Google Scholar]
- McCrea RA, Strassman A, May E, Highstein SM. Anatomical and physiological characteristics of vestibular neurons mediating the horizontal vestibulo-ocular reflex of the squirrel monkey. J Comp Neurol 264: 547–570, 1987 [DOI] [PubMed] [Google Scholar]
- Meng H, Angelaki DE. Responses of ventral posterior thalamus neurons to three-dimensional vestibular and optic flow stimulation. J Neurophysiol 103: 817–826, 2010 [DOI] [PMC free article] [PubMed] [Google Scholar]
- Mergner T, Hlavacka F, Schweigart G. Interaction of vestibular and proprioceptive inputs. J Vestib Res 3: 41–57, 1993 [PubMed] [Google Scholar]
- Metzner W, Koch C, Wessel R, Gabbiani F. Feature extraction by burst-like spike patterns in multiple sensory maps. J Neurosci 18: 2283–2300, 1998 [DOI] [PMC free article] [PubMed] [Google Scholar]
- Middleton JW, Longtin A, Benda J, Maler L. Postsynaptic receptive field size and spike threshold determine encoding of high-frequency information via sensitivity to synchronous presynaptic activity. J Neurophysiol 101: 1160–1170, 2009 [DOI] [PubMed] [Google Scholar]
- Migliaccio AA, Minor LB, Carey JP. Vergence-mediated modulation of the human horizontal vestibulo-ocular reflex is eliminated by a partial peripheral gentamicin lesion. Exp Brain Res 159: 92–98, 2004 [DOI] [PubMed] [Google Scholar]
- Oppenheim AV, Schafer RW. Discrete-Time Signal Processing. Englewood Cliffs, NJ: Prentice-Hall, 1989 [Google Scholar]
- Panzeri S, Petroni F, Petersen RS, Diamond ME. Decoding neuronal population activity in rat somatosensory cortex: role of columnar organization. Cerebral Cortex 13: 45–52, 2003 [DOI] [PubMed] [Google Scholar]
- Passaglia CL, Troy JB. Information transmission rates of cat retinal ganglion cells. J Neurophysiol 91: 1217–1229, 2004 [DOI] [PMC free article] [PubMed] [Google Scholar]
- Purushothaman G, Bradley DC. Neural population code for fine perceptual decisions in area MT. Nat Neurosci 8: 99–106, 2005 [DOI] [PubMed] [Google Scholar]
- Ramachandran R, Lisberger SG. Transformation of vestibular signals into motor commands in the vestibuloocular reflex pathways of monkeys. J Neurophysiol 96: 1061–1074, 2006 [DOI] [PMC free article] [PubMed] [Google Scholar]
- Rathbun DL, Warland DK, Usrey WM. Spike timing and information transmission at retinogeniculate synapses. J Neurosci 30: 13558–13566, 2010 [DOI] [PMC free article] [PubMed] [Google Scholar]
- Reich DS, Mechler F, Victor JD. Independent and redundant information in nearby cortical neurons. Science 294: 2566–2568, 2001 [DOI] [PubMed] [Google Scholar]
- Reinagel P, Reid RC. Temporal coding of visual information in the thalamus. J Neurosci 20: 5392–5400, 2000 [DOI] [PMC free article] [PubMed] [Google Scholar]
- Reisine H, Raphan T. Neural basis for eye velocity generation in the vestibular nuclei of alert monkeys during off-vertical axis rotation. Exp Brain Res 92: 209–226, 1992 [DOI] [PubMed] [Google Scholar]
- Rieke F, Warland D, de Ruyter van Steveninck RR, Bialek W. Spikes: Exploring the Neural Code. Cambridge, MA: MIT Press, 1996 [Google Scholar]
- Roddey JC, Girish B, Miller JP. Assessing the performance of neural encoding models in the presence of noise. J Comput Neurosci 8: 95–112, 2000 [DOI] [PubMed] [Google Scholar]
- Roddey JC, Jacobs GA. Information theoretic analysis of dynamical encoding by filiform mechanoreceptors in the cricket cercal system. J Neurophysiol 75: 1365–1376, 1996 [DOI] [PubMed] [Google Scholar]
- Rolls ET, Tovee MJ. Sparseness of the neuronal representation of stimuli in the primate temporal visual cortex. J Neurophysiol 73: 713–726, 1995 [DOI] [PubMed] [Google Scholar]
- Romer A, Parsons TS. The Vertebrate Body. Philadelphia, PA: Saunders, 1977 [Google Scholar]
- Roy JE, Cullen KE. Dissociating self-generated from passively applied head motion: neural mechanisms in the vestibular nuclei. J Neurosci 24: 2102–2111, 2004 [DOI] [PMC free article] [PubMed] [Google Scholar]
- Roy JE, Cullen KE. Selective processing of vestibular reafference during self-generated head motion. J Neurosci 21: 2131–2142, 2001 [DOI] [PMC free article] [PubMed] [Google Scholar]
- Sadeghi SG, Chacron MJ, Taylor MC, Cullen KE. Neural variability, detection thresholds, and information transmission in the vestibular system. J Neurosci 27: 771–781, 2007a [DOI] [PMC free article] [PubMed] [Google Scholar]
- Sadeghi SG, Minor LB, Cullen KE. Dynamics of the horizontal vestibuloocular reflex after unilateral labyrinthectomy: response to high frequency, high acceleration, and high velocity rotations. Exp Brain Res 175: 471–484, 2006 [DOI] [PubMed] [Google Scholar]
- Sadeghi SG, Minor LB, Cullen KE. Response of vestibular-nerve afferents to active and passive rotations under normal conditions and after unilateral labyrinthectomy. J Neurophysiol 97: 1503–1514, 2007b [DOI] [PubMed] [Google Scholar]
- Sadeghi SG, Mitchell DE, Cullen KE. Different neural strategies for multimodal integration: comparison of two macaque monkey species. Exp Brain Res 195: 45–57, 2009 [DOI] [PMC free article] [PubMed] [Google Scholar]
- Salinas E, Hernandez A, Zainos A, Romo R. Periodicity and firing rate as candidate neural codes for the frequency of vibrotactile stimuli. J Neurosci 20: 5503–5515, 2000 [DOI] [PMC free article] [PubMed] [Google Scholar]
- Sato F, Sasaki H, Ishizuka N, Sasaki S, Mannen H. Morphology of single primary vestibular afferents originating from the horizontal semicircular canal in the cat. J Comp Neurol 290: 423–439, 1989 [DOI] [PubMed] [Google Scholar]
- Schneidman E, Berry MJ, 2nd, Segev R, Bialek W. Weak pairwise correlations imply strongly correlated network states in a neural population. Nature 440: 1007–1012, 2006 [DOI] [PMC free article] [PubMed] [Google Scholar]
- Scudder CA, Fuchs AF. Physiological and behavioral identification of vestibular nucleus neurons mediating the horizontal vestibuloocular reflex in trained rhesus monkeys. J Neurophysiol 68: 244–264, 1992 [DOI] [PubMed] [Google Scholar]
- Shadlen MN, Newsome WT. The variable discharge of cortical neurons: implications for connectivity, computation, and information coding. J Neurosci 18: 3870–3896, 1998 [DOI] [PMC free article] [PubMed] [Google Scholar]
- Shannon CE. The mathematical theory of communication. Bell Systems Technical Journal 27: 379–423; 623–656, 1948 [Google Scholar]
- Sincich LC, Horton JC, Sharpee TO. Preserving information in neural transmission. J Neurosci 29: 6207–6216, 2009 [DOI] [PMC free article] [PubMed] [Google Scholar]
- Softky WR, Koch C. The highly irregular firing of cortical cells is inconsistent with temporal integration of random EPSPs. J Neurosci 13: 334–350, 1993 [DOI] [PMC free article] [PubMed] [Google Scholar]
- Stein RB, Gossen ER, Jones KE. Neuronal variability: noise or part of the signal? Nat Rev Neurosci 6: 389–397, 2005 [DOI] [PubMed] [Google Scholar]
- Strong SP, Koberle R, de Ruyter van Steveninck RR, Bialek W. Entropy and information in neural spike trains. Phys Rev Lett 80: 197–200, 1998 [Google Scholar]
- Sylvestre PA, Cullen KE. Quantitative analysis of abducens neuron discharge dynamics during saccadic and slow eye movements. J Neurophysiol 82: 2612–2632, 1999 [DOI] [PubMed] [Google Scholar]
- Theunissen F, Miller JP. Temporal encoding in the nervous system: a rigorous definition. J Comput Neurosci 2: 149–162, 1995 [DOI] [PubMed] [Google Scholar]
- Theunissen F, Roddey JC, Stufflebeam S, Clague H, Miller JP. Information theoretic analysis of dynamical encoding by four identified interneurons in the cricket cercal system. J Neurophysiol 75: 1345–1364, 1996 [DOI] [PubMed] [Google Scholar]
- Tolhurst DJ, Movshon JA, Dean AF. The statistical reliability of signals in single neurons in cat and monkey visual cortex. Vision Res 23: 775–785, 1983 [DOI] [PubMed] [Google Scholar]
- Vinje WE, Gallant JL. Sparse coding and decorrelation in primary visual cortex during natural vision. Science 287: 1273–1276, 2000 [DOI] [PubMed] [Google Scholar]
- Wang X, Hirsch JA, Sommer FT. Recoding of sensory information across the retinothalamic synapse. J Neurosci 30: 13567–13577, 2010 [DOI] [PMC free article] [PubMed] [Google Scholar]
- Warland DK, Reinagel P, Meister M. Decoding visual information from a population of retinal ganglion cells. J Neurophysiol 78: 2336–2350, 1997 [DOI] [PubMed] [Google Scholar]
- Wessel R, Koch C, Gabbiani F. Coding of time-varying electric field amplitude modulations in a wave-type electric fish. J Neurophysiol 75: 2280–2293, 1996 [DOI] [PubMed] [Google Scholar]
- Zhang Y, Partsalis AM, Highstein SM. Properties of superior vestibular nucleus neurons projecting to the cerebellar flocculus in the squirrel monkey. J Neurophysiol 69: 642–645, 1993 [DOI] [PubMed] [Google Scholar]
- Zohary E, Shadlen MN, Newsome WT. Correlated neuronal discharge rate and its implications for psychophysical performance. Nature 370: 140–143, 1994 [DOI] [PubMed] [Google Scholar]
Associated Data
This section collects any data citations, data availability statements, or supplementary materials included in this article.