

Abstract
The density of somatostatin (SOM)-containing GABAergic interneurons in the hilus of the dentate gyrus is significantly decreased in both human and experimental temporal lobe epilepsy. We used the pilocarpine model of status epilepticus and temporal lobe epilepsy in mice to study anatomical and electrophysiological properties of surviving somatostatin interneurons and determine whether compensatory functional changes occur that might offset loss of other inhibitory neurons. Using standard patch-clamp techniques and pipettes containing biocytin, whole cell recordings were obtained in hippocampal slices maintained in vitro. Hilar SOM cells containing enhanced green fluorescent protein (EGFP) were identified with fluorescent and infrared differential interference contrast video microscopy in epileptic and control GIN (EGFP-expressing Inhibitory Neurons) mice. Results showed that SOM cells from epileptic mice had 1) significant increases in somatic area and dendritic length; 2) changes in membrane properties, including a small but significant decrease in resting membrane potential, and increases in time constant and whole cell capacitance; 3) increased frequency of slowly rising spontaneous excitatory postsynaptic currents (sEPSCs) due primarily to increased mEPSC frequency, without changes in the probability of release; 4) increased evoked EPSC amplitude; and 5) increased spontaneous action potential generation in cell-attached recordings. Results suggest an increase in excitatory innervation, perhaps on distal dendrites, considering the slower rising EPSCs and increased output of hilar SOM cells in this model of epilepsy. In sum, these changes would be expected to increase the inhibitory output of surviving SOM interneurons and in part compensate for interneuronal loss in the epileptogenic hippocampus.
INTRODUCTION
Loss of hippocampal neurons, including some GABAergic interneurons, is a common neuropathological finding in human temporal lobe epilepsy (Margerison and Corsellis 1966). It has been proposed that some surviving interneurons lose excitatory synaptic input and become less active (Sloviter et al. 2003). Alternatively, surviving interneurons might undergo structural and functional changes that compensate for epileptogenic injuries. We sought to address this question by evaluating the excitatory synaptic input to hilar somatostatin-immunoreactive interneurons (“SOM” interneurons in the following text) labeled with enhanced green fluorescent protein (EGFP) in GIN (EGFP-expressing Inhibitory Neurons) mice (Oliva Jr et al. 2000) that were epileptic following pilocarpine-induced standard error (SE). Somatostatin-containing cells are a major class of GABAergic interneurons in the dentate gyrus (Austin and Buckmaster 2004; Buckmaster and Jongen-Rêlo 1999; Esclapez and Houser 1995; Kosaka et al. 1988; Somogyi et al. 1984). Their axon collaterals primarily synapse with the dendrites of glutamatergic granule cells (Buckmaster et al. 2002; Katona et al. 1999; Leranth et al. 1990; Milner and Bacon 1989), so that their output would be an important factor in regulating excitability in the dentate synaptic network.
Several anatomical abnormalities occur in the dentate gyrus of both patients (de Lanerolle et al. 1985; Mathern et al. 1995; Robbins et al. 1991; Sundstrom et al. 2001) and animals with temporal lobe epilepsy (Freund et al. 1991; Houser and Esclapez 1996; Lowenstein et al. 1992; Schwarzer et al. 1995; Sloviter 1987; Sun et al. 2007). There is sprouting of granule cell (GC) axons (Sutula et al. 1989), so that an average individual GC in epileptic rats projects 75% more axon into the hilus compared with controls (Buckmaster and Dudek 1999). There is also a substantial loss of hilar SOM interneurons; however, somata of surviving SOM interneurons appear qualitatively larger than those in controls (Buckmaster and Dudek 1997). Associated changes in interneuron dendritic length have not previously been evaluated in epileptic animals. However, if the apparent somatic enlargement were accompanied by enlargement and lengthening of dendritic processes, both alterations in intrinsic electrophysiological properties (Rall 1962) and increased excitatory synaptic input from the sprouting GC axons targeting these dendrites might be expected. One potential consequence of such structural alterations and accompanying increased excitatory input would be a compensatory increase in feedback inhibition from surviving SOM interneurons.
We used hippocampal slices from GIN mice (Oliva Jr et al. 2000) to obtain whole cell patch recordings from hilar SOM interneurons in control and epileptic mice to compare their intrinsic electrophysiological characteristics, somatic and dendritic morphology, excitatory synaptic inputs, and spontaneous activity. Results show that somatodendritic structure of surviving SOM interneurons is altered in epileptic mice and that SOM interneurons receive more excitatory synaptic input and are more active than in controls.
METHODS
All experiments were carried out according to protocols approved by the Stanford Institutional Animal Care and Use Committee. GIN mice (Oliva Jr et al. 2000), strain FVB-TgN(GadGFP)45704Swn, were obtained from Jackson Laboratories.
Induction of temporal lobe epilepsy
To induce status epilepticus (SE), 34 ± 7-day-old (mean ± SE) mice (n = 40) of either sex were treated with atropine methyl bromide (5 mg/kg, administered intraperitoneally [ip]), followed 20 min later by pilocarpine hydrochloride (300–320 mg/kg, ip). After 2 h of SE, mice were treated with diazepam (10 mg/kg, ip; Hospira, Lake Forest, IL), which was repeated, as necessary, to suppress convulsions. They were used in an in vitro slice experiment 46 ± 3 days later. Beginning ≥10 days after SE, mice were video-monitored for behavioral seizures of ≥grade 3 (Racine 1972). Of the 40 mice treated with pilocarpine, 14 developed SE, survived, and displayed at least two spontaneous seizures before being used in a slice experiment. Controls consisted of the remaining 26 mice that were treated with pilocarpine but did not develop SE or display spontaneous seizures. We previously found no differences in naïve control GIN mice and those that failed to develop SE and epilepsy after treatment with pilocarpine (and atropine and diazepam) (Zhang et al. 2009). Therefore to reduce the number of mice used in the present study, the control group consisted of pilocarpine-treated mice that failed to develop SE, all of which were not observed to develop seizures at any time. This group is arguably the best control because it was exposed to the same drug treatment as the epileptic group and differed only in the epileptogenic event (SE) and occurrence of spontaneous seizures. However, because we did not use electroencephalographic recordings we cannot rule out that some control mice had nonconvulsive SE. Therefore it is possible that a small number of control mice actually belong in the epileptic group. Nevertheless, this would lead only to an underestimation of any differences between the two groups of mice.
All chemicals were obtained from Sigma (St. Louis, MO) unless otherwise specified.
Immunohistochemistry
For morphological characterization of individual interneurons, patch pipettes were filled with 0.05% biocytin (Sigma). Slices containing labeled cells were fixed overnight in 4% paraformaldehyde in phosphate buffer, rinsed with PBS, permeabilized with 0.25% Triton X-100 plus 0.5% bovine serum albumin, and later incubated for 2 h in Texas Red Avidin D (1:200; Vector Laboratory, Burlingame, CA) at room temperature.
Cell morphology
Confocal z-stack images (Zeiss LSM 10; Carl Zeiss MicroImaging, Thornwood, NY) were obtained from somata and dendritic processes of biocytin-filled GFP-labeled hilar SOM cells (n = 10) from which electrophysiological data had been obtained. Filled cells were located >50 μm from the slice surface. Somata and dendrites were traced using the confocal module of the Neurolucida system (MicroBrightField, Williston, VT), which allowed measurement of somatic areas. Dendritic lengths and branch patterns were measured using a modified Sholl analysis in which concentric circles were drawn at increasing distances from the center of the soma at 10-μm intervals and numbers of dendritic crossings counted. Numbers of dendritic endings were assessed in the same group of filled cells.
Acute slice preparation
Forty GIN mice (26 control, 14 epileptic), 80 ± 7 days old, were used for in vitro recordings. Techniques for preparing and maintaining brain slices in vitro were as previously described (Halabisky et al. 2006). Mice were deeply anesthetized with sodium pentobarbital (55 mg/kg, ip), decapitated, and the brains were rapidly removed and placed in cold (4°C) oxygenated cutting solution containing (in mM): 2.5 KCl, 1.25 NaPO4, 10 MgSO4, 0.5 CaCl2, 26 NaHCO3, 11 glucose, and 234 sucrose. A block of brain containing temporal hippocampus (Franklin and Paxinos 1997) was fastened to the stage of a DSK vibratome (Dosaka, Kyoto, Japan) with cyanoacrylate (Krazy Glue) and 350-μm horizontal slices were cut in the cutting solution. Slices were then incubated for ≥30 min in standard artificial cerebrospinal fluid (ACSF; 30°C) that contained (in mM): 2.5 KCl, 126 NaCl, 10 glucose, 1.25 NaH2PO4, 1 MgSO4, 2 CaCl2, and 26 NaHCO3 (pH ≈ 7.4 when gassed with a mixture of 95% O2-5% CO2), after which they were maintained at room temperature. Single slices were transferred to a submerged recording chamber where they were maintained at 30°C and perfused at a rate of 2 mL/min.
Recordings
Recordings were made from single EGFP-expressing SOM interneurons located within the hilus of the dentate gyrus, identified under fluorescent and infrared differential interference contrast (IR-DIC) video microscopy with a Zeiss Axioskop 2 FS plus microscope. Patch pipettes (4–6 MΩ) were pulled from borosilicate glass (WPI, Sarasota, FL) and filled with (in mM) 5 KCl, 135 K-gluconate, 2 NaCl, 10 HEPES, 4 EGTA, 4 MgATP, and 0.3 Na3GTP (pH ≈ 7.2; 285 mosmol) for current-clamp and voltage-clamp recordings. Liquid junction potentials were measured using the junction potential calculator in Clampex 9.0 software and corrected during data analysis. Electrophysiological data for analysis were obtained from interneurons that had a resting membrane potential (Vm) more negative than −50 mV, action potentials (APs) overshooting beyond +10 mV, and membrane input resistance (Rm) >100 MΩ. Series resistance was monitored throughout recordings and, if >15 MΩ or varied >15%, recordings were discarded.
Using the same internal solution as before, cell-attached recordings were obtained from granule cells located within stratum granulosum, identified on the basis of their position and morphology under IR-DIC video microscopy. To evoke synaptic currents a monopolar glass stimulating electrode filled with ACSF was used. Stimulus pulses were delivered through a WPI 850 A/B stimulus isolation unit. Stimulating electrodes were placed in the granule cell layer at a point close to the recorded interneuron. Minimal stimulation intensity was defined for each cell as the minimal current amplitude (30–200 μA) for a 25-μs stimulus pulse that evoked a just detectable excitatory postsynaptic current (EPSC). A series of graded intensity stimuli was then applied by increasing the pulse duration to 50, 75, 125, 250, and 375 μs (2-, 3-, 5-, 10-, and 15-fold threshold).
Electrophysiological analysis
Current pulses were delivered from the cell's Vm with no holding current applied. Membrane input resistance (Rm) was obtained from the linear portion of a current–voltage (I–V) plot, where V was determined as the maximal negative potential during the 500-ms hyperpolarizing pulse (see Fig. 3A). Membrane time constant (τm) was obtained by fitting voltage responses to hyperpolarizing current pulses with a standard single-exponential decay (y = y0 + Ae−t/τm, where y0 is the y offset or asymptote, A is amplitude, τm is decay time constant, and t is time). Series resistance (RS) was calculated for all cells based on the amplitude of the capacitive current in response to a 10-mV step.
Fig. 3.

Comparison of intrinsic membrane properties of SOM hilar interneurons from control and epileptic mice. A and B: representative voltage responses to 500-ms hyper- and depolarizing current pulses (−100, −75, −50, −25, and 100 pA) in SOM-EGFP hilar neurons of control (A) and epileptic (B) mice. Resting membrane potential is indicated above beginning of traces. Note slower charging responses to hyperpolarizing current pulses in B vs. A. Dashed line in B response of cell in A to a −100-pA current pulse scaled to match amplitude of response of cell in B to same current pulse. Arrows in A and B denote faster responses of cell from control mouse. Arrowheads point to frequent spontaneous excitatory postsynaptic potentials (EPSPs) seen in cells from epileptic mice (see Fig. 4). C and D: graphs of membrane input resistance (C) and time constant (D) for hilar SOM-EGFP cells from control (white) and epileptic slices (black). Number of cells indicated at bottom of bars. *P < 0.05; **P < 0.01, in 2-sample t-test. Number of mice: 17 control, 7 epileptic.
Currents were analyzed with event-detection software (wDetecta; JR Huguenard). For amplitude, rise time, and decay time measurements, currents uncontaminated by subsequent events were isolated. Rise times were measured as the time from 10 to 90% of peak amplitude and vice versa for decay times. Frequencies of spontaneous and miniature EPSCs (sEPSCs and mEPSCs, respectively) were determined from the average frequency over 3 min for each. The ratio of mEPSC/sEPSC frequency was determined for each cell and then averaged across the population.
Statistical analysis
Statistical significance for group means was determined with unpaired two-tailed Student's t-test (*P < 0.05, **P < 0.01). Results from modified Sholl analyses were analyzed by two-way ANOVAs. Data are presented as means ± SE. Origin and Microsoft Excel software were used to perform all statistical analyses.
RESULTS
Soma size and dendritic length of EGFP-expressing interneurons are increased in epileptic mice
To determine whether the morphology of SOM-EGFP neurons is altered in epileptic mice, we obtained confocal images of biocytin-filled cells. Somatic area, taken from sections through the center of somata, was significantly larger in hilar SOM-EGFP neurons of epileptic (340.8 ± 5.5 μm2, n = 7) versus control mice (258.2 ± 14 μm2, n = 7; P < 0.01; Table 1). Total dendritic length was also greater in the cells from epileptic (1,375 ± 28 μm, n = 6) versus control mice (780 ± 15 μm, n = 4; P < 0.05; Fig. 1, A–C). Scholl analysis (Fig. 1D) confirmed the increased length of dendrites in SOM-EGFP neurons and showed a trend toward more dendritic branches in the filled cells from epileptic mice (103 ± 30 crossings for epileptic and 30 ± 16 for control; P = 0.14). Analysis of dendritic endings in the same groups of neurons studied in the Sholl analysis (6 epileptic compared with 4 control cells) also showed a trend toward more dendritic branches that did not reach significance. These results suggest that soma size and dendritic length of SOM-EGFP interneurons are increased in epileptic mice.
Table 1.
Soma size of single hilar EGFP-expressing interneurons
| Somata From Control |
Somata From Epileptic |
||||
|---|---|---|---|---|---|
| Cell Number | Perimeter, μm | Area, μm2 | Cell Number | Perimeter, μm | Area, μm2 |
| 1 | 64 | 244 | 1 | 76 | 342 |
| 2 | 59 | 228 | 2 | 83 | 357 |
| 3 | 68 | 301 | 3 | 73 | 324 |
| 4 | 72 | 307 | 4 | 83 | 358 |
| 5 | 63 | 278 | 5 | 78 | 320 |
| 6 | 59 | 234 | 6 | 77 | 340 |
| 7 | 57 | 215 | 7 | 85 | 344 |
| Mean | 63.2 ± 2.1 (7)** | 258.2 ± 14.0 (7)** | 79.2 ± 1.7 (7)** | 340.8 ± 5.5 (7)** | |
Values are means ± SE (number of cells).
P < 0.01, difference between epilepsy and control groups.
Fig. 1.
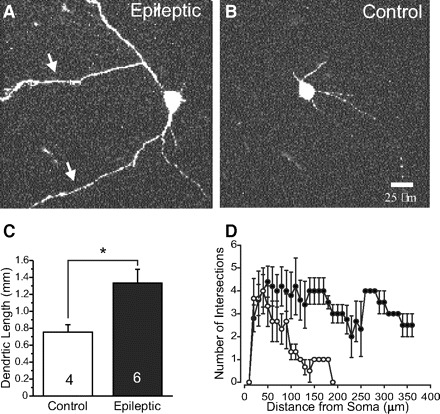
Morphological features of somatostatin–enhanced green fluorescent protein (SOM-EGFP) hilar interneurons in control and epileptic mice. A and B: images of representative biocytin-filled interneurons in epileptic (A) and control (B) mice. Arrows in A point to elongated dendrites. Calibration in B: 25 μm for A and B. C: graph of dendritic lengths in 6 epileptic and 4 control cells measured with Neurolucida from confocal image stacks. D: plot of results of modified Sholl analysis for neurons in C showing dendritic crossings (intersections) made by concentric circles separated by 10 μm, centered on the soma. SOM-EGFP cells from epileptic mice (black squares): 103 ± 30 dendritic crossings; controls (open circles): 30 ± 16 crossings (P = 0.14). Results confirm increases in dendritic length shown in C and show a trend toward increased dendritic branching at increasing distances. Quantification of somatic areas shown in Table 1.
The induction of epilepsy in these mice could potentially have changed the expression profile of the GFP transgene. To confirm that GFP expression remains confined to somatostatin-positive cells a one-in-six series of coronal sections from cerebral hemispheres were processed for somatostatin-immunoreactivity in four epileptic pilocarpine-treated GIN mice. A total of 75 hilar GFP-positive cells were examined and all 75 were somatostatin-immunoreactive. Therefore it is likely that all of the GFP-positive hilar neurons evaluated were somatostatin cells.
Most (95–100%) of the EGFP-expressing neurons in GIN mice are positive for SOM, but only 16% of SOM-containing neurons are positive for EGFP in GIN transgenic mice (Halabisky et al. 2006; Oliva Jr et al. 2000). Thus EGFP-expressing hilar neurons in GIN mice are a subset of SOM-expressing cells. Based on the heterogeneity even within the GIN interneurons of the somatosensory cortex (Halabisky et al. 2006) it is unlikely that they are representative of all SOM-positive interneurons. However, we are likely looking at the same population of SOM-positive interneurons from both control and epileptic animals.
Alterations in intrinsic membrane properties of SOM-EGFP-expressing interneurons in epileptic mice
The morphological characteristics described earlier are likely to affect the intrinsic membrane properties of the SOM neurons, their responses to synaptic inputs, and their functional role in the dentate gyrus network. To assess whether the physiological properties of SOM neurons are altered in epileptic mice, we performed whole cell patch-clamp recordings from EGFP-containing neurons within the hilus of the dentate gyrus. Increased somatic area and dendritic length should be accompanied by an increase in cell membrane area and thus whole cell membrane capacitance. Whole cell membrane capacitance was measured by determining the charge transfer during the initial dynamic current response to a 5 mV depolarizing step while the cell was voltage clamped at −60 mV (Fig. 2A). Membrane capacitance recorded from SOM-EGFP neurons from epileptic mice was significantly larger (65.8 ± 4.7 pF) than that in nonepileptic mice (40.7 ± 1.9 pF; Fig. 2B, Table 2), a finding consistent with the increased somatic area and dendritic length of these cells. To further examine differences in intrinsic membrane properties we also performed current-clamp experiments. Compared with controls, SOM-EGFP neurons from epileptic mice had a more depolarized Vm (−54.9 ± 1.5 vs. −58.9 ± 0.5 mV; P < 0.05), significant decreases in membrane input resistance (Table 2; cf. responses to hyperpolarizing current pulses in Fig. 3, A vs. B and graph of Fig. 3C), and slower membrane time constants (Fig. 3D, Table 2). Membrane capacitance and time constants had similar relative increases in SOM-EGFP neurons from epileptic versus control mice (Table 2; see discussion).
Fig. 2.

Membrane capacitance is increased in hilar interneurons from epileptic mice. A: representative current responses to a 5-mV voltage step in single SOM-EGFP hilar neurons in a control mouse (black) and an epileptic mouse (gray). Traces are averages of 20 sweeps low-pass filtered at 30 kHz. Dashed line indicates steady-state current during voltage step. See methods for derivation of capacitance measure. B: summary graph of capacitance. Number of cells indicated at bottom of bars. **P < 0.01, 2-sample t-test. Number of mice: 17 control, 7 epileptic.
Table 2.
Intrinsic membrane properties from SOM neurons in epileptic and control mice
| Property | Control | n | Epileptic | n | % Change | |
|---|---|---|---|---|---|---|
| τm, ms | 22.5 ± 1.6 | 36 | 37.4 ± 3.5 | 15 | P < 0.01 | 165.8 ± 19.5 |
| Cm, pF | 40.7 ± 1.9 | 43 | 65.8 ± 4.7 | 15 | P < 0.01 | 161.6 ± 13.7 |
| Rm, MΩ | 321.4 ± 25.0 | 41 | 233.7 ± 15.7 | 15 | P < 0.05 | 72.7 ± 7.5 |
Values are means ± SE. % Change: epileptic versus control mice.
Excitatory input onto EGFP-expressing interneurons is increased in epileptic mice
In current-clamp recordings, we noted many more spontaneous excitatory postsynaptic potentials (sEPSPs) in SOM-EGFP neurons from epileptic mice than from controls (Fig. 3B, arrowheads). In models of temporal lobe epilepsy, there is extensive remodeling of granule cell axons within the hilus (Buckmaster and Dudek 1999). To test whether this remodeling results in increased excitation of SOM-EGFP neurons, we obtained whole cell voltage-clamp recordings of spontaneous excitatory postsynaptic currents (sEPSCs) from fluorescently labeled hilar interneurons from control and epileptic mice at a holding potential (Vh) of −60 mV in control ACSF (Fig. 4A) in the presence of 10 μM gabazine to block inhibitory postsynaptic currents. Rise times of sEPSCs were slower in epileptic mice than those in controls, but decay times were similar (Table 3; see discussion). Although the frequency of sEPSCs in each group of neurons was variable (control range: 0.94–27.6 Hz; epileptic range: 2.2–35.8 Hz), analysis of a large sample showed that there was a significant (∼196%) increase in sEPSC frequency in SOM neurons from epileptic mice (Fig. 4B). These findings suggest that granule cell axon reorganization in this model of epilepsy might result in increased synaptic excitation of SOM-EGFP neurons (see discussion).
Fig. 4.

Increased frequency of spontaneous excitatory postsynaptic currents (sEPSCs) in SOM-EGFP hilar interneurons of epileptic mice. A: continuous recordings of sEPSCs from a representative cell in control (left) and epileptic mouse (right). B: summary graph of sEPSC frequencies in SOM-EGFP hilar interneurons in slices from control (white) and epileptic mice (black). Number of cells indicated at the bottom of bars. **P < 0.01, 2-sample t-test. Number of mice: 17 control, 7 epileptic.
Table 3.
Properties of spontaneous (s)EPSCs and miniature (m)EPSCs from SOM-EGFP neurons
| Peak Amplitude, pA |
Rise Time, ms |
Decay Time, ms |
||||
|---|---|---|---|---|---|---|
| Control | Epileptic | Control | Epileptic | Control | Epileptic | |
| sEPSCs | −31.1 ± 1.5 | −28.6 ± 1.8 | 1.43 ± 0.07 | 2.00 ± 0.16 | 4.78 ± 0.27 | 5.14 ± 0.41 |
| P > 0.1 | P < 0.01 | P > 0.1 | ||||
| mEPSCs | −27.1 ± 1.5 | −30.0 ± 2.6 | 1.62 ± 0.08 | 1.91 ± 0.12 | 4.88 ± 0.29 | 5.18 ± 0.99 |
| P > 0.1 | P < 0.05 | P > 0.5 | ||||
Increased excitatory input is due to an increased number of excitatory synapses
The higher sEPSC frequencies seen in SOM-EGFP neurons from epileptic mice may reflect an increased number of excitatory synapses, an increased probability of release (Pr) from terminals, or an increased rate of AP discharge from excitatory presynaptic neurons within the dentate gyrus and hippocampus. To begin to dissect each of these possibilities and assess their relative contribution to the increased sEPSC frequency seen in epileptic mice, we first recorded miniature (m)EPSCs in 1 μM tetrodotoxin (TTX). There was a significant increase in the frequency of mEPSCs recorded from SOM-EGFP neurons in epileptic versus control mice (∼243%; Fig. 5, A and B; P < 0.01). As in the case of sEPSCs, rise times were slower in epileptic mice than those in controls, but decay times were similar.
Fig. 5.

Increased frequency of miniature excitatory postsynaptic currents (mEPSCs) from SOM-EGFP hilar interneurons of epileptic mice. A: continuous recordings of mEPSCs from typical cells in a control mouse (left) and in an epileptic mouse (right). B: summary graph of mEPSC frequencies. C: summary graph showing the mean ratio of mEPSC to sEPSC frequency for cells from control and epileptic mice. Number of cells indicated at the bottom of bars. **P < 0.01, 2-sample t-test. mEPSC recordings obtained in artificial cerebrospinal fluid (ACSF) containing 1 μM tetrodotoxin (TTX). Number of mice: 14 control, 7 epileptic.
To assess whether the increase in mEPSC frequency might be due to an increase in Pr for transmitter from excitatory presynaptic terminals in epileptic mice (e.g., Li et al. 2005), we used a paired-pulse paradigm and measured the paired-pulse ratio (PPR; amplitude of response 2/response 1; Li et al. 2005; Markram and Tsodyks 1996; Thomson et al. 1993). Pairs of EPSCs were evoked at interstimulus intervals (ISIs) of 50, 20, and 100 ms by stimulation (twofold minimal stimulus threshold; 50 μs, 30–200 μA; see methods) within the granule cell layer adjacent to a SOM-EGFP neuron that was voltage clamped at −60 mV. Although PPR decreased at higher ISIs (Fig. 6), there was no significant difference in the PPR obtained at any ISI in slices from control versus epileptic mice (Fig. 6). Taken together, these results indicate that the increase in mEPSC frequency is likely related to an increase in the number of excitatory synapses or release sites, rather than an increase in Pr.
Fig. 6.

Paired-pulse ratios (PPRs) for evoked excitatory postsynaptic currents (eEPSCs) are not different between SOM-EGFP hilar interneurons from control and epileptic mice. A: representative traces from SOM-EGFP hilar interneurons in control and epileptic mice showing pairs of eEPSCs evoked with minimal (threshold) stimulation at a 50-ms interpulse interval. B: summary graph of PPRs for 20-, 50-, and 100-ms interpulse intervals. Number of cells indicated above (control, open symbols, dashed line) or below (epileptic, black, solid line) data points. No significant difference in PPR between control and epileptic neurons at any interpulse interval. PPR calculated as the peak amplitude of response 2/response 1. Number of mice: 3–4 control, 3–4 epileptic.
Firing of excitatory neurons presynaptic to SOM-EGFP neurons is not increased
The sEPSCs recorded in Fig. 4A contain both AP-related events and mEPSCs and we found there was a significant increase in the frequency of mEPSCs in SOM-EGFP neurons from epileptic versus control mice (Fig. 5B). To determine whether increased AP firing in excitatory presynaptic neurons might also contribute to increased sEPSC frequency in epileptic mice, we analyzed the mEPSC/sEPSC frequency ratio in the subpopulation of SOM-EGFP neurons of Fig. 4. In each neuron, we recorded EPSC frequency before and after application of TTX. The ratio was significantly increased in SOM-EGFP neurons from epileptic versus control mice (Fig. 5C), suggesting that the increase in sEPSC frequency seen in epileptic mice is mostly due to an increase in mEPSC frequency.
Most of the presynaptic excitatory input to SOM neurons within the hilus probably arises from granule cells (GCs) (Leranth et al. 1990). To further test the possibility that increased sEPSC frequency in epileptic mice might be attributable to increased activity of presynaptic excitatory neurons, we performed cell-attached recordings from GCs in slices from both control and epileptic mice. Firing rates of GCs in slices were too low (<0.1 Hz) to allow a valid statistical comparison (data not shown). However, low firing rates in single GCs do not rule out the possibility that increased sEPSC frequency in single SOM cells in epileptic mice is due to contacts from a greater number of GCs (see discussion).
To indirectly determine the contribution of AP firing of excitatory presynaptic neurons to sEPSCs in SOM interneurons, we compared mEPSC and sEPSC frequencies in the same group of cells. Assuming that TTX had little effect on mEPSC frequency, subtraction of mEPSC from sEPSC frequency should reveal the frequency of AP-related events in a given cell (see methods). Using this approach we found no significant difference between control and epileptic mice in the contribution of AP-related events to sEPSC frequency (control: 3.83 ± 0.88 Hz; epileptic 4.76 ± 1.70 Hz; P > 0.5). Together, these results suggest that the increase in sEPSC frequency is mainly due to an increase in non-AP-related events. Potential underestimates of the frequency of miniature currents in normal solution may have resulted from this approach if APs induced delayed, transient increases in mEPSC frequency (see Cummings et al. 1996). However, the frequency of AP-dependent release was quite low, judging from changes in sEPSC frequency after TTX perfusion (Figs. 4B and 5B), making a sizable contribution from this effect unlikely.
Evoked excitatory synaptic transmission onto EGFP-expressing SOM interneurons is increased in epileptic mice
If there is an increase in the number of excitatory presynaptic contacts onto SOM-EGFP neurons in epileptic mice, an increase in the slope of the input–output (I–O) curve might be expected. To obtain I–O curves, a stimulating electrode was placed as for PPR recordings, a threshold stimulus strength was found that evoked a minimal response (1T), and then input was varied by increasing the duration of the stimulus (2T, 3T, 5T,...; see methods; Fig. 7A) during whole cell recordings at Vh = −60 mV. Peak amplitudes of responses at lower stimulus intensities (1T, 2T, and 3T) were similar in the two groups (1T values: −20.7 ± 7.3 pA in control, n = 4, vs. −15.6 ± 5.5 pA in epileptic, n = 4; P > 0.5; Fig. 7B). In contrast, the amplitude of EPSCs evoked by stimuli of ≥5T was significantly larger in SOM-EGFP neurons from epileptic versus control mice (Fig. 7B). The I–O slope, expressed as pA/normalized stimulus unit, was steeper for SOM-EGFP neurons from epileptic than that from control mice (−5.15 ± 0.60 in control, n = 4, vs. −14.9 ± 0.8 in epileptic, n = 4; P < 0.01; ∼289% increase; Fig. 7C). This result is compatible with an increased excitatory innervation of SOM-EGFP neurons.
Fig. 7.

Amplitude of eEPSCs is increased in SOM-EGFP neurons from epileptic mice. A: representative superimposed traces showing EPSCs recorded from interneurons from both a control mouse and an epileptic mouse evoked by stimuli of increasing intensity delivered to the granule cell layer. Input–output (I–O) slopes for peak amplitudes of evoked EPSCs vs. stimulus intensity are steeper in cells from epileptic mice than from control mice. B: I–O plots of amplitudes of EPSCs evoked by 6 different stimulus intensities in 4 SOM-EGFP neurons from control (open symbols, dashed lines) and 4 from epileptic mice (black symbols, solid lines). Each line represents plot from a single cell. Error bars: SE from 3 repeated measures in each cell. C: mean amplitudes for eEPSCs in the groups of cells of B at the same stimulus increments. *P < 0.05; **P < 0.01. Number of mice: 4 control, 4 epileptic.
Firing frequency of EGFP-expressing interneurons is increased in epileptic mice
The increased frequency of EPSCs onto hilar SOM-EGFP neurons and the significant resting depolarization of Vm in epileptic mice could give rise to an increase in their inhibitory output, although other factors, such as an increase in membrane conductance (Fig. 3B), could counteract the increased excitatory input. To further assess this issue, we evaluated spontaneous firing frequency by obtaining cell-attached patches from hilar SOM-EGFP neurons in control and epileptic mice in normal bathing medium without pharmacological blockade of synaptic transmission. SOM-EGFP neurons from epileptic mice had a firing rate that was significantly greater than that from control mice (Fig. 8; ∼5 vs. ∼0.9 Hz; P < 0.01), suggesting the increased excitatory input onto these neurons. However, we cannot rule out that changes to the intrinsic properties of these neurons resulted in an increase of AP firing rate. Either way, the increased AP firing would presumably increase inhibitory output.
Fig. 8.

Increased firing frequency of hilar interneurons from epileptic mice. A: representative cell-attached recordings of action potentials of hilar SOM-EGFP neurons from a control mouse (left) and an epileptic mouse (right). B: summary graph of action potential frequency for 9 cells from 3 control mice (white circles) and 8 cells from 2 epileptic mice (black circles). Each point represents the average firing frequency for an individual cell. Horizontal bars: mean value for control (black) or epileptic cells (gray). **P < 0.01, 2-sample t-test.
DISCUSSION
These results show that in a mouse model of temporal lobe epilepsy, surviving dentate hilar SOM-containing interneurons have both structural and functional alterations, including increases in somatic and dendritic size, altered intrinsic membrane properties, increased excitatory synaptic innervations, and increased frequency of action potential generation. Such changes would be expected to affect the functional role of SOM interneurons within the epileptogenic dentate gyrus.
Increased interneuronal size has been previously described in animal models of epileptogenesis
Glutamic acid decarboxylase (GAD)67-containing interneurons in dentate gyrus and CA3 subfield enlarge after intraventricular kainic acid injections in rats (Shetty and Turner 2001) and hypertrophy of calbindin-containing interneurons, including their dendrites, occurs in microgyri that develop in neocortex after epileptogenic neonatal freeze lesions (Kharazia et al. 2003). Interneuronal hypertrophy also occurs in calbindin-containing interneurons of dentate gyri in human temporal lobe epilepsy (Magloczky et al. 2000), in interneurons of neocortex of children with epilepsy following perinatal brain damage (Marin-Padilla 1997), and possibly in some cases of human cortical dysplasia (Spreafico et al. 1998). Also of interest is the observation that interneuronal hypertrophy is present in a mouse model of ceroid lipofucinosis (Batten's disease; Cooper et al. 1999), in which seizures are present (Eliason et al. 2007; Griffey et al. 2006), as they are in the human disorder. It appears that different subtypes of interneurons can survive and enlarge in some epileptogenic pathophysiological processes, although in some models, interneuronal atrophy rather than hypertrophy has been found (Prince et al. 2009).
The mechanisms leading to increases in interneuronal size are not known, although a variety of experimental results suggest that brain-derived neurotrophic factor (BDNF) may be involved. BDNF is up-regulated by increased neuronal activity (Rocomora et al. 1996; Wetmore et al. 1994; Zafra et al. 1991; reviewed in Marty et al. 1997). Increases in BDNF mRNA and protein expression occur in dentate gyrus of rats following seizures (Binder et al. 1999; Danzer et al. 2004; Dugich-Djordjevic et al. 1992; Inoue et al. 1998; Isackson et al. 1991; Kokaia et al. 1996; Rocamara et al. 1992) and we have found a similar increase in BDNF immunoreactivity in hilar neurons of epileptic versus control GIN mice (Supplemental Fig. S1).1 This agent has known trophic effects on interneuronal growth and development (Jin et al. 2003; reviewed in Marty et al. 1997), including hypertrophy of GABAergic cells (Aguado et al. 2003), and may also be involved in hypertrophy of dentate granule cells (Inoue et al. 1998) and regulation of both excitatory (Danzer et al. 2008; Scharfman et al. 1999; Tamura et al. 2009) and inhibitory connectivity (Marty et al. 2000; Olofsdotter et al. 2000). BDNF TrkB receptor immunoreactivity is present on interneurons in the dentate hilus (Han et al. 1993) and on interneuronal axons and terminals (Drake et al. 1999), in addition to prominent expression in dentate granule cells.
The anatomical changes in SOM interneurons shown here and in other recent experiments (Zhang et al. 2009) would have potential effects on both their intrinsic properties and their function in the dentate circuit. Increased cell (somatic and dendritic) size would increase the total membrane area and result in an increase in whole cell membrane capacitance (Limón et al. 2005; Sooksawate et al. 2005) and a decrease in input resistance. Differences in the relative changes in these parameters may be due to different contributions of somatic versus dendritic membrane areas and conductances to the measurements obtained from whole cell somatic recordings, as well as potential contributions to measurements of somatic area by membrane infoldings not detectable by our methods of analysis. We did not assess possible mechanisms underlying the depolarized resting membrane potential in SOM cells of the epileptic animals. Injury-induced alterations in Na+/K+-ATPase activity (Ross and Soltesz 2000), Ih (Brauer et al. 2001), or a leak conductance might underlie this depolarization. The net effect of intrinsic changes and their effect on synaptic inputs, such as a decreased input resistance that will reduce the efficacy of synaptic inputs, is therefore hard to predict from the available data. However, the increase in excitatory synaptic input onto SOM cells is a significant consequence of the injury induced by the SE and possibly by subsequent seizures. There was an approximate doubling of sEPSC frequency (Fig. 4) that was predominantly a consequence of increased mEPSC frequency (Fig. 5C) rather than an increase in AP-dependent transmitter release. In the absence of a significant increase in Pr (Fig. 6), these results indicate a larger number of synapses most likely due to innervation by increased numbers of sprouting axonal terminals, although a contribution by boutons with multiple synapses to increased mEPSC frequency is possible (McNeill et al. 2003; White et al. 2004).
In addition, the increased dendritic lengths and branches in biocytin-filled SOM cells (Fig. 1, A, C, and D) would provide an increased dendritic territory for new synapse formation. The input–output results (Fig. 7) show no significant increase in peak amplitude of EPSCs evoked by stimuli close to threshold in control versus epileptic SOM cells, suggesting that sprouting axonal terminals from single presynaptic neurons do not hyperinnervate single SOM cells. Rather, sprouting presynaptic cells likely contact a greater number of postsynaptic SOM interneurons in epileptic mice. This result is similar to that reported in injured CA3 pyramidal cells of hippocampal slice cultures (McKinney et al. 2007) and in chronically epileptogenic neocortical slices (Jin et al. 2006). With increasing stimulus intensity, increased numbers of presynaptic elements are activated, generate APs, and release glutamate onto SOM cells. The increased slopes of the I–O relationships at higher stimulus intensities (Fig. 7, B and C) reflect recruitment of more presynaptic axons in slices from the epileptic mice.
One source of this hyperinnervation could be from sprouting mossy fibers of granule cells, although only a very small proportion (<5%) of synapses made by these axons innervate GABAergic dendrites in stratum moleculare (Buckmaster et al. 2002). However, granule cell projections in the hilus are likely contributors to new excitatory synaptic input to hilar SOM neurons because granule cell axon length in the hilus is significantly greater than that in controls in epileptic kainate-treated rats (Buckmaster and Dudek 1999). A more distal localization of the new excitatory synapses onto SOM cells is suggested by the significantly slower rise time for both spontaneous and miniature EPSCs without an alteration in decay time (Table 3). Other sources of new excitatory innervation of SOM interneurons might be CA3 collateral backprojections, mossy cells, and perforant path from entorhinal cortex. One consequence of this increased excitatory innervation, together with the small but significant depolarization of resting membrane potential noted earlier, is an increase in spontaneous AP generation by SOM cells in the slices from epileptic mice. This enhanced output, together with the increased axonal lengths of hilar SOM cells and the significant increase in their innervaton of granule cells (Zhang et al. 2009), would strengthen the feedback GABAergic inhibition in the dentate and could be regarded as a partial compensatory mechanism for loss of hilar SOM interneurons in the epileptogenic hippocampus.
DISCLOSURES
No conflicts of interest, financial or otherwise, are declared by the author(s).
Supplementary Material
Footnotes
The online version of this article contains supplemental data.
REFERENCES
- Aguado F, Carmona MA, Pozas E, Aguilo A, Martinez-Guijarro FJ, Alcantara S, Borrell V, Yuste R, Ibanez CF, Soriano E. BDNF regulates spontaneous correlated activity at early developmental stages by increasing synaptogenesis and expression of the K+/Cl− co-transporter KCC2. Development 130: 1267–1280, 2003 [DOI] [PubMed] [Google Scholar]
- Austin JE, Buckmaster PS. Recurrent excitation of granule cells with basal dendrites and low interneuron density and inhibitory postsynaptic current frequency in the dentate gyrus of macaque monkeys. J Comp Neurol 476: 205–218, 2004 [DOI] [PubMed] [Google Scholar]
- Bakst I, Avendano C, Morrison JH, Amaral DG. An experimental analysis of the origins of somatostatin-like immunoreactivity in the dentate gyrus of the rat. J Neurosci 6: 1452–1462, 1986 [DOI] [PMC free article] [PubMed] [Google Scholar]
- Binder DK, Routbort MJ, McNamara JO. Immunohistochemical evidence of seizure-induced activation of trk receptors in the mossy fiber pathway of adult rat hippocampus. J Neurosci 19: 4616–4626, 1999 [DOI] [PMC free article] [PubMed] [Google Scholar]
- Boyett JM, Buckmaster PS. Somatostatin-immunoreactive interneurons contribute to lateral inhibitory circuits in the dentate gyrus of control and epileptic rats. Hippocampus 11: 418–422, 2001 [DOI] [PubMed] [Google Scholar]
- Brauer AU, Savaskan NE, Kole MH, Plaschke M, Monteggia LM, Nestler EJ, Simburger E, Deisz RA, Ninnemann O, Nitsch R. Molecular and functional analysis of hyperpolarization-activated pacemaker channels in the hippocampus after entorhinal cortex lesion. FASEB J 15: 2689–2701, 2001 [DOI] [PubMed] [Google Scholar]
- Buckmaster PS, Dudek FE. Neuron loss, granule cell axon reorganization, and functional changes in the dentate gyrus of epileptic kainate-treated rats. J Comp Neurol 385: 385–404, 1997 [PubMed] [Google Scholar]
- Buckmaster PS, Dudek FE. In vivo intracellular analysis of granule cell axon reorganization in epileptic rats. J Neurophysiol 81: 712–721, 1999 [DOI] [PubMed] [Google Scholar]
- Buckmaster PS, Jongen-Rêlo AL. Highly specific neuron loss preserves lateral inhibitory circuits in the dentate gyrus of kainate-induced epileptic rats. J Neurosci 19: 9519–9529, 1999 [DOI] [PMC free article] [PubMed] [Google Scholar]
- Buckmaster PS, Yamawaki R, Zhang GF. Axon arbors and synaptic connections of a vulnerable population of interneurons in the dentate gyrus in vivo. J Comp Neurol 445: 360–373, 2002 [DOI] [PubMed] [Google Scholar]
- Buckmaster PS, Zhang GF, Yamawaki R. Axon sprouting in a model of temporal lobe epilepsy creates a predominantly excitatory feedback circuit. J Neurosci 22: 6650–6658, 2002 [DOI] [PMC free article] [PubMed] [Google Scholar]
- Cooper JD, Messer A, Feng AK, Chua-Couzens J, Mobley WC. Apparent loss and hypertrophy of interneurons in a mouse model of neuronal ceroid lipofuscinosis: evidence for partial response to insulin-like growth factor-1 treatment. J Neurosci 19: 2556–2567, 1999 [DOI] [PMC free article] [PubMed] [Google Scholar]
- Cummings DD, Wilcox KS, Dichter MA. Calcium-dependent paired-pulse facilitation of miniature EPSC frequency accompanies depression of EPSCs at hippocampal synapses in culture. J Neurosci 16: 5312–5323, 1996 [DOI] [PMC free article] [PubMed] [Google Scholar]
- Danzer SC, He X, McNamara JO. Ontogeny of seizure-induced increases in BDNF immunoreactivity and TrkB receptor activation in rat hippocampus. Hippocampus 14: 345–355, 2004 [DOI] [PubMed] [Google Scholar]
- de Lanerolle NC, Kim JH, Robbins RJ, Spencer DD. Hippocampal interneuron loss and plasticity in human temporal lobe epilepsy. Brain Res 495: 387–395, 1989 [DOI] [PubMed] [Google Scholar]
- Eliason SL, Stein CS, Mao Q, Tecedor L, Ding SL, Gaines DM, Davidson BL. A knock-in reporter model of Batten disease. J Neurosci 27: 9826–9834, 2007 [DOI] [PMC free article] [PubMed] [Google Scholar]
- Engel J, Jr, Williamson PD, Wieser H-G. Mesial temporal lobe epilepsy. In: Epilepsy: A Comprehensive Textbook, edited by Engel J, Jr, Pedley TA. Philadelphia, PA: Lippincott-Raven, 1997, p. 2417–2426 [Google Scholar]
- Esclapez M, Houser CR. Somatostatin neurons are a subpopulation of GABA neurons in the rat dentate gyrus: evidence from colocalization of pre-prosomatostatin and glutamate decarboxylase messenger RNAs. Neuroscience 64: 339–355, 1995 [DOI] [PubMed] [Google Scholar]
- Freund TF, Ylinen A, Miettinen R, Pitkänen, Lahtinen H, Baimbridge KG, Riekkinen PJ. Pattern of neuronal death in the rat hippocampus after status epilepticus. Relationship to calcium binding protein content and ischemic vulnerability. Brain Res Bull 28: 27–38, 1991 [DOI] [PubMed] [Google Scholar]
- Griffey MA, Wozniak D, Wong M, Bible E, Johnson K, Rothman SM, Wentz AE, Cooper JD, Sands MS. CNS-directed AAV2-mediated gene therapy ameliorates functional deficits in a murine model of infantile neuronal ceroid lipofuscinosis. Mol Ther 13: 538–547, 2006 [DOI] [PubMed] [Google Scholar]
- Halabisky B, Shen F, Huguenard JR, Prince DA. Electrophysiological classification of somatostatin-positive interneurons in mouse sensorimotor cortex. J. Neurophysiol 96: 834–845, 2006 [DOI] [PubMed] [Google Scholar]
- Han ZS, Buhl EH, Lorinczi Z, Somogyi P. A high degree of spatial selectivity in the axonal and dendritic domains of physiologically identified local-circuit neurons in the dentate gyrus of the rat hippocampus. Eur J Neurosci 5: 395–410, 1993 [DOI] [PubMed] [Google Scholar]
- Houser CR, Esclapez M. Vulnerability and plasticity of the GABA system in the pilocarpine model of spontaneous recurrent seizures. Epilepsy Res 26: 207–218, 1996 [DOI] [PubMed] [Google Scholar]
- Isackson PJ, Huntsman MM, Murray KD, Gall CM. BDNF mRNA expression is increased in adult rat forebrain after limbic seizures: temporal patterns of induction distinct from NGF. Neuron 6: 937–948, 1991 [DOI] [PubMed] [Google Scholar]
- Jin X, Prince DA, Huguenard JR. Enhanced excitatory synaptic connectivity in layer V pyramidal neurons of chronically injured epileptogenic neocortex in rats. J Neurosci 26: 4891–4900, 2006 [DOI] [PMC free article] [PubMed] [Google Scholar]
- Katona I, Acsády L, Freund TF. Postsynaptic targets of somatostatin-immunoreactive interneurons in the rat hippocampus. Neuroscience 88: 37–55, 1999 [DOI] [PubMed] [Google Scholar]
- Kharazia VN, Jacobs KM, Prince DA. GluR1 and calbindin expression are altered in interneurons of neocortical microgyral malformations. Neuroscience 120: 207–218, 2003 [DOI] [PubMed] [Google Scholar]
- Kosaka T, Wu J-Y, Benoit R. GABAergic neurons containing somatostatin-like immunoreactivity in the rat hippocampus and dentate gyrus. Exp Brain Res 71: 388–398, 1988 [DOI] [PubMed] [Google Scholar]
- Lee W-CA, Huang H, Feng G, Sanes JR, Brown EN, So PT, Nedivi E. Dynamic remodeling of dendritic arbors in GABAergic interneurons of adult visual cortex. PLoS Biol 4: e29, 2006 [DOI] [PMC free article] [PubMed] [Google Scholar]
- Leranth C, Malcolm AJ, Frotscher M. Afferent and efferent synaptic connections of somatostatin-immunoreactive neurons in the rat fascia dentata. J Comp Neurol 295: 111–122, 1990 [DOI] [PubMed] [Google Scholar]
- Lowenstein DH, Thomas MJ, Smith DH, McIntosh TK. Selective vulnerability of dentate hilar neurons following traumatic brain injury: a potential mechanistic link between head trauma and disorders of the hippocampus. J Neurosci 12: 4846–4853, 1992 [DOI] [PMC free article] [PubMed] [Google Scholar]
- Maglóczky Zs, Wittner L, Borhegyi Zs, Halász P, Vajda J, Czirják S, Freund TF. Changes in the distribution and connectivity of interneurons in the epileptic human dentate gyrus. Neuroscience 96: 7–25, 2000 [DOI] [PubMed] [Google Scholar]
- Margerison JH, Corsellis JAN. Epilepsy and the temporal lobes. Brain 89: 499–530, 1966 [DOI] [PubMed] [Google Scholar]
- Marin-Padilla M. Developmental neuropathology and impact of perinatal brain damage. II. White matter lesions of the neocortex. J Neuropathol Exp Neurol 56: 219–235, 1997 [DOI] [PubMed] [Google Scholar]
- Marty S, Berzaghi M, Berninger B. Neurotrophins and activity-dependent plasticity of cortical interneurons. Trends Neurosci 20: 198–202, 1997 [DOI] [PubMed] [Google Scholar]
- Marty S, Wehrle R, Sotelo C. Neuronal activity and brain-derived neurotrophic factor regulate the density of inhibitory synapses in organotypic slice cultures of postnatal hippocampus. J Neurosci 20: 8087–8095, 2000 [DOI] [PMC free article] [PubMed] [Google Scholar]
- Mathern GW, Babb TL, Pretorius JK, Leite JP. Reactive synaptogenesis and neuron densities for neuropeptide Y, somatostatin, and glutamate decarboxylase immunoreactivity in the epileptogenic human fascia dentata. J Neurosci 15: 3990–4004, 1995 [DOI] [PMC free article] [PubMed] [Google Scholar]
- McKinney RA, Debanne D, Gahwiler BH, Thompson SM. Lesion-induced axonal sprouting and hyperexcitability in the hippocampus in vitro: implications for the genesis of posttraumatic epilepsy. Nat Med 3: 990–996, 1997 [DOI] [PubMed] [Google Scholar]
- McNeill TH, Brown SA, Hogg E, Cheng HW, Meshul CK. Synapse replacement in the striatum of the adult rat following unilateral cortex ablation. J Comp Neurol 467: 32–43, 2003 [DOI] [PubMed] [Google Scholar]
- Milner TA, Bacon CE. Ultrastructural localization of somatostatin-like immunoreactivity in the rat dentate gyrus. J Comp Neurol 290: 544–560, 1989 [DOI] [PubMed] [Google Scholar]
- Oliva AA, Jr, Jiang M, Lam T, Smith KL, Swann JW. Novel hippocampal interneuronal subtypes identified using transgenic mice that express green fluorescent protein in GABAergic interneurons. J Neurosci 20: 3354–3368, 2000 [DOI] [PMC free article] [PubMed] [Google Scholar]
- Oliva AA, Jr, Lam T, Swann JW. Distally directed dendrotoxicity induced by kainic acid in hippocampal interneurons of green fluorescent protein-expressing transgenic mice. J Neurosci 22: 8052–8062, 2002 [DOI] [PMC free article] [PubMed] [Google Scholar]
- Patrick SL, Connors BW, Landisman CE. Developmental changes in somatostatin-positive interneurons in a freeze-lesion model of epilepsy. Epilepsy Res 70: 161–171, 2006 [DOI] [PubMed] [Google Scholar]
- Prince DA, Parada I, Scalis K, Graber K, Jin X, Shen F. Epilepsy following cortical injury: cellular and molecular mechanisms as targets for potential prophylaxis. Epilepsia 50, Suppl. 2: 30–40, 2009 [DOI] [PMC free article] [PubMed] [Google Scholar]
- Racine RJ. Modification of seizure activity by electrical stimulation: II. Motor seizure. Electroencephalogr Clin Neurophysiol 32: 281–294, 1972 [DOI] [PubMed] [Google Scholar]
- Rall W. Theory of physiological properties of dendrites. Ann NY Acad Sci 96: 1071–1092, 1962 [DOI] [PubMed] [Google Scholar]
- Robbins RJ, Brines ML, Kim JH, Adrian T, de Lanerolle N, Welsh S, Spencer DD. A selective loss of somatostatin in the hippocampus of patients with temporal lobe epilepsy. Ann Neurol 29: 325–332, 1991 [DOI] [PubMed] [Google Scholar]
- Ross ST, Soltesz I. Selective depolarization of interneurons in the early posttraumatic dentate gyrus: involvement of the Na(+)/K(+)-ATPase. J Neurophysiol 83: 2916–2930, 2000 [DOI] [PubMed] [Google Scholar]
- Schwarzer C, Williamson JM, Lothman EW, Vezzani A, Sperk G. Somatostatin, neuropeptide Y, neurokinin B and cholecystokinin immunoreactivity in two chronic models of temporal lobe epilepsy. Neuroscience 69: 831–845, 1995 [DOI] [PubMed] [Google Scholar]
- Shetty AK, Turner DA. Glutamic acid decarboxylase-67-positive hippocampal interneurons undergo a permanent reduction in number following kainic acid-induced degeneration of CA3 pyramidal neurons. Exp Neurol 169: 276–297, 2001 [DOI] [PubMed] [Google Scholar]
- Sloviter RS. Decreased hippocampal inhibition and a selective loss of interneurons in experimental epilepsy. Science 235: 73–76, 1987 [DOI] [PubMed] [Google Scholar]
- Sloviter RS, Zappone CA, Harvey BD, Bumanglag AV, Bender RA, Frotscher M. “Dormant basket cell” hypothesis revisited: relative vulnerabilities of dentate gyrus mossy cells and inhibitory interneurons after hippocampal status epilepticus in the rat. J Comp Neurol 459: 44–76, 2003 [DOI] [PubMed] [Google Scholar]
- Somogyi P, Hodgson AJ, Smith AD, Nunzi MG, Gorio A, Wu J-Y. Different populations of GABAergic neurons in the visual cortex and hippocampus of cat contain somatostatin- or cholecystokinin-immunoreactive material. J Neurosci 4: 2590–2630, 1984 [DOI] [PMC free article] [PubMed] [Google Scholar]
- Sooksawate T, Saito Y, Isa T. Electrophysiological and morphological properties of identified crossed tecto-reticular neurons in the rat superior colliculus. Neurosci Res 52: 174–184, 2005 [DOI] [PubMed] [Google Scholar]
- Sun C, Mtchedlishvili Z, Bertram EH, Erisir A, Kapur J. Selective loss of dentate hilar interneurons contributes to reduced synaptic inhibition of granule cells in an electrical stimulation-based animal model of temporal lobe epilepsy. J Comp Neurol 500: 876–893, 2007 [DOI] [PMC free article] [PubMed] [Google Scholar]
- Sundstrom LE, Brana C, Gatherer M, Mepham J, Rougier A. Somatostatin- and neuropeptide Y-synthesizing neurons in the fascia dentata of humans with temporal lobe epilepsy. Brain 124: 688–697, 2001 [DOI] [PubMed] [Google Scholar]
- Sutula T, Cascino G, Cavazos J, Parada I, Ramirez L. Mossy fiber synaptic reorganization in the epileptic human temporal lobe. Ann Neurol 26: 321–330, 1989 [DOI] [PubMed] [Google Scholar]
- Tóth K, Wittner L, Urbán Z, Doyle WK, Buzsáki G, Shigemoto R, Freund TF, Maglóczky Z. Morphology and synaptic input of substance P receptor-immunoreactive interneurons in control and epileptic human hippocampus. Neuroscience 144: 495–508, 2007 [DOI] [PMC free article] [PubMed] [Google Scholar]
- Vicario-Abejón C, Collin C, McKay RDG, Segal M. Neurotrophins induce formation of functional excitatory and inhibitory synapses between cultured hippocampal neurons. J Neurosci 18: 7256–7271, 1998 [DOI] [PMC free article] [PubMed] [Google Scholar]
- Wetmore C, Olson L, Bean AJ. Regulation of brain-derived neurotrophic factor (BDNF) expression and release from hippocampal neurons is mediated by non-NMDA type glutamate receptors. J Neurosci 14: 1688–1700, 1994 [DOI] [PMC free article] [PubMed] [Google Scholar]
- White EL, Weinfeld E, Lev DL. Quantitative analysis of synaptic distribution along thalamocortical axons in adult mouse barrels. J Comp Neurol 479: 56–69, 2004 [DOI] [PubMed] [Google Scholar]
- Zafra F, Castren E, Thoenen H, Lindholm D. Interplay between glutamate and gamma-aminobutyric acid transmitter systems in the physiological regulation of brain-derived neurotrophic factor and nerve growth factor synthesis in hippocampal neurons. Proc Natl Acad Sci USA 88: 10037–10041, 1991 [DOI] [PMC free article] [PubMed] [Google Scholar]
- Zhang W, Yamawaki R, Wen X, Uhl J, Diaz J, Prince DA, Buckmaster PS. Surviving hilar somatostatin interneurons enlarge, sprout axons, and form new synapses with granule cells in a mouse model of temporal lobe epilepsy. J Neurosci 29: 14247–14256, 2009 [DOI] [PMC free article] [PubMed] [Google Scholar]
Associated Data
This section collects any data citations, data availability statements, or supplementary materials included in this article.