

Abstract
We conducted a large-scale gene expression screen using the 3,200 cDNA probe microarray developed specifically for Ursus americanus to detect expression differences in liver and skeletal muscle that occur during winter hibernation compared with animals sampled during summer. The expression of 12 genes, including RNA binding protein motif 3 (Rbm3), that are mostly involved in protein biosynthesis, was induced during hibernation in both liver and muscle. The Gene Ontology and Gene Set Enrichment analysis consistently showed a highly significant enrichment of the protein biosynthesis category by overexpressed genes in both liver and skeletal muscle during hibernation. Coordinated induction in transcriptional level of genes involved in protein biosynthesis is a distinctive feature of the transcriptome in hibernating black bears. This finding implies induction of translation and suggests an adaptive mechanism that contributes to a unique ability to reduce muscle atrophy over prolonged periods of immobility during hibernation. Comparing expression profiles in bears to small mammalian hibernators shows a general trend during hibernation of transcriptional changes that include induction of genes involved in lipid metabolism and carbohydrate synthesis as well as depression of genes involved in the urea cycle and detoxification function in liver.
Keywords: gene expression, hibernation, translation, RNA binding protein motif 3
mammalian hibernation is a physiological and behavioral adaptation involving a coordinated suppression of heat production and body temperature wherein whole body metabolism and energy demand are significantly reduced over several days to several months. During hibernation, heart and respiration rates, blood flow, and oxygen consumption decrease dramatically to <10% of normal or basal rates (2, 4). These physiological changes do not represent a loss of homeostasis but instead are precisely controlled and spontaneously reversible, and they allow individual animals to survive highly seasonal or unpredictable environments where food availability becomes lacking (7, 12). The molecular and genetic basis of hibernation in small mammals has only recently begun to be described, and little is known about its evolutionary history. Hibernating species have been found in diverse families among seven orders of mammals (26), however, and the interspersed phylogenetic distribution of hibernating and nonhibernating species has led to the hypothesis that rather than requiring the creation of novel gene products, hibernation results from the differential expression of genes that exist widely among mammals (35).
Microarray technology provides powerful means for the unbiased detection of differences in expression of thousands of genes in a single hybridization experiment (14). In contrast to single-gene expression analysis, the genome-wide approach also allows for identification of coordinated transcriptional changes in functional groups of regulatory genes within metabolic and signaling pathways. Recent studies of differential gene expression at the genomic scale on several species of hibernating small mammals have detected expression changes for hundreds of genes when comparing animals sampled in different stages during hibernation and nonhibernating periods (5, 42, 43, 44). Coordinated transcriptional changes associated with hibernation have identified groups of co-regulated genes involved in carbohydrate, fatty acid and protein metabolism, detoxification, and molecular transport.
The black bear (Ursus americanus) provides a unique example of hibernation in mammals. Unlike small hibernators such as ground squirrels (<1 kg) that enter deep levels of torpor with body temperatures near 0°C, hibernating black bears (30–150 kg) remain aware and capable of moving throughout hibernation (25). Although bears neither eat, drink, defecate, nor urinate during a 3–6 mo hibernation season (28), their core body temperature decreases to only 30–36°C (3). Metabolic rate in hibernating bears is reduced by 20–50%, and it takes 2–3 wk after emergence and a return to normal body temperature for resting metabolic rate to recover to normal levels (40).
In this study, we applied microarray techniques using cDNA probes developed specifically for U. americanus to detect gene expression differences in liver and skeletal muscle that occur during winter hibernation compared with animals sampled during summer. We want to identify changes in functional groups of co-regulated genes to obtain insight into the biological significance of transcriptional changes associated with the hibernating phenotype in black bears. To reveal general and species-specific trends in transcriptional changes during hibernation, we compare differentially expressed genes detected in hibernating bears to transcriptional changes that have been recently reported for small mammalian hibernators (42–44).
MATERIALS AND METHODS
Animals.
American black bears (31–143 kg) were captured May-July from the field either near McGrath or Anchorage, AK. Bears were transferred to Fairbanks, AK, where they were held individually in a shaded outdoor holding facility. To minimize effects of sex and age on intragroup variation in gene expression, only males >2 yr old are compared in these experiments. In summer and fall, bears were fed dog chow and fruits and vegetables and had continuous access to water. To represent the nonhibernating condition, bears (n = 5) that were still feeding and active were euthanized and sampled for tissues between late May and early October. Food was withdrawn 24 h before these animals were killed. Bears in the hibernating condition were euthanized for tissue sampling between 1–27 March (n = 6). These animals were without food since October 27 and had been offered a diminishing food ration for the 2 wk prior. Animal protocols were approved by the University of Alaska Fairbanks Institutional Animal Care and Use Committee (protocols no. 02-39, 02-44, 05-55, 05-57) and U.S. Army Medical Research and Materiel Command (USAMRMC) Animal Care and Use Review Office (proposal Number 05178001).
Physiological monitoring and tissue harvesting.
For monitoring of physiological conditions, bears used in hibernation experiments were surgically implanted in late November with telemetry transmitters for core body temperature (Mini Mitter, model TM, 27 mHz) and transmitters for electrocardiogram and electromyogram monitoring (Data Sciences International TL10M4-D70-CCP or TL10M4-D70-EEET). One bear received a model T28F-14B (Konigsberg Instruments, Pasadena, CA), which transmitted both body core temperature and biopotentials. All transmitters were implanted intraperitoneally, except one bear where the biopotential transmitter was implanted between the shoulder blades (TL10M4-D70-EEET) for electroencephalogram recordings. Beginning in late November, bears were housed in individual outdoor enclosures on the University of Alaska Fairbanks campus that had dens and straw material for nests. Dens were double-walled boxes made from 2.5-cm-thick plywood or high-density polyethylene with inside dimensions of ∼0.8 × 1.0 × 1.0 m with 5 cm of Styrofoam between walls. Each nest box had a 46 × 46 cm door opening that was fitted with a double-layered breakaway door sealed by weather stripping and kept in place by metal clamps. The dens were instrumented with antennas and a thermocouple to monitor temperature. For respirometry measurements, air was continuously drawn from an exit hole at back of the den through insulated, heat-taped air tubes that connected to an automated respirometry system in an instrument hut 50 m away. Air flow from the dens was measured with mass flow-meters (model HFM-201 Teledyne Electronic technologies, Hastings Instruments, Hampton, VA; or Brooks model 5861E, Coastal Instruments, Newberg, OR; both 0–50 l/min). Subsamples were directed through solenoids for multiplexing between animals every 5 min and connection to outside air and calibration gases and at 1 and 3 h intervals, respectively. Air was then passed though a Nafion tube-based countercurrent moisture exchanger for drying before it was passed to the gas analyzers (model S3-A, Applied Electrochemistry or Oxzilla oxygen analyzers, CA2A or CA-10A CO2 analyzer, Sable systems International). Signals were digitized and results calculated on line with our own software (a modified version of LabGraph, 39). O2 consumption and CO2 production were corrected for respiratory volume change according to the principle of the Haldane transformation (15, 24, 41). The accuracy of the total system was verified before and after each study period by burning known amounts of ethanol with a small lamp in the respirometry chamber. The system was considered satisfactory if O2 consumption was within 4% of that expected.
On the day of tissue harvesting, bears were immobilized between 9:30 and 15:00 using Telazol (8–10 mg/kg) administered via pole syringe using a 16 g 1.5-inch needle or a CO2-powered pistol to administer Telazol via a standard Palmer dart. Immobilized bears were transported to a necropsy suite in a nearby building. In four hibernating bears and two summer bears, measurement of oxygen consumption during immobilization was performed with a respirometry system during blood sampling just prior to euthanasia. A tracheal tube was inserted and connected through a mass flow-meter and a subsampling pump through a Nafion dryer to gas analyzers (Sable Systems, Hederson, NV, model FC-1B or Oxzilla O2 analyzer, CA-2A CO2 analyzers, or FoxBox O2/CO2 analyzers). Flow rate was initially adjusted according to the ventilation of the bear at 10–15 l/min. The accuracy of this respirometry system was checked with ethanol burns as described above. Between when bears were first disturbed and the beginning of tissue sampling, 40–65 min elapsed. After at least 15 min of respirometry recordings, bears were euthanized by an intravenous injection of pentobarbital with death assessed by termination of heart beats as assessed with a stethoscope. Tissue collection followed immediately with samples frozen in liquid nitrogen and was complete within 12 min.
RNA preparation.
Total RNA was extracted from frozen tissues stored at −80°C by grinding in liquid nitrogen with mortar and pestle and using RNeasy Kit (Qiagen). Skeletal muscle tissue was treated by proteinase K, and RNA was extracted by using RNeasy Fibrous Tissue Kit (Qiagen). All RNA samples were processed by DNase I (Qiagen) treatment. For cDNA library construction, mRNA was selected from total RNA with the oligo(dT) cellulose by the use of Poly(A) Purist Kit (Ambion). RNA quality was assessed by 1.2% agarose gel electrophoresis and concentration was measured by using Nanodrop.
Developing genomic resources.
Normalized cDNA libraries enriched for full-length inserts were constructed from brain, liver, testis, and skeletal muscle. For each library except for testis and liver (hibernating animal only), we pooled mRNA samples isolated from hibernating and summer active bears. During reverse transcription, adaptors containing the asymmetrical restriction sites for SfiI were incorporated into the first strand of the cDNA using a SMART template-switching mechanism at the 5′-end of the transcript (47). To decrease redundancy, all libraries were normalized by hybridization of the single-strand cDNA with the same pool of mRNA that was used for first-strand synthesis (9). Second-strand synthesis of cDNA was performed by the use of primer extension PCR (Advantage 2 Taq Polymerase, Clontech) with limited (10–15) number of cycles. The double-stranded cDNA was digested with SfiI, size fractionated through Sephacryl-500 column (Amersham), and directionally cloned into the SfiI predigested vector pDNR-LIB (Clontech). Normalized full-length cDNA library from liver was constructed without SMART template-switching and PCR amplification as described (8), and inserts were cloned into vector pCMV-SPORT6 (Invitrogen). Libraries were transformed to DH10B Escherichia coli (Invitrogen) by using electroporation. Full details of the cDNA libraries constructed for this study are available at http://compbio.dfci.harvard.edu/tgi/cgi-bin/tgi/T_release.pl?gudb=bear.
From each library, expressed sequence tags (EST) were generated from the 5′-end with the universal M13 forward primer. In total, after filtering off vector contamination and mtDNA inserts, 6,294 high-quality ESTs were first clustered and then assembled into 4,002 unique Tentative Consensus (TC) sequences using the TCICL software package (30) and annotated by searching against a nonredundant protein database. We were able to annotate 3,398 sequences based on their homology or similarity with previously characterized genes. The ESTs and resulting TC sequences used in this study are available from the Black Bear Gene Index (Release 1.0, http://compbio.dfci.harvard.edu/tgi/cgi-bin/tgi/T_release.pl?gudb=bear).
A total of 3,200 unique annotated cDNA inserts were PCR amplified and printed on nylon membrane with a Biorobotics arrayer in the Microarray core facility (the Wistar Institute http://www.wistar.org/research_facilities/facilities/genomics/).
Hybridization.
Samples of total RNA were linearly amplified with Illumina TotalPrep RNA Amplification Kit (Ambion), and 1.6 μg of the amplified RNA was labeled with 65 μCi of [33P]dCTP as previously described (20). All RNA samples were amplified, labeled, and hybridized in the same batch. The hybridization was carried out for 18 h at 42°C in 4 ml of MicroHyb buffer (Invitrogen). Filters were rinsed at room temperature with 2× SSC/1% SDS to remove residual probe and MicroHyb solution and then transferred to preheated wash solutions in a temperature-controlled shaking water bath. Filters were washed twice for 30 min in 1.5 l of 2× SSC/1% SDS at 50°C and then once for 30 min in 1.5 l of 0.5× SSC/1% SDS at 55°C. Filters were then exposed to phosphorimager screens for four days and scanned at 50-μm resolution in a Storm Phosphorimager. Image analysis was performed with the ImaGene program (Biodiscovery).
Microarray data analysis.
Only nonempty spots with signal median density exceeding double background median in all individuals were included in the analysis. Background-corrected signal was obtained by subtracting local background median density from signal median density. Background-corrected signals were divided by their median on the array to obtain the normalized median densities representing the normalized expression values. To select genes that exhibited significant differences between hibernating and summer active bears, we used two-sided t-test for each feature; the lower and upper bounds of the feature P value was estimated by permutation testing (13). The false discovery rate (q value) for each feature was estimated by the procedure described by Storey and Tibshirani (36). Analysis of microarray data was performed with the GenePattern Software (33) available at http://www.broad.mit.edu/cancer/software/genepattern/.
The genes demonstrating significant hybridization signal on the arrays were classified according to their Gene Ontology (GO) categories of the biological processes. For each spot with a significant expression value, a gene identifier was obtained from the UniProt or Entrez Gene databases. Lists of all significant genes on the array and differentially expressed genes were uploaded to GO miner (http://discover.nci.nih.gov/gominer/index.jsp). The enrichment in each category was calculated as the proportion of differentially expressed genes relative to the expected proportion on the array. The significance of enrichment or depletion for each GO category was estimated by one-sided Fisher exact test. The false discovery rate was assessed by resampling the total significant genes on the array (45, 46). To validate the results of GO miner, we estimate enrichment in the protein biosynthesis (translation) category by using Gene Set Enrichment Analysis (GSEA, http://www.broad.mit.edu/gsea/index.jsp). The major advantage of this method is that, unlike GO miner, GSEA estimates enrichment by considering all of the genes with significant signals in an experiment, not only those above arbitrary cutoffs for significance of expression differences, false discovery rate, and fold-change (37). Genes were ranked according to the correlation between their expression values and the phenotype class distinction by using the signal-to-noise ratio. An enrichment score (ES) that reflects the degree to which genes involved in translation are overrepresented at the extremes (top or bottom) of the entire ranked list of genes was calculated. The ES was normalized to account for the size of the translation gene set presented in the experiment, yielding a normalized enrichment score (NES). The statistical significance of the NES was estimated by using phenotype-based permutation test (37).
All microarray data series were submitted to National Center for Biotechnology Information Gene Expression Omnibus (GEO) with accession number GSE15099.
Quantitative real-time PCR.
We validated select microarray experiments by 320 quantitative real-time PCR tests (RT-PCR) using the same RNA samples. Nineteen genes were tested in liver and nine genes in muscle tissue. Reference genes, Hnrpf for liver and Hint1 for muscle, were chosen based on the stability of expression values across all samples obtained from the microarray experiments. The stability of expression values for the two probes selected as endogenous control was consistently supported by repeated RT PCR tests without references. Total RNA concentrations were measured with a NanoDrop ND-1000 spectrophotometer, and cDNA was synthesized from 0.5 μg of total RNA from each sample. The reverse transcription was carried out with MiltiScribe reverse transcriptase (Applied Biosystems) with oligo d(T)16 primer in 20 μl reactions at 25°C for 10 min, 48°C for 30 min, and at 95°C for 5 min. The synthesized cDNA was diluted 10× with RNase-free water, and 4 μl of diluted cDNA was used in the 20 μl-volume real-time PCR. Primers were designed with the Primer Express software (Applied Biosystems) using EST sequences (Supplemental Table S2),1 and real-time PCR was performed in triplicates with SYBR Green Master Mix (Applied Biosystems) on an ABI-7900 HT. Thermal cycling parameters were 50°C for 2 min of incubation, 95°C for 10 min of Taq activation, and 40 cycles of 95°C for 15 s and 60°C for 1 min. Controls with no template were taken to exclude contamination, and controls with no reverse transcriptase but all other components were taken to exclude false amplification from genomic DNA. Specificity of amplification was checked with the melting curve analysis and agarose gel electrophoresis. Five 10-fold dilutions of a sample with mixed cDNA were used for a standard curve for each primer set. All reactions showed efficiency no less than 80%, and standard curve correlation coefficients were 0.98 or higher. We tested a difference in gene expression between hibernating and summer active black bears by the Pfaffl method (31) that takes into account PCR efficiencies of target and reference genes. We calculated the fold-change in level of expression of a target gene relative to a reference gene for each sample and then compared the values for hibernating and summer active bears using Student's t-test as described by Livak and Schmittgen (22).
RESULTS
Body temperature and metabolism.
Black bears sampled during hibernation had core body temperatures of 34.2 ± 0.5°C (mean ± SD, n = 6) and minimum rates of oxygen consumption of 0.083 ± 0.008 ml·g−1·h−1 (n = 5), when measured over at least a 0.5 h interval 2–9 h before euthanasia.
Respiratory quotient during this interval was 0.73 ± 0.02 (n = 5). In four bears for which postimmobilization measurements were made, body temperature decreased from 34.2 ± 0.7°C to 33.3 ± 1.1°C (P < 0.05). Metabolic rate had increased to 0.113 ± 0.017 ml·g−1·h−1 (P < 0.05) just prior to euthanasia. Ambient temperatures during the study period were −10 to −35°C with short periods with extremes of −43 to 5°C. Temperatures within bear dens were typically 10°C above the outside temperature. Bears lost 4.7 ± 0.8% (n = 6) of their body mass per month during the 4–5 mo hibernation period. Metabolic rates measured in two fasted and anesthetized bears during summer were 0.252 and 0.213 ml·g−1·h−1 and averaged 0.233 ml·g−1·h−1; body temperatures were 37.18 and 37.13°C. Thus, immediately prior to sampling, metabolic rate of hibernating bears was 36–49% and body temperature averaged 3.75°C lower compared with values in summer bears.
Differentially expressed genes.
Combining results from all liver samples, we found that signals from 1,278 probes showed median intensities that were significant. A total of 1,227 probes showed significant signals in all skeletal muscle samples. To identify genes that were differentially expressed in hibernating compared with summer active bears, we used P < 0.05 and the mean expression value in the hibernating bears divided by the mean expression value in the summer active bears, |fold-change| >1.2, as the criteria for differentially expressed genes. A total of 138 genes, 10% of all genes with significant signals, were differentially expressed in liver (Supplemental Table S1). Although the maximal change of 13.17-fold was detected for phosphoenolpyruvate carboxykinase (Pck1), the majority of genes (79%) demonstrated modest expression changes that did not exceed twofold. In liver samples, we identified 92 (67%) genes that were significantly overexpressed and 46 (33%) genes were underexpressed during hibernation. A total of 103 genes, 8% of all genes with significant signal, showed significant expression differences in skeletal muscle. RNA binding protein motif 3 (Rbm3) showed the largest expression change of 3.6-fold, but 87% of differentially expressed genes demonstrated changes less than twofold in muscle. There were 47 (46%) significantly overexpressed genes and 56 (54%) underexpressed genes in muscle sampled during hibernation compared with in summer. The expression of 12 genes, mostly involved in protein biosynthesis, was elevated in common in both liver and muscle (Table 1). Four genes demonstrated transcriptional changes in opposite directions in liver and muscle. It should be noted that we did not set cutoff for estimates of the false discovery rate (q value) of each differentially expressed gene; instead, each feature's estimated q value is reported (36) in Supplemental Table S1. The mean q value of 25% indicates that the expected proportion of false positives in the list of differentially expressed genes is relatively high. To obtain experimental estimate of the false discovery rate, we conducted quantitative real-time PCR tests for 28 (12% of the gene list) randomly selected genes that were identified as differentially expressed by the array hybridization. In liver, 18 (95%) genes showed significant changes in the same direction as the array results (Table 2, Fig. 1A). In skeletal muscle, seven (78%) out of nine genes tested showed significant differences in expression (Table 2, Fig. 1B). In total, expression changes of 25 (89.3%) out of 28 genes identified on the array were supported by the RT-PCR tests (Table 2) with significant positive correlation (r = 0.72, P < 0.002) between normalized expression values of supported genes (Fig. 1). The observed value of 10.7% for the false discovery rate means that 26 out of the 241 differentially expressed genes in our list are expected to be false positive, which is reasonable for the exploratory study.
Table 1.
Fold-changes in differentially expressed genes shared between liver and muscle tissue in black bears
| Protein Name | Gene Symbol | Liver | Muscle |
|---|---|---|---|
| RNA binding motif protein 3 | Rbm3* | 3.0 | 3.6 |
| 60S ribosomal protein L14 | Rpl14* | 2.1 | 1.5 |
| Ribosomal protein L27a-like | Rpl27a* | 2.3 | 1.4 |
| Ribosomal protein L36a | Rpl36a* | 2.0 | 1.5 |
| Ribosomal protein L37 | Rpl37* | 2.0 | 2.2 |
| 60S acidic ribosomal protein P2 | RplP2* | 1.8 | 1.4 |
| 40S ribosomal protein S23 | Rps23* | 1.7 | 2.0 |
| Ribosomal protein S24 | Rps24* | 1.8 | 1.7 |
| Thioredoxin interacting protein | Txnip | 1.8 | 1.7 |
| V-crk sarcoma virus CT10 oncogene homolog | Crk | 1.2 | 1.3 |
| Superficial zone protein | Prg4 | 2.0 | 1.5 |
| Karyopherin beta 1 | Kpnb1 | 1.2 | 1.2 |
| Aldehyde dehydrogenase | Aldh1a1 | −1.4 | 1.5 |
| Ndrg2 Antidepressant-related protein | Ndrg2 | −1.5 | 2.1 |
| Lysozyme C | LysC | 2.0 | −1.6 |
| Mannose-binding protein-associated serine protease | Masp1 | 1.3 | −1.6 |
Gene involved in protein biosynthesis. Positive numbers correspond to genes upregulated and negative numbers to genes downregulated in hibernating animals.
Table 2.
Gene expression differences validated by real-time PCR
| Gene Name | Gene Symbol | Regulated in Hibernating Bear | Tissue | Array P Value | Real-time PCR P Value | |||||
|---|---|---|---|---|---|---|---|---|---|---|
| Genes Selected for Validation of Microarray Results | ||||||||||
| Elongation factor 1 delta | Eef1d | up | liver | 0.005 | 0.001 | |||||
| 40S ribosomal protein S24 | Rps24 | up | liver | 0.023 | 0.027 | |||||
| 60S ribosomal protein L36a | Rpl36a | up | liver | 0.005 | 0.006 | |||||
| 60S ribosomal protein L18 | Rpl18 | up | liver | 0.027 | 0.011 | |||||
| 60S ribosomal protein L23 | Rpl23 | up | liver | 0.005 | 0.000 | |||||
| RNA-binding motif protein 3 | Rbm3 | up | liver | 0.005 | 0.000 | |||||
| Ribosomal protein L27a-like | Rpl27a | up | liver | 0.005 | 0.018 | |||||
| Ribosomal protein L7a | Rpl7a | up | liver | 0.005 | 0.006 | |||||
| Translation elongation factor eEF-1 beta chain | Eef1b2 | up | liver | 0.013 | 0.024 | |||||
| Eukaryotic translation initiation factor | Eif2 s2 | up | liver | 0.005 | 0.200 | |||||
| 60S ribosomal protein L9 | Rpl9 | up | liver | 0.005 | 0.001 | |||||
| Phosphoenolpyruvate carboxykinase | Pck1 | up | liver | 0.005 | 0.000 | |||||
| Proteasome subunit beta type 6 precursor | Psmb6 | up | liver | 0.021 | 0.040 | |||||
| Elongation of very long chain fatty acids protein | Elovl2 | up | liver | 0.005 | 0.000 | |||||
| Mitochondrial aldehyde dehydrogenase 2 | Aldh2 | down | liver | 0.008 | 0.008 | |||||
| Phosphoglucomutase 2 | Pgm | down | liver | 0.007 | 0.002 | |||||
| Carbonyl reductase [NADPH] 1 | Cbr1 | down | liver | 0.034 | 0.046 | |||||
| Ornithine aminotransferase | Oat | down | liver | 0.000 | 0.000 | |||||
| Carbamoyl-phosphate synthetase 1 | Cps1 | down | liver | 0.049 | 0.000 | |||||
| 40S ribosomal protein S25 | Rps25 | up | muscle | 0.008 | 0.017 | |||||
| Cold shock domain-containing protein E1 | Csde1 | up | muscle | 0.030 | 0.019 | |||||
| Fau protein | Fau | up | muscle | 0.035 | 0.024 | |||||
| 60S ribosomal protein L26 | Rpl26 | up | muscle | 0.018 | 0.009 | |||||
| H3 histone | H3f3a | up | muscle | 0.026 | 0.053 | |||||
| Myosin, light polypeptide 3 | Myl3 | down | muscle | 0.000 | 0.023 | |||||
| Sarcoplasmic/endoplasmic reticulum calcium ATPase 2 | Atp2a2 | down | muscle | 0.000 | 0.970 | |||||
| Troponin T, slow skeletal muscle | Tnnt1 | down | muscle | 0.000 | 0.020 | |||||
| L-lactate dehydrogenase | Ldhb | down | muscle | 0.020 | 0.580 | |||||
| Additional Genes Selected on the Basis of GO Analysis | ||||||||||
| 40S ribosomal protein S12 | Rps12 | up | liver | ns | 0.011 | |||||
| 40S ribosomal protein S29 | Rps29 | up | liver | ns | 0.001 | |||||
| 40S ribosomal protein S10 | Rps10 | up | liver | 0.058 | 0.000 | |||||
| Argininosuccinate synthetase | Ass | down | liver | 0.088 | 0.089 | |||||
| Glucokinase | Gck | down | liver | na | 0.067 | |||||
Significance levels for genes nonsupported by real-time PCR are in boldface.
Fig. 1.
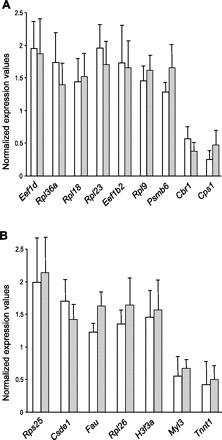
Selection of genes differentially expressed during hibernation in liver (A) and muscle (B) tissue in black bears. Expression values are normalized to the mean in summer active animals. Open bars show expression values obtained in real-time PCR, solid bars in microarray experiments, error bars are SDs.
Five additional genes that showed nonsignificant (Rpl3, Rps29, Rps12) or marginally significant (Rps10, P = 0.058; Ass, P = 0.08) differences on the array demonstrated significant or nearly significant (Ass) changes in RT-PCR assay (Table 2). These additional genes, involved in protein biosynthesis (Rpl3, Rps29, Rps12, Rps10) and urea cycle (Ass), were selected on the basis of the GO analysis showing significant enrichment in both categories. Glucokinase Glk (Hk4), a key glycolytic enzyme that was absent on the array, was also tested by RT-PCR and showed marginally nonsignificant (P = 0.067) underexpression in liver during hibernation.
Functional sets of co-regulated genes.
The genes demonstrating significant hybridization signal on the arrays were classified according to their GO categories of the biological processes. A total of 961 probes for liver and 928 for muscle were mapped in the GO. The GO categories significantly enriched by differentially expressed genes and their gene members are shown in Tables 3 and 4. In liver, the proportion of overexpressed genes involved in metabolic processes during hibernation was significantly elevated comparing to the total proportion of metabolic genes on the array.
Table 3.
Gene Ontology categories significantly enriched with differentially expressed genes
| GO Category | Total Genes on Array | Changed Genes | Enrichment | P Value | FDR | |||||
|---|---|---|---|---|---|---|---|---|---|---|
| Liver | ||||||||||
| Metabolic processes (GO:0008152) | 668 | 73↑ | 1.19 | 0.01 | 0.03 | |||||
| Protein biosynthesis (GO:0006412) | 109 | 28↑ | 2.88 | 0.00 | 0.00 | |||||
| Positive regulation of signal transduction (GO:0009967) | 13 | 6↑ | 5.04 | 0.00 | 0.00 | |||||
| Urea cycle (GO:0000050) | 2 | 2↓ | 22.35 | 0.00 | 0.28 | |||||
| Urea cycle intermediate metabolic process (GO:0000051) | 5 | 3↓ | 13.41 | 0.00 | 0.20 | |||||
| Muscle | ||||||||||
| Protein biosynthesis (GO:0006412) | 114 | 16↑ | 2.96 | 0.00 | 0.00 | |||||
| Amino acid transport (GO:0006865) | 5 | 2↑ | 8.44 | 0.02 | 0.63 | |||||
Arrows indicate direction of expression changes in hibernating black bears. GO, Gene Ontology; FDR, false discovery rate.
Table 4.
Genes in each significant GO category related to protein synthesis and metabolism of nitrogen compounds
| GO Category | Gene Name | Gene Symbol | P value | Fold-change | ||||
|---|---|---|---|---|---|---|---|---|
| Liver | ||||||||
| Protein biosynthesis | ||||||||
| Translation elongation factor eEF-1 beta chain | Eef1b2 | 0.013 | 1.66 | |||||
| Eukaryotic translation elongation factor 1 delta | Eef1d | 0.005 | 1.87 | |||||
| Nascent polypeptide associated complex | Naca | 0.025 | 1.93 | |||||
| RNA binding motif protein 3 isoform 2 | Rbm3 | 0.005 | 2.96 | |||||
| Ribosomal protein L10 | Rpl10 | 0.010 | 2.11 | |||||
| Ribosomal protein L14 | Rpl14 | 0.005 | 2.08 | |||||
| Ribosomal protein L17 | Rpl17 | 0.024 | 1.67 | |||||
| Ribosomal protein L18 | Rpl18 | 0.027 | 1.52 | |||||
| Ribosomal protein L23 | Rpl23 | 0.005 | 1.71 | |||||
| Ribosomal protein L27a | Rpl27a | 0.005 | 2.30 | |||||
| Ribosomal protein L3 | Rpl3 | 0.005 | 1.56 | |||||
| Ribosomal protein L31 | Rpl31 | 0.037 | 1.46 | |||||
| Ribosomal protein L36a | Rpl36a | 0.005 | 1.96 | |||||
| Ribosomal protein L37 | Rpl37 | 0.031 | 2.02 | |||||
| Ribosomal protein L7a | Rpl7a | 0.005 | 1.74 | |||||
| Ribosomal protein L9 | Rpl9 | 0.005 | 1.62 | |||||
| 60S acidic ribosomal protein P2 | Rplp2 | 0.005 | 1.83 | |||||
| Ribosomal protein S10 | Rps10 | 0.000 | 2.13 | |||||
| Ribosomal protein S12 | Rps12 | 0.011 | 1.82 | |||||
| Ribosomal protein S14 | Rps14 | 0.014 | 2.36 | |||||
| Ribosomal protein S18 | Rps18 | 0.036 | 1.63 | |||||
| Ribosomal protein S23 | Rps23 | 0.014 | 1.73 | |||||
| Ribosomal protein S24 | Rps24 | 0.023 | 1.77 | |||||
| Ribosomal protein S29 | Rps29 | 0.001 | 1.75 | |||||
| Ribosomal protein S3a | Rps3a | 0.005 | 1.86 | |||||
| Ribosomal protein S6 | Rps6 | 0.030 | 1.51 | |||||
| Ribosomal protein S8 | Rps8 | 0.007 | 1.61 | |||||
| Ribosomal recycling factor | Rrf1 | 0.031 | 1.40 | |||||
| Urea cycle intermediate metabolic process | ||||||||
| Argininosuccinate synthetase isoform 4 | Ass | 0.089 | −1.76 | |||||
| Carbamoyl-phosphate synthetase 1 | Cps1 | 0.049 | −2.13 | |||||
| Ornithine aminotransferase | Oat | 0.000 | −5.90 | |||||
| Muscle | ||||||||
| Protein biosynthesis | ||||||||
| Fau protein | Fau | 0.035 | 1.63 | |||||
| Ribosomal protein L13a | Rpl13a | 0.016 | 1.53 | |||||
| Ribosomal protein L26 | Rpl26 | 0.018 | 1.64 | |||||
| 40 Ribosomal protein S12 | Rps12 | 0.008 | 1.53 | |||||
| Ribosomal protein S2 | Rps2 | 0.018 | 1.41 | |||||
| 40S ribosomal protein S25 | Rps25 | 0.008 | 2.14 | |||||
| Ribosomal protein S27a | Rps27a | 0.008 | 1.59 | |||||
| Ribosomal protein S4 X-linked X isoform | Rps4x | 0.045 | 1.31 | |||||
| Amino acid transport | ||||||||
| Amino acid transporter A2 | Slc38a2 | 0.018 | 1.70 | |||||
| Glutamate transporter protein | Arl6ip5 | 0.008 | 1.70 | |||||
Symbols of genes changed in both liver and muscle are in boldface.
There was a highly significant enrichment of the protein biosynthesis (translation) category by overexpressed genes in both liver and skeletal muscle during hibernation. The list of protein biosynthesis genes upregulated in liver includes two translation elongation factors (Eef1b2, Eef1d), nascent polypeptide-associated complex subunit alpha (Naca), ribosomal recycling factor (Rrf1), RNA binding protein motif 3 (Rbm3), and 23 ribosomal proteins. In addition to eight protein biosynthesis genes (Rbm3 and 7 ribosomal proteins) that were upregulated in both liver and muscle, Fau protein (Fau) and seven ribosomal protein genes were overexpressed during hibernation in skeletal muscle. Significant enrichment of the protein biosynthesis category by overexpressed genes in both liver and muscle was supported by results of GSEA (Fig. 2). Importantly, GSEA ranks all genes with significant signals in the experiment, thus, its results do not depend on the selection of genes above cutoffs for significance of expression differences and false discovery rate (37). We did not use GSEA to verify enrichment of other GO categories, as they contained fewer than 15 genes presented on the array (Table 3), which is the low limit for this method.
Fig. 2.
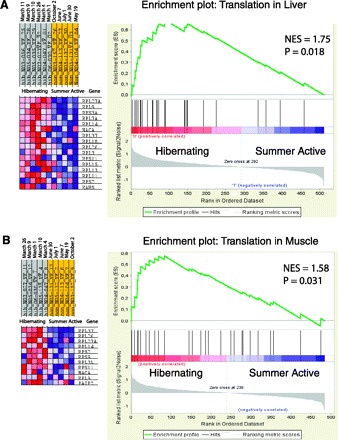
Gene Set Enrichment Analysis results showing significant enrichment of the translation category by overexpressed genes in liver (A) and skeleton muscle (B) of hibernating black bears. An expression data set sorted by correlation with hibernating phenotype and the corresponding heat map with red for upregulated and blue for downregulated genes during hibernation are shown on the left. Dates at the top indicate time of tissue sampling from each bear. Plot of the running sum for enrichment score (S) in the data set, the normalized enrichment score (NES), and location of genes (hits) from the translation category in the list ranked according to expression differences and the ranked list metric are shown on the right.
The GO biological process analysis also revealed a significant overrepresentation of genes involved in the positive regulation of signal transduction, the movement of signals from outside the cell to inside, in the list of upregulated genes for liver during hibernation. The category of positive regulation of signal transduction includes genes involved in positive regulation of three signaling pathways that play an important role in cellular responses to stress: NF-kappa B (NF-κB transcription factor) cascade, JNK (JUN kinase) cascade, and smoothened (Smo transmembrane protein) pathway. However, high estimates of the false discovery rate for each of these subcategories do not exclude possibility that significant enrichment had been obtained by chance due to multiple testing. The GO category of amino acid transport in muscle was significantly enriched by upregulated genes including glutamate transporter EAAC1-interacting protein (Arl6ip5) and sodium-coupled neutral amino acid transporter 2 (Slc38a2), although the false discovery rate was above the significance level. Two genes involved in the urea cycle, carbamoyl-phosphate synthetase I (Cps1) and argininosuccinate synthetase (Ass), were both downregulated in liver. These genes with the addition of ornithine aminotransferase (Oat) generated significant overrepresentation of downregulated genes in the category of urea cycle intermediate metabolic process.
In contrast to protein biosynthesis, the set of genes involved in protein degradation and catabolism did not demonstrate directional transcriptional change during hibernation. There was no significant enrichment of differentially expressed genes in the proteolysis (67 genes on the array for liver, 62 genes for muscle) and the cellular protein catabolism process (26 genes for liver, 29 genes for muscle) categories. Only one gene, proteasome subunit beta type 6 (Psmb6), involved in ubiquitin-dependent protein catabolism, was upregulated in liver during hibernation. Two genes, ubiquitin (Rps27a) and ubiquitin-conjugating enzyme E261 (Ube261), were overexpressed while two other genes, proteasome subunit beta type 5 (Psmb5) and ubiquitin carboxyl-terminal hydrolase 38 (Usp38) involved in the cellular protein catabolism, were underexpressed in muscle of hibernating bears.
Differential expression of individual genes in liver.
A number of important genes involved in metabolism demonstrated differences in expression between hibernating and summer active bears. Phosphoenolpyruvate carboxykinase (Pck1), a key enzyme in gluconeogenesis, was overexpressed during hibernation. In contrast, the RT PCR test showed that glucokinase (Gck), catalyzing the initial step of glycolysis, was underexpressed. Among genes involved in lipid metabolism, expression of adipophilin (Adfp), an adipose differentiation-related protein, a long-chain fatty acyl elongase (Evolv2), and a long-chain fatty acid CoA ligase (Acsl4) that activates long-chain fatty acids for both synthesis of cell lipids and degradation through beta-oxidation all increased during winter hibernation. A long chain-specific acyl-CoA dehydrogenase (Acadl) and peroxisomal 3, 2-trans-enoyl-CoA isomerase (Peci), involved in fatty acid beta-oxidation, were underexpressed during hibernation.
An important function of the liver is the breakdown of endogenous waste compounds. We detected a tendency for downregulation of genes involved in detoxification pathways during hibernation. There was significant repression of cytochrome P450 3A12 (Cyp3a12) and cytochrome P450 4V2 (Cyp4v2) genes that degrade potentially toxic xenobiotics. Similarly, we also detected underexpression of genes involved in hydrogen peroxide catabolism, removal of superoxide radicals, and metabolites with electron-deficient carbon centers (electrophilic compounds) including glutathione peroxidase 3 (Gpx3), superoxide dismutase (Sod2), and aldehyde dehydrogenase (Aldh1a1, Aldh2). However, cytochrome P450 2E1 (Cyp2e1) gene and epoxide hydrolase 2 (Ephx2), which degrades potentially toxic epoxides, were significantly upregulated during hibernation.
Differential expression of genes in skeletal muscle.
In skeletal muscle sampled from hibernating black bears, we detected underexpression of genes involved in muscular contraction including alpha-actin-1 (Acta1), myosin light chain 3 (Myl3), myosin light polypeptide 6 (Myl6), phospholamban (Pln), protein phosphatase 1 regulatory subunit 12A (Ppp1r12a), and slow skeletal muscle troponin T (Tnnt1). Several genes participating in electron transfer from NADH to the respiratory chain on the mitochondrial membrane were also downregulated. Out of 16 genes on the array, four genes, NADH dehydrogenase [ubiquinone] 1 beta subcomplex (Ndufb2, Nbufb5), NADH-ubiquinone oxidoreductase 75 kDa subunit (Ndufs1), and NADH dehydrogenase [ubiquinone] iron-sulfur protein 6 (Ndufs6), were repressed while only one gene NADH dehydrogenase [ubiquinone] 1 alpha subcomplex subunit 2 (Ndufa2) was upregulated during hibernation. Also upregulated was cold shock domain-containing protein E1 (Csde1), an RNA-binding protein that may be involved in translationally coupled mRNA turnover and implicated with other RNA-binding proteins.
DISCUSSION
All black bears included as hibernation animals in the present study showed physiology, behavior, and body mass loss that is expected for bears during hibernation. Hibernating bears were sampled in March after at least 4 mo of continuous hibernation and while in the absence of food and water. Black bears in Alaska first begin to emerge from hibernation in late April (32), and, therefore, hibernating bears in this study were 3–6 wk from emergence and their resumption of normal levels of metabolism, body temperature, and feeding as displayed in the nonhibernating bears. The disturbance and anesthesia necessary for transport of the bears from their den required ∼1 h and were associated with a slight increase in metabolic rate compared with that measured in their dens. Any direct effect of this disturbance on gene expression is unknown at this time.
We found that only 8–10% of genes studied demonstrated differential expression, and most changes were less than twofold comparing hibernating and summer active black bears. Thus, transcriptional changes associated with winter hibernation of black bears are qualitatively and quantitatively modest. This finding is generally consistent with results of the genomic-scale study on differential gene expression in ground squirrels (42). However, our study reveals two major differences between the changes in hibernating transcriptomes of black bears and ground squirrel hibernators. The prominent feature of the transcriptional changes in small hibernators is a reduction in transcript level; 90% of differentially expressed genes were downregulated in liver of ground squirrels during winter (42). In contrast, the majority of differentially expressed genes (67%) were upregulated in livers of hibernating black bears. Compared with small hibernators, black bears demonstrate a more balanced proportion of up- and downregulated genes in the liver, which plays a central role in metabolic homeostasis and nutrient processing. This finding is consistent with the less profound reduction of metabolic rate in hibernating bears (20–50% reduction) compared with ground squirrels (98% reduction) during torpor (4, 6, 40).
Protein metabolism.
The coordinated induction in transcriptional level of genes involved in protein biosynthesis is a second distinctive feature of hibernating transcriptome in black bears. There are several lines of evidence for significant depression of protein biosynthesis in small hibernators during steady-state torpor. Evidence for translational suppression was provided by measuring conversion rates of radioactively labeled amino acids and examining tissue extracts for their ability to support translation in vitro and detecting significant loss of polyribosomes during torpor (7, 21). Evidence for translational suppression during torpor at the transcriptional level was also obtained in a recent study (43) showing coordinated underexpression of protein biosynthesis genes in brown adipose tissue of hibernating arctic ground squirrels. Depression in translation levels during torpor is consistent with a need to reduce energy consumption as translating RNA into protein is energetically expensive (7). Protein synthesis in hibernating ground squirrels does occur, however, during the brief (15–24 h) but regular interbout arousals and euthermic periods that occur each 1–3 wk during the hibernation season (7). In contrast to torpor in small hibernators, our study demonstrates elevated expression of protein biosynthesis genes in liver and skeletal muscles that is potentially continuous in hibernating black bears. This finding possibly implies regulated induction of protein translation during hibernation in black bears that hibernate at relatively higher rates of metabolism.
Among differentially expressed protein biosynthesis genes, RNA binding motif protein 3 (Rbm3) demonstrated high overexpression in both liver and muscle during hibernation. This is a notable observation because Rbm3 is the only gene consistently upregulated across different tissues in hibernating ground squirrels (42, 43, 44). It was suggested that this cold-induced RNA binding protein may facilitate the processing of RNA molecules in the cold and protect mRNA transcripts in hibernating ground squirrels (42, 44). However, in light of the coordinated induction of protein biosynthesis genes found in our study, overexpression of Rbm3 may have a different function in hibernating black bears. There is evidence showing that Rbm3 enhances global protein synthesis under mild hypothermia at 32°C by binding to 60S ribosomal subunits and altering abundance of microRNAs dampening translation (10).
The results of previous studies of protein metabolism in hibernating bears provide some evidence suggesting increase in protein biosynthesis. While skeletal muscle mass in ground squirrels and bats is reduced by 14–65% during hibernation (7), no significant loss in lean body mass was observed in adult black bears during hibernation (25, 29), except for 4–10% reduction in muscle protein reported specifically for lactating females (38). Hibernating brown and black bears show a net increase in plasma protein concentration (17, 27), and this is consistent with elevated protein synthesis in liver during hibernation. Lundberg et al. (25) found that rates of whole body protein turnover, including protein anabolism and catabolism, were elevated three- to fivefold in hibernating black bears compared with summer active bears.
These findings are in agreement with our conclusion of elevated protein biosynthesis in hibernating bears inferred from differential gene expression. However, one study contradicts this conclusion. Recently, it has been shown that protein biosynthesis and breakdown were both lower in skeletal muscle of hibernating black bears compared with summer active bears (23). This study does not account for possible effect of sex on muscle protein metabolism as five males and one female in summer were compared with five females and one male sampled during hibernation. The assumption of no difference in muscle protein metabolism between sexes in black bears needs to be verified.
Decrease in protein synthesis, including underexpression of genes involved in translation, has been shown to contribute to muscle degradation and protein loss due to disuse in mammals and fish (19, 34). Bears demonstrate a unique ability to conserve muscle mass and retain strength through prolonged periods of inactivity and starvation during hibernation. In the black bear, muscle strength is reduced 23% after 130 days of inactivity, while predicted strength loss over the same period would be ∼90% in healthy humans (16). An important adaptive consequence is that bears maintain their muscle function and conserve mobility during winter hibernation. Active protein biosynthesis during hibernation was suggested among possible mechanisms preventing muscle atrophy (16). Transcriptional changes detected in our study support the induction of translation during winter hibernation and represent a unique adaptation at the molecular level.
There is a direct relationship between protein metabolism and the urea cycle that utilizes amino groups derived from the catabolism of amino acids. Our results revealed coordinated underexpression of genes involved in the urea cycle during hibernation. This finding implies a reduction in urea production in hibernating black bears that is consistent with physiological and biochemical data. Significant decreases in the urea concentration in blood of hibernating bears are consistently observed (1, 18, 27) and attributed to both low production and active urea recycling through microbial ureolysis. Under the condition of no dietary intake of amino acids, reduced urea formation suggests redirection of amino acids from catabolic pathways followed by amino group utilization through the urea cycle to protein synthesis.
It should be noted that, similar to black bears, coordinated underexpression of the urea cycle genes was observed in hibernating ground squirrels (42, 44). Because of the decrease in protein synthesis seen in small mammals that hibernate with low body temperatures, reduction of urea production in these species may indicate a redirection of amino acids to gluconeogenesis and the TCA cycle (44). The overexpression of amino acid transporters that we detected in muscle of hibernating bears may instead facilitate protein synthesis. This finding is in line with reciprocal transcriptional changes detected for genes involved in protein biosynthesis and the urea cycle.
In contrast to protein synthesis and nitrogen metabolism, genes involved in protein degradation and catabolism did not demonstrate any coordinated and directional transcriptional changes during hibernation in liver and muscle of black bears. Apart from reduced production and active recycling of urea, increases in protein catabolism in other tissues and organs may release additional amino acids to support elevated protein synthesis in liver and muscle. Biochemical data showed the increased degradation of the type I collagen in the connective tissues of hibernating bears (18) that may provide the essential amino acids for protein synthesis. The importance of regulation of proteolysis at protein level was recently demonstrated in skeletal muscle (11). This result suggests that during hibernation bears produce a proteolytic inhibitor that is released to plasma and blocks proteolysis of skeletal muscle. Thus, the lack of evidence for coordinated transcriptional changes for genes involved in protein catabolism in liver and muscle is compatible with elevated protein synthesis in these organs during hibernation.
Transcriptional changes common in mammalian hibernation.
While overexpression of protein biosynthesis genes represents a distinctive feature of hibernating transcriptome in black bears, expression differences of individual genes reveal some similarity in transcriptional changes between bears and small hibernators. In liver, high overexpression of Pck1, a key enzyme in gluconeogenesis, together with underexpression of the important glycolytic enzyme Gck indicates a shift to glucose synthesis that provides an energy source in fasting conditions as reported for hibernating arctic ground squirrels (44).
It has been suggested that, similar to ground squirrels hibernating in freezing conditions (6), hibernating bears primarily use fat as a source of energy (27), and this is supported by our observed respiratory quotient values near 0.7. We detected no coordinated transcriptional changes for genes involved in lipid catabolism, however, although this may be due to a limited representation of lipid metabolism genes on the array. However, adipophilin (Adfp) was highly overexpressed in liver of hibernating bears as well as in ground squirrels (42, 44). Induction of adipophilin, a gene involved in fatty acid accumulation in lipid droplets, in hibernating black bears and small hibernators supports its importance in enhancing fatty acid metabolism during hibernation (44).
There is a tendency toward downregulation of genes involved in the breakdown of waste products in livers of hibernating bears. We detected a reduction in expression of multiple genes involved in xenobiotic metabolism, hydrogen peroxide catabolism, removal of superoxide radicals, and reduction of electrophilic compounds. These findings are consistent with transcriptional changes observed in small hibernators, and they provide supportive evidence that excretory function of the liver is depressed during hibernation, probably as a result of prolonged fasting (42, 44).
In conclusion, this study represents the first research effort to elucidate transcriptional changes for hundreds of genes during hibernation in black bears. Elevated expression of multiple genes involved in protein biosynthesis is a distinctive feature of the hibernating transcriptome of black bears. Induction of protein synthesis likely represents an adaptive mechanism that contributes to a unique ability to reduce muscle atrophy over prolonged periods of immobility during winter hibernation (16). Comparing expression profiles in bears to hibernating small mammals shows a general trend during hibernation in transcriptional changes that include induction of genes involved in lipid metabolism and carbohydrate synthesis as well as depression of genes involved in the urea cycle and detoxification function in liver. Future studies of hibernating transcriptome with more representative probe sets will identify co-regulated functional groups of genes and provide more understanding of the molecular basis of hibernation in bears. Our study also generates an impetus for analysis of molecular changes at protein level during hibernation by using proteomic approaches.
GRANTS
This work was supported by the National Science Foundation (NSF) EPSCOR program and USAMRMC proposal number 05178001. B. M. Barnes was also supported by NSF grant 0076039. J. Quackenbush and G. Pertea were supported by NSF Grant DBI-0649614.
Supplementary Material
Acknowledgments
We thank Alaska Department of Fish and Game for supplying bears. We thank Lori Gildehaus and Franziska Kohl for help in laboratory and Piero Carninci from RIKEN Genomic Sciences Center for helpful suggestions for construction of the Institute for Systems Biology (ISB) bear liver cDNA library. We also thank our ISB colleagues Scott Bloom and Lee Rowen for DNA sequencing, Gustavo Glusman for the preliminary analysis of the EST data, and Nat Goodman for helpful discussion on study design.
Footnotes
Address for reprint requests and other correspondence: V. B. Fedorov, Inst. of Arctic Biology, Univ. of Alaska Fairbanks, Fairbanks, AK 99775 (e-mail: fnvf@uaf.edu).
The costs of publication of this article were defrayed in part by the payment of page charges. The article must therefore be hereby marked “advertisement” in accordance with 18 U.S.C. Section 1734 solely to indicate this fact.
The online version of this article contains supplemental material.
REFERENCES
- 1.BarbozaPSBarboza PS, Farley SD, Robbins CT. Whole-body urea cycling and protein turnover during hyperphagia and dormancy in growing bears (Ursus americanus and U. arctos). Can J Zool 75: 2129–2136, 1997. [Google Scholar]
- 2.BarnesBMBarnes BM. Freeze avoidance in a mammal: body temperatures below 0 degree C in an Arctic hibernator. Science 244: 1593–1595, 1989. [DOI] [PubMed] [Google Scholar]
- 3.BarnesBMBarnes BM, Tøien Ø, Blake J, Grahn D, Heller HC, Edgar DM. Hibernation in black bears: body temperature cycles and sleep. FASEB J 13: A740, 1999. [Google Scholar]
- 4.BoyerBBBoyer BB, Barnes BM. Molecular and metabolic aspects of mammalian hibernation. Bioscience 49: 713–724, 1999. [Google Scholar]
- 5.BrauchKMBrauch KM, Dhruv ND, Hanse EA, Andrews MT. Digital transcriptome analysis indicates adaptive mechanisms in the heart of a hibernating mammal. Physiol Genomics 23: 227–234, 2005. [DOI] [PubMed] [Google Scholar]
- 6.BuckCLBuck CL, Barnes BM. Effects of ambient temperature on metabolic rate, respiratory quotient, and torpor in an arctic hibernator. Am J Physiol Regul Integr Comp Physiol 279: R255–R262, 2000. [DOI] [PubMed] [Google Scholar]
- 7.CareyHVCarey HV, Andrews MT, Martin SL. Mammalian hibernation: cellular and molecular responses to depressed metabolism and low temperature. Physiol Rev 83: 1153–1181, 2003. [DOI] [PubMed] [Google Scholar]
- 8.CarninciPCarninci P. Generation of full-length libraries. In: DNA Microarrays. A Molecular Cloning Manual, edited by Bowtell D and Sambrook J. Cold Spring Harbor, NY: Cold Spring Harbor Laboratory, 2003.
- 9.CarninciPCarninci P, Shibata Y, Hayatsu N, Sugahara Y, Shibata K, Itoh M, Konno H, Okazaki Y, Muramatsu M, Hayashizaki Y. Normalization and subtraction of cap-trapper-selected cDNAs to prepare full-length cDNA libraries for rapid discovery of new genes. Genome Res 10: 1617–1630, 2000. [DOI] [PMC free article] [PubMed] [Google Scholar]
- 10.DresiosJDresios J, Aschrafi A, Owens GC, Vanderklish PW, Edelman GM, Mauro VP. Cold stress-induced protein Rbm3 binds 60S ribosomal subunits, alters microRNA levels, and enhances global protein synthesis. Proc Natl Acad Sci USA 102: 1865–1870, 2005. [DOI] [PMC free article] [PubMed] [Google Scholar]
- 11.FusterGFuster G, Busquets S, Almendro V, López-Soriano FJ, Argilés JM. Antiproteolytic effects of plasma from hibernating bears: a new approach for muscle wasting therapy? Clin Nutr 26: 658–661, 2007. [DOI] [PubMed] [Google Scholar]
- 12.GeiserFGeiser F. Metabolic rate and body temperature reduction during hibernation and daily torpor. Annu Rev Physiol 66: 239–274, 2004. [DOI] [PubMed] [Google Scholar]
- 13.GouldJGould J, Getz G, Monti S, Reich M, Mesirov JP. Comparative gene marker selection suite. Bioinformatics 22: 1924–1925, 2006. [DOI] [PubMed] [Google Scholar]
- 14.GraceyAYGracey AY, Cossins AR. Application of microarray technology in environmental and comparative physiology. Annu Rev Physiol 65: 231–259, 2003. [DOI] [PubMed] [Google Scholar]
- 15.HaldaneJSHaldane JS. Methods of Air Analysis (1st ed.). London: Griffin, 1912.
- 16.HarlowHJHarlow HJ, Lohuis T, Beck TD, Iaizzo PA. Muscle strength in overwintering bears. Nature 409: 997, 2001. [DOI] [PubMed] [Google Scholar]
- 17.HissaRHissa R, Siekkinen J, Hohtola E, Saarela S, Hakala A, Pudas J. Seasonal patterns in the physiology of the European brown bear (Ursus arctos arctos) in Finland. Comp Biochem Physiol A Physiol 109: 781–791, 1994. [DOI] [PubMed] [Google Scholar]
- 18.HissaRHissa R, Puukka M, Hohtola E, Sassi ML, Risteli J. Seasonal changes in plasma nitrogenous compounds of the European brown bear (Ursus arctos arctos). Ann Zool Fennici 35: 205–213, 1998. [Google Scholar]
- 19.JackmanRWJackman RW, Kandarian SC. The molecular basis of skeletal muscle atrophy. Am J Physiol Cell Physiol 287: C834–C843, 2004. [DOI] [PubMed] [Google Scholar]
- 20.KariLKari L, Loboda A, Nebozhyn M, Rook AH, Vonderheid EC, Nichols C, Virok D, Chang C, Horng WH, Johnston J, Wysocka M, Showe MK, Showe LC. Classification and prediction of survival in patients with the leukemic phase of cutaneous T cell lymphoma. J Exp Med 197: 1477–1488, 2003. [DOI] [PMC free article] [PubMed] [Google Scholar]
- 21.KnightJEKnight JE, Narus EN, Martin SL, Jacobson A, Barnes BM, Boyer BB. mRNA stability and polysome loss in hibernating Arctic ground squirrels (Spermophilus parryii). Mol Cell Biol 20: 6374–6379, 2000. [DOI] [PMC free article] [PubMed] [Google Scholar]
- 22.LivakKJLivak KJ, Schmittgen TD. Analysis of relative gene expression data using real-time quantitative PCR and the 2[-delta delta C(T)] method. Methods 25: 402–408, 2001. [DOI] [PubMed] [Google Scholar]
- 23.LohuisTDLohuis TD, Harlow HJ, Beck TD. Hibernating black bears (Ursus americanus) experience skeletal muscle protein balance during winter anorexia. Comp Biochem Physiol B Biochem Mol Biol 147: 20–28, 2007. [DOI] [PubMed] [Google Scholar]
- 24.LuftUCLuft UC, Myhre LG, Loeppky JA. Validity of Haldane calculation for estimating respiratory gas exchange. J Appl Physiol 34:864–854, 1973. [DOI] [PubMed] [Google Scholar]
- 25.LundbergDALundberg DA, Nelson RA, Wahner HW, Jones JD. Protein metabolism in the black bear before and during hibernation. Mayo Clin Proc 51: 716–722, 1976. [PubMed] [Google Scholar]
- 26.LymanCPLyman CP, Willis JS, Malan A, Wang LCH. Hibernation and Torpor in Mammals and Birds. New York: Academic, 1982.
- 27.NelsonRANelson RA. Protein and fat metabolism in hibernating bears. Fed Proc 39: 2955–2958, 1980. [PubMed] [Google Scholar]
- 28.NelsonRANelson RA, Wahner HW, Jones JD, Ellefson RD, Zollman PE. Metabolism of bears before, during, and after winter sleep. Am J Physiol 224: 491–496, 1973. [DOI] [PubMed] [Google Scholar]
- 29.NelsonRANelson RA, Jones JD, Wahner HW, McGill DB, Code CF. Nitrogen metabolism in bears: urea metabolism in summer starvation and in winter sleep and role of urinary bladder in water and nitrogen conservation. Mayo Clin Proc 50: 141–146, 1975. [PubMed] [Google Scholar]
- 30.PerteaGPertea G, Huang X, Liang F, Antonescu V, Sultana R, Karamycheva S, Lee Y, White J, Cheung F, Parvizi B, Tsai J, Quackenbush J. TIGR Gene Indices clustering tools (TGICL): a software system for fast clustering of large EST datasets. Bioinformatics 19: 651–652, 2003. [DOI] [PubMed] [Google Scholar]
- 31.PfafflMWPfaffl MW. A new mathematical model for relative quantification in real-time RT-PCR. Nucleic Acids Res 29: 2001–2007, 2001. [DOI] [PMC free article] [PubMed] [Google Scholar]
- 32.RauschRLRausch RL. Notes on the black bear Ursus americanus pallus, in Alaska, with particular reference to dentition and growth. Zeitschrift für Säugetierkunde 26: 65–128, 1961. [Google Scholar]
- 33.ReichMReich M, Liefeld T, Gould J, Lerner J, Tamayo P, Mesirov JP. GenePattern 2.0. Nature Genetics 38: 500–501, 2006. [DOI] [PubMed] [Google Scholar]
- 34.SalemMSalem M, Kenney PB, Rexroad CE, Yao JB. Microarray gene expression analysis in atrophying rainbow trout muscle: a unique nonmammalian muscle degradation model. Physiol Genomics 28: 33–45, 2006. [DOI] [PubMed] [Google Scholar]
- 35.SrereHKSrere HK, Wang LC, Martin SL. Central role for differential gene expression in mammalian hibernation. Proc Natl Acad Sci USA 89: 7119–7123, 1992. [DOI] [PMC free article] [PubMed] [Google Scholar]
- 36.StoreyJDStorey JD, Tibshirani R. Statistical significance for genomewide studies. Proc Natl Acad Sci USA 100: 9440–9445, 2003. [DOI] [PMC free article] [PubMed] [Google Scholar]
- 37.SubramanianASubramanian A, Tamayo P, Mootha VK, Mukherjee S, Ebert BL, Gillette MA, Paulovich A, Pomeroy SL, Golub TR, Lander ES, Mesirov JP. Gene set enrichment analysis: A knowledge-based approach for interpreting genome-wide expression profiles. Proc Natl Acad Sci USA 102: 15545–15550, 2005. [DOI] [PMC free article] [PubMed] [Google Scholar]
- 38.TinkerDBTinker DB, Harlow HJ, Beck TD. Protein use and muscle-fiber changes in free-ranging, hibernating black bears. Physiol Zool 71: 414–424, 1998. [DOI] [PubMed] [Google Scholar]
- 39.TøienØTøien Ø. Data acquisition in thermal physiology: measurements of shivering. J Therm Biol 17: 357–366, 1992. [Google Scholar]
- 40.TøienØTøien Ø, Barnes BM, Blake J, Grahn D, Heller HC, Edgar DM. Hibernation in black bears: energetics and thermoregulation. FASEB J 13: A740, 1999. [Google Scholar]
- 41.WagnerJAWagner JA, Horwath SM, Dahms TE, Reed S. Validation of open-circuit method for the determination of oxygen consumption. J Appl Physiol 34: 859–863, 1973. [DOI] [PubMed] [Google Scholar]
- 42.WilliamsDRWilliams DR, Epperson LE, Li W, Hughes MA, Taylor R, Rogers J, Martin SL, Cossins AR, Gracey AY. Seasonally hibernating phenotype assessed through transcript screening. Physiol Genomics 24: 13–22, 2005. [DOI] [PubMed] [Google Scholar]
- 43.YanJYan J, Burman A, Nichols C, Alila L, Showe LC, Showe MK, Boyer BB, Barnes BM, Marr TG. Detection of differential gene expression in brown adipose tissue of hibernating arctic ground squirrels with mouse microarrays. Physiol Genomics 25: 346–353, 2006. [DOI] [PubMed] [Google Scholar]
- 44.YanJYan J, Barnes BM, Kohl F, Marr TG. Modulation of gene expression in hibernating arctic ground squirrels. Physiol Genomics 32: 170–181, 2008. [DOI] [PubMed] [Google Scholar]
- 45.ZeebergBRZeeberg BR, Feng W, Wang G, Wang MD, Fojo AT, Sunshine M, Narasimhan S, Kane DW, Reinhold WC, Lababidi S, Bussey KJ, Riss J, Barrett JC, Weinstein JN. GoMiner: a resource for biological interpretation of genomic and proteomic data. Genome Biol 4: R28, 2003. [DOI] [PMC free article] [PubMed] [Google Scholar]
- 46.ZeebergBRZeeberg BR, Qin H, Narasimhan S, Sunshine M, Cao H, Kane DW, Reimers M, Stephens RM, Bryant D, Burt SK, Elnekave E, Hari DM, Wynn TA, Cunningham-Rundles C, Stewart DM, Nelson D, Weinstein JN. High-Throughput GoMiner, an 'industrial-strength’ integrative gene ontology tool for interpretation of multiple-microarray experiments, with application to studies of common variable immune deficiency (CVID). BMC Bioinformatics 6: 168, 2005. [DOI] [PMC free article] [PubMed] [Google Scholar]
- 47.ZhuYYZhu YY, Machleder EM, Chenchik A, Li R, Siebert PD. Reverse transcriptase template switching: a SMART approach for full-length cDNA library construction. Biotechniques 30: 892–897, 2001. [DOI] [PubMed] [Google Scholar]
Associated Data
This section collects any data citations, data availability statements, or supplementary materials included in this article.