

Abstract
Control of reaching movements requires an accurate estimate of the state of the limb, yet sensory signals are inherently noisy, because of both noise at the receptors themselves and the stochastic nature of the information representation by neural discharge. One way to derive an accurate representation from noisy sensor data is to combine it with the output of a forward model that considers both the previous state estimate and the noisy input. We recorded from primary somatosensory cortex (S1) in macaques (Macaca mulatta) during both active and passive movements to investigate how the proprioceptive representation of movement in S1 may be modified by the motor command (through efference copy). We found neurons in S1 that respond to one or both movement types covering a broad distribution from active movement only, to both, to passive movement only. Those neurons that responded to both active and passive movements responded with similar directional tuning. Confirming earlier results, some, but not all, neurons responded before the onset of volitional movements, possibly as a result of efference copy. Consequently, many of the features necessary to combine the forward model with proprioceptive feedback appear to be present in S1. These features would not be expected from combinations of afferent receptor responses alone.
Keywords: proprioception, arm movement, efference copy, monkey
a central issue in sensory physiology is how the nervous system reconciles sensory input with expectation. Some experiments suggest that descending motor commands are forwarded to sensory systems, where they evoke activity similar to that expected to result from the planed movement (Cullen 2004; Crapse and Sommer 2008a). This transformation from a motor to a sensory-like signal has been termed a “forward model” in the motor control literature (Wolpert et al. 1995). There is some evidence that this sensory expectation, calculated using a forward model, is subtracted from afferent inputs, thereby producing a sensory representation that resembles an error signal (Bell et al. 1997; Bays et al. 2006). This error signal can then be used for rapid feedback control, allowing the motor system to position a limb in the desired state. Here, we demonstrate both types of behavior in the proprioceptive discharge of single neurons in macaque primary somatosensory cortex (S1).
If the somatosensory system is to be useful for correcting movement errors, it must be able to distinguish internally generated movements (which should not be corrected) from unintended motion due to execution errors or external perturbations (which should). One hypothesis for how the brain distinguishes these types of movements is that the motor system provides information about its own descending commands to the sensory system. This process is referred to as “efference copy.” When efference copy information reaches sensory areas, it evokes activity in those areas. This evoked activity is termed “corollary discharge.” The pattern of this corollary discharge often resembles that of the sensory feedback that would be expected from the movement (for review see: Crapse and Sommer 2008b).
Cortical neurons throughout S1 are known to respond under both active and passive conditions (Soso and Fetz 1980) and to represent the static posture of the limb as well as its velocity (Gardner and Costanzo 1981). As in the motor cortex, S1 discharge is sinusoidally tuned to movement direction (Prud'homme and Kalaska 1994). It is convenient to summarize this spatial tuning in terms of the direction of motion to which a neuron responds most strongly, referred to as the “preferred direction” (PD) of the neuron. In similar experiments in M1, motor cortex neurons also show sinusoidal tuning to center out movements (Georgopoulos et al. 1982). Therefore, in the highly constrained movements used in many studies, distinguishing a motor plan from a representation of expected sensory response is not a simple problem.
The responses of many S1 neurons precede active movement onset (Soso and Fetz 1980) and sufficiently many precede even EMG activity that the neural activity cannot be explained by movement-evoked reafference (Nelson 1987). There is considerable variability between neurons in the timing of this discharge in parietal area 5 (Kalaska et al. 1983) and M1(Ashe and Georgopoulos 1994). Premovement activity in posterior parietal cortex in particular has been considered evidence for a forward model representing corollary discharge (Mulliken et al. 2008). We have previously shown that during active movement cells in S1 encode both velocity and the position of the limb endpoint with lags that span a range of latencies (Weber et al. 2011).
There is evidence that efference copy may be used to reduce sensory responsiveness during movement through either cancelation or gating (Equibar et al. 1994; Staines et al. 2000; Seki and Fetz 2012), much like the subtraction process needed to produce an error signal. This cancellation phenomenon has been seen both in somatosensory responses during movement and in auditory responses during vocalization (Eliades and Wang 2003; Bays et al. 2006). There is also evidence that cutaneous inputs from the hand can vary depending on whether tactile stimulation was a result of active or passive contact (Chapman 1994). These observations suggest that efference copy can have influences that are both excitatory, as in the case of corollary discharge, and inhibitory, as with cancelation.
To investigate the combination of these putative afferent and efferent influences on single neurons in S1, we recorded from area 2 in the macaque using 96-channel microelectrode arrays during both active reaching movements and unexpected perturbations to the hand that generated passive limb displacement. We selected area 2 because it contains many cells responsive to proprioceptive input (Huffman and Krubitzer 2001) and, unlike area 3a, is located on top of a gyrus, making it readily accessible to our microelectrode arrays. Additionally, the somatotopy is less well defined and receptive fields of area 2 often cover a larger area or multiple joints, than those of areas 3a or 1, increasing the likelihood that we would observe more complex responses than those of the receptors themselves (Merzenich et al. 1978; Pons et al. 1985; Krubitzer and Disbrow 2008).
In this study, we found some cells that responded only to active movements, some that responded only to passive movements, and others that responded to both. Where other studies have found qualitative similarities between active and passive responses, we quantified the relationship between PDs for active and passive movements. For the cells that responded to both active movement and passive perturbation, we compared both the tuning curves and timing of the two types of responses. Neurons often responded with different discharge magnitude to active and passive movements. This difference was not simply an effect of different kinematics in the two conditions, since some neurons preferred active movement and others, passive. PDs of cells that responded to both active and passive movements were aligned. However, despite these similar directional sensitivities, the timing of responses varied considerably between active and passive movements. We have confirmed earlier descriptions of S1 cells that lead movement and shown further that despite tightly clustered responses shortly after passive displacement of the hand, during active movement, the response onsets of the same cells occurred over a range from several hundred ms before movement onset to several hundred milliseconds after. Our results show patterns of activity in S1 that are consistent with corollary discharge, reflecting information conveyed to S1 through efference copy. These findings suggest S1 does more than just code sensory information but may also combine it with motor intent to form better estimates of limb state.
MATERIALS AND METHODS
Behavioral task.
Four rhesus macaques were trained to execute a modified center-out reaching task. In this task, a monkey grasped the handle of a two-link planar manipulandum used to control a cursor displayed on a vertical LCD screen. At the beginning of each trial, the monkey moved the cursor to a central location and waited throughout a center hold period of random duration between 0.5 and 1.5 s. An outer target was then illuminated corresponding to one of four positions, either directly towards or away from the monkey or to the left or right. Outer targets were positioned 12.5 cm from the central target. The monkey was then required to wait throughout a delay period of 0.5–1.0 s. Following the delay period, a go tone was presented, and the monkey was only then allowed to move the manipulandum to position the cursor in the illuminated outer target. If the monkey successfully reached the outer target within a 2-s movement period after the go tone, the trial was considered successful and the monkey was presented with a liquid reward.
We modified the standard center-out task on some trials to include a perturbation delivered during the center hold period, before the presentation of an outer target. This perturbation, consisting of a fixed 1-N impulse lasting 125 ms, displaced the hand toward one of the potential targets. We chose the short 125-ms duration to deliver sufficient stimulation to cause a robust sensory response while still being short enough to exclude any voluntary response in the recorded neural activity (Bekkering et al. 1994). The magnitude of the impulse was chosen such that the hand speed during the passive displacement that preceded the monkey's voluntary reaction was similar to that of the initial active movement. After this early (125 ms) phase of the movements, the trajectories for active and passive movements diverged. For this reason, we confined our PD and amplitude response analysis to this early time period.
The use of a manipulandum to which the arm is not attached rather than a rigid exoskeleton (Suminski et al. 2010; Pruszynski et al. 2011) represented a trade-off between highly constrained, planar reaches and minimal constraint. Our manipulandum did not constrain all the degrees of freedom of the arm the way the exoskeleton design can; however, this lack of constraint allowed the monkey to make movements that were closer to a natural reach. Additionally, since it is known that cutaneous receptors on the limb can encode limb movement kinematics (Cohen et al. 1994; Weber et al. 2011), our manipulandum avoided cutaneous stimulation to the proximal limb beyond what would be expected from a natural arm movement. The handle of the manipulandum was allowed to pivot about a vertical axis on low friction bearings to avoid variable cutaneous stimulation to the palm due to slip of the hand across the surface of the handle.
Data collection.
We recorded from 4-mm square, 96-electrode iridium-oxide-coated arrays (Blackrock Microsystems) with an electrode length of 1 mm, implanted towards the posterior edge of the postcentral gyrus, ∼1.5 cm from the midline. More detailed surgical implantation procedures have been described elsewhere (Pohlmeyer et al. 2007; Weber et al. 2011). Neural spike times and waveforms, manipulandum position, target timing and location, and perturbation timing and direction were collected using a Plexon MAP system. Individual units were selected using Plexon Offline Sorter for subsequent analysis. Experimental sessions varied in length but averaged ∼20 trials per target per condition.
To confirm previous results showing S1 activity before movement onset, we collected a set of electromyography recordings (EMGs) from monkey A. EMGs were measured from both heads of the biceps, brachioradialis, pectoralis, three locations on the deltoid, lateral and medial heads of the triceps, latissimus dorsi extensor carpi radialis, and flexor carpi radialis. EMG signals were low-pass filtered at 1 kHz, sampled at 2.5 kHz, rectified and low pass filtered at 10 Hz.
Histology.
We have performed histology to verify the placement of the array cytoarchitectonically for monkeys A and T. The other monkeys are still involved in on-going experiments. The monkeys were deeply anesthetized with Nembutal and perfused first with saline and then with PBS containing 0.25% gluteraldehyde and 4% paraformaldehyde. The brain was removed and placed in fixative for several days. The array was removed, the region around the array site blocked, and the block cryoprotected in 30% sucrose for an additional several weeks.
The brains were sectioned at 30 μm in the coronal plane with a freezing stage microtome. Every 12th section was mounted, stained with cresyl violet, and coverslipped. Electrode tracks from the array were visible in slices even to the naked eye. The boundaries of areas 3a, 3b, 1, 2, and 5 were identified (Paxinos et al. 2000) on a microscope (Axioplan 2, Zeiss) and traced by hand using three-dimensional microscopic reconstruction software (Neurolucida; MBF Biosciences).
All procedures involving animals were conducted under a protocol approved by the Northwestern University Institutional Animal Care and Use Committee.
Data analysis.
Movement onset was defined as the time the handle acceleration crossed the half-max of the largest acceleration peak occurring between the go cue or perturbation and the end of the trial. This definition, considering the second derivative of position, was quite sensitive. The algorithm typically found the onset during passive displacement trials within 2 ms of the delivery of the perturbation. EMG onsets were calculated by finding the point where each averaged, squared EMG signal crossed half max in each movement direction. We then backtracked to last point the signal crossed a level three times its baseline period variance. This method avoided a large number of false positives despite relying on a relatively low threshold.
We computed tuning curves from firing rates in the first 125 ms following movement onset. We fit cosine tuning curves to the data using least-squares regression from the observed firing rates and calculated confidence bounds on the PDs using 1,000 bootstrapping iterations (Stevenson et al. 2011). For either active or passive movement, we classified neuronal discharge as “well tuned” if the 95% confidence interval on the PD was less than ±45°. Note that this definition reflects our confidence in the PD of the cell and not anything about the shape of the tuning curve. As the number of trials per condition increases, the uncertainty of PD will decrease because the expected error improves as the number of samples grows. While we used fewer directions of movement than previous studies (Georgopoulos et al. 1982; Prud'homme and Kalaska 1994), we were still able to find PDs within the confidence bound reported. To verify that PD estimation precision was not reduced as a consequence of the fewer targets, we simulated the responses of cosine tuned neurons for a given number of total trials to either four or eight movement directions and measured the error of the computed PDs. Tuning confidence was determined almost entirely by the number of trials, regardless of whether they were distributed over four or eight targets.
To compute the firing rate of a neuron as a function of time, the spike trains were convolved with the continuous, causal kernel of the form te−t as shown in Eq. 1, where T is the set of spike times, u(t) is the unit step function, and k is a time constant set in this case to 30 ms. This kernel caused a slight delay in the firing rate signal but prevented activity from appearing before actual firing rate changes as would have been the case had we used a symmetrical, noncausal filter such as a Gaussian.
| (1) |
To find the onset of firing rate change accompanying movement, we performed a parametric Poisson change-point analysis. We constructed a perievent histogram with spikes binned at 5 ms for movements in the target direction for which a given cell was maximally activated. We then used a maximum-likelihood estimator to calculate the point at which the firing rate changed from one rate to a second (typically higher) rate as described previously (West and Ogden 1997). This technique calculates a change point that is not constrained to bin boundaries and a 95% confidence interval based on the shape of the likelihood function. We excluded from the timing analyses any cells that had a 95% confidence interval greater than ±150 ms.
RESULTS
We trained monkeys to perform a center-out task (Georgopoulos et al. 1982) modified such that on some trials the monkey's hand was displaced in the direction of a randomly chosen target. These perturbations occurred at random times, without warning, while the monkey was waiting for the target's appearance. We recorded from arrays in five hemispheres of four monkeys using the experimental setup shown in Fig. 1A. Each data set consisted of a few tens of neurons isolated from one of the arrays shown in Fig. 1B. Across the five individual datasets there was a total of 219 neurons.
Fig. 1.
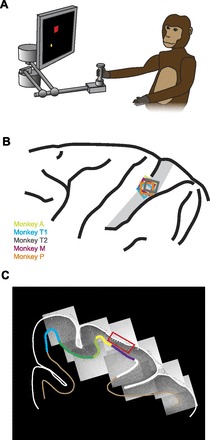
Experimental methods. A: experimental setup. B: locations of recording arrays on postcentral gyrus. Approximate location of area 2 is indicated with gray shading. C: histological coronal section showing location of implant for monkey A (red box) with tracings of the top and bottom of the cortex. Medial wall of the cerebrum is at left. Colors at the gray/white matter boundary indicate the cortical areas: blue, area 4; dark green, area 3a; light green, area 3b; yellow, area 1; purple, area 2; white, area 5. Array was located predominantly in area 2 (purple), with a few electrodes in area 1 (yellow).
We performed a detailed sensory field mapping of the neurons on the array under light ketamine sedation (5 mg/kg) following two of the experimental sessions (those reported for arrays P and T2). From both arrays we found a mix of proprioceptive and cutaneous receptive fields from the proximal arm, predominantly shoulder and elbow, but occasionally wrist. Less systematic evaluations of the other arrays yielded similar results. We occasionally observed cutaneous wrist cells that modulated with either wrist flexion or extension but never observed cutaneous cells with receptive fields in the palm of the hand or the digits. There was no apparent spatial segregation of cutaneous and proprioceptive responsive cells.
Array localization.
We photographed each implant site intraoperatively and summarized array locations relative to surface cortical features (Fig. 1B). Area 2 is a histologically defined area, the gross anatomical position of which varies between individuals. However, we have indicated the approximate location of area 2 based on the sulcus patterns (Pons et al. 1985). In addition, detailed histological analysis is available for monkey A (Fig. 1, C and D) and for both arrays of monkey T. We created a serial reconstruction by tracing each histologically defined region (Paxinos et al. 2000) and assembling the tracings in software (Fig. 1D). Due to the structure of our arrays, the recording sites were all at a similar depth. The array for monkey A (shown in red) was located predominantly in area 2, the intended location of all five arrays. A few anterior electrodes were in area 1. Area 2 extended ∼1.5 mm beyond the posterior edge of the array. Array T1 in monkey T was positioned similarly in area 2 with approximately half of the electrodes in the most anterior row in area 1. Array T2 was rotated ∼45° such that the rows of electrodes were not parallel to the area 1, area 2 boundary. Its position was slightly medial to the other arrays but better centered on area 2. It is possible that one to three electrodes from the anterior and posterior corners extended out of area 2 into areas 1 or 5 respectively, although only one neuron was recorded from these six electrodes. Given the relative array placements in other monkeys, monkey A was the most medial and T2 the most posterior. From this observation we infer that the majority of electrodes on each array were located in area 2, with a few in area 1. It is unlikely that any neurons were recorded in area 5.
Response to limb movement.
Sample kinematic measurements are shown in Fig. 2. The hand speed profiles were very similar during the 125-ms observation window following the onset of movement although they differed markedly afterward. To compare differences in hand speed between active and passive trials, we measured the hand speed at two times after movement onset: 75 and 125 ms. Comparing across monkeys there were no significant differences at either 75 ms (T = 1.63, P = 0.14) or 125 ms (T = 1.27, P = 0.24).
Fig. 2.
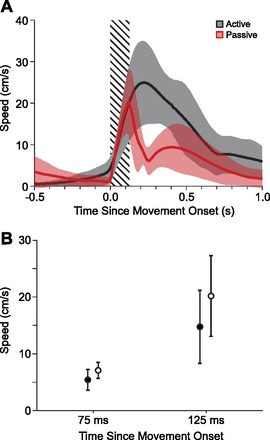
Similarity of movement speed during the observation window. A: solid traces show the average speed during active (red) and passive (black) trials for a representative data set. Shaded regions around the means indicate means ± 1 SD. The 125-ms observation window is hashed. B: no significant differences were found between speeds of active or passive movements at 75 or 125 ms following movement onset.
Many cells showed robust responses to both active and passive movements. Examples of both types of responses, aligned to movement onset, are shown in Fig. 3 for a representative cell. Raw response rasters for movements toward each of the four targets are shown for active (Fig. 3A) and passive (Fig. 3D) movements. Figure 3 also shows the average firing rate fitted to a cosine tuning curve for both active (Fig. 3B) and passive (Fig. 3E) movements. This cell had broad, unimodal directional tuning for both types of movements. The black line above the peak of each tuning curve indicates the 95% confidence region on the cell's PD. Finally, the timing of the increase in firing rate relative to the onset of movement for the maximally activated direction is shown for both active and passive movements (Fig. 3, C and F, respectively). The PD, magnitude of response, and firing onset times for this cell were similar for the active and passive conditions. However, note that the dynamics of firing rate changes were quite different after the initial 125 ms of the movement.
Fig. 3.
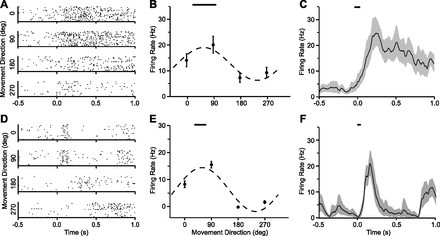
Responses from a representative neuron to the active (A–C) and passive (D–F) tasks. Individual raster plots show timing of spikes to movements in each of the four directions (A and D). Tuning curves are shown in B and E. Bars at the top indicate the 95% confidence interval for the corresponding preferred direction (PD). C and F: time course of the response in the preferred direction, which was 90° for this cell. Bars at the top indicate 95% confidence interval of firing rate onset. Time zero indicates movement onset.
Not all cells had similar responses in the active and passive conditions. Some cells greatly preferred one condition over the other. Of the 219 cells, almost all (198) were modulated by the task (firing rate for at least one of the targets was significantly above or below baseline, α = 0.05; Huffman 1984). Of these, 163 cells were directionally well tuned (PDs within a confidence interval smaller than ±45°, as calculated by the bootstrapping method described above) in at least one of the two conditions. We found a range of responses, from cells that responded predominately to active movements, to those that responded to both active and passive, to those that were most activated by passive movements. Although this distribution was fairly uniform, for the sake of simplicity of discussion we nonetheless classified cells based on whether the responses were well tuned to active movements, passive movements, both or neither. Of the cells that were well tuned in at least one condition 50 were well tuned during active but not passive movements (active-only cells), 49 were well tuned only to passive movements (passive-only cells), and 64 were well tuned to both active and passive movements (nonselective cells). In general, the lack of tuning in a given condition corresponded to minimal discharge. Examples of all three types of responses are shown in Fig. 4.
Fig. 4.
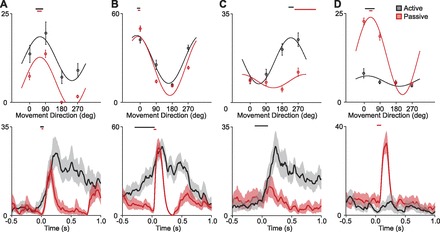
Example responses showing the different cell types observed. Active responses are shown in gray, passive responses in red. Tuning curves are shown above the response time course of the response in the maximally activated direction. From left to right: nonselective cell with no early active response (A), nonselective cell with premovement activity for active movements (B), active-only cell (C), and passive-only cell (D).
Two cells that responded to both types of movement are shown in Fig. 4, A and B; an active-only cell is shown in Fig. 4C, and a passive-only response in Fig. 4D. While active-only cells could be explained simply as the result of excitatory corollary discharge from the motor system, absent during passive movements, passive-only cells (Fig. 4D) would require more complex signal processing. For these cells, the afferent input present during passive movements apparently was suppressed by the motor system during active movement. The observed differences among cell responses cannot be the result of differences in movement speeds, which were by design similar in active and passive conditions. Moreover, as cells in a given data set were recorded simultaneously, one cannot attribute distinct movement preferences (Fig. 4, C and D) to trial-to-trial variability of the movements.
The relation between tuning curve depth of modulation for active and passive movements is plotted in Fig. 5. We found a range of responses from purely passive to purely active and from low to high firing rate. For those cells that were well tuned to at least one of the two movement types, there was no correlation (R2 = 0.052) between the modulation depth for active and passive movements. Well-tuned cells did not on average have higher firing rates than untuned cells (P = 0.27, Student's t-test). Gray symbols denote cells without strong directional tuning for either condition. Relatively few of these unturned cells had significant differences in discharge rate across directions of movement.
Fig. 5.
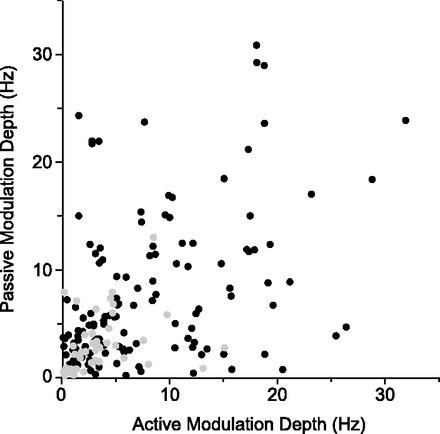
Comparison of the depth of tuning to active and passive movements. For each cell, the amplitude of the passive tuning curve is plotted against the amplitude of the active tuning curve. Cells spanned the range from active only to nonselective to passive only. Cells that did not have significant tuning for either active or passive movements are shown in gray.
PD alignment.
For the nonselective cells in Fig. 4 that responded to both conditions (Fig. 4, A and B), the PDs of the active and passive tuning curves were reasonably well aligned. This was a general property of nonselective cells (Fig. 6). Figure 6A shows the relationship between active and passive PDs for all 64 nonselective cells; the PDs for active and passive movements were generally the same within the confidence interval of most of our PD estimates. Note that since both axes represent angles, the points near the top left and bottom right are actually quite close to the line of equality. Across the nonselective cell population, the circular correlation coefficient (Batschelet 1981) between the active and passive PDs was 0.45. The similarity of active and passive PDs is shown more quantitatively in the difference histogram in Fig. 6B. The active and passive PDs tended to be aligned near the level of precision of our PD determination.
Fig. 6.
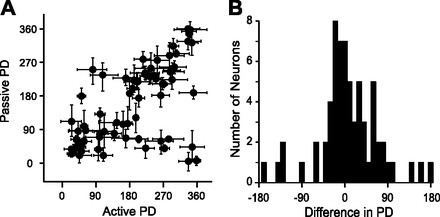
Comparison of preferred directions for active and passive movements. A: for each cell, the passive PD is plotted against the active PD. Error bars represent 95% confidence intervals on the PDs, from bootstrapping. B: histogram of differences: passive PDs minus active PDs. Most PDs were aligned within 45°.
Timing of neuronal response to movement.
Unlike alignment of PDs, the timing of the onset of neuronal response to active and passive movement in the PD was often quite different. The example cell in Fig. 4A burst immediately after movement onset, whether active or passive. In contrast, the different example cell in Fig. 4B began firing several hundred milliseconds before movement onset in the active case, while not firing until after movement onset in the passive case. The termination of movement-related activity differed considerably and systematically between active and passive movements, with that of the passive responses being much sharper. This is likely because in passive trials the stimulus ended after 125 ms and the monkey typically began to move in the anti-PD back to the center target, while on active trials the monkey continued to move in the PD toward the outer target. This finding is consistent with our observation of the kinematics: they were very similar during the first 125-ms period in which we made our measurements but diverged afterwards. Differences in firing rate between active and passive conditions later in the trial undoubtedly resulted from the different kinematics late in the trial.
Across the population of nonselective cells, there was no correlation between the timing of neural activity onset for active and passive movements in the PD (Fig. 7). Figure 7A shows the histogram of response latencies (firing rate onset time minus movement onset time) for active movements, and Fig. 7B shows the corresponding histogram for passive movements. These two histograms differ greatly. The onset of activity in response to active movement was dispersed from ∼200 ms before to 200 ms after the onset of movement. In our EMG measurements, the earliest onset of any muscle in any direction was the lateral head of triceps, which became active 51 ms before movement to the target to the monkey's left (arrows in Fig. 7, A and C). It should be recognized that EMG onset is a conservative estimate of the earliest possible effect of reafferent signals on S1 discharge. There are additional delays caused by muscle contraction, spindle excitation, and transmission to cortex. An earlier study of sensory-related discharge during wrist movements concluded that activity changes occurring 61 ms before movement or earlier could not be driven by movement-related afferent input. They recorded only a small number of neurons from area 2, but the majority of these became active before this cutoff (Nelson 1987). In our study, fully 30% of the premovement responses occurred before a still more conservative 75-ms latency.
Fig. 7.
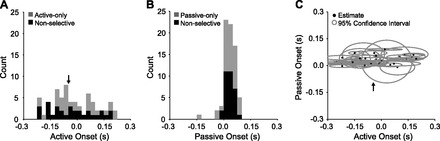
Comparison of time of discharge onset for active and passive movements. Histograms of discharge onset times relative to movement onset are shown for active (A) and passive (B) movements in the maximally activated direction. Zero on the time axis corresponds to movement onset. Nonselective cells are shown in black in both histograms. Active-only cells (in A) and passive-only cells (in B) are shown in gray. C: distribution of times of discharge onset for nonselective cells; the gray ellipses trace the corresponding 95% confidence intervals. Arrows indicate time of the earliest observed average EMG onset.
In contrast to the broad distribution of activity response latencies for active movement, the onset of activity in response to passive movement was clustered more tightly with a mean of 33 ms after movement onset. These latencies are similar to those of responses in M1 to perturbations (Picard and Smith 1992) and to those observed for single joint movements in S1 (Soso and Fetz 1980). Figure 7C shows the lack of correlation between the time of active and passive onsets for all nonselective cells. The size of each ellipse indicates the cell's 95% confidence interval along both the active and passive axes.
The timing of discharge onset for active- or passive-preferring cells was similar to the timing of the corresponding component of nonselective cells. Figure 7A shows a broad distribution of onset times for the active preferring cells and a similarly broad distribution for the responses of the nonselective cells in the active movement conditions. Likewise, the distribution of discharge onset times for passive movements was narrow for passive preferring cells, just as it was for the response of nonselective cells to passive movements (Fig. 7B). This pattern suggests that the single-response cells differ from dual-response (nonselective) cells only in the suppression of responses in one of the two conditions and not in any more complicated timing or spatial tuning.
DISCUSSION
We have quantified the proprioceptive responses of S1 neurons to both active and passive limb movements. Since all data recorded from a given monkey were collected simultaneously, any differences in firing behavior must have been due to differences in the discharge properties of the neurons, not trial-to-trial variability in the monkeys' behavior. We found cells that spanned a range of responses, which we divided into three general types: neurons that responded predominantly to active movements, neurons that responded predominantly to passive movements, and neurons that responded to both active and passive movements. The existence and features of each of these groups helps characterize the functional organization of S1.
Nonselective cells, which respond to both active and passive movements, are perhaps the simplest to explain. Any cell that faithfully represents the kinematics of a movement by virtue of afferent input from sensory receptors would be expected to respond regardless of the cause of the movement, although the details of the response might well differ from cell to cell. We would expect such a nonselective cell to have similar directional tuning curves for active and passive movements, and that is exactly what we observed. For nonselective cells, active and passive PDs were aligned to within our ability to determine them. However, confirming earlier results (Soso and Fetz 1980), we observed that many nonselective and active-only cells became active before the onset of active movement. This suggests that in addition to afferent input, they were also receiving efference copy signals that were aligned with their afferent-driven PD.
The discharge of neurons that responded predominantly to active movements can also be explained directly in terms of receptor activity and efference copy. Building on previous functional and anatomical findings (Soso and Fetz 1980; Woolsey 1984; Kalaska et al. 1989), our data support the idea that much of S1 receives input from the motor system by way of M1. Were any cell in S1 simply to ignore afferent input, the result would be a cell that responds predominantly to active movements. Such a cell need not completely ignore sensory feedback; instead a range of possible responses from active-only to equally strong active and passive responses can be constructed by varying the ratio of sensory weights to efference copy weights. Our results further support this view in that the distribution of onset times in response to active movement of active-only cells matched that of the corresponding response of nonselective cells. That is, the timing of discharge in response to active movement of the neurons that responded only to active movement was similar to that of neurons that responded to both active and passive limb movement. Thus cells ranging from nonselective to active-only can be constructed from differentially weighting the inputs from efference copy, some of which precedes movement onset, and afferent input, which does not.
In contrast to the nonselective and active-only neurons, passive-only neurons cannot be simply explained in terms of the sum of a motor signal and a proprioceptive signal. Passive-only neurons seem to require selective suppression of afferent input to eliminate responses that would otherwise occur during active movement. When the limb is moved volitionally, muscles change length, resulting in spindle activation which is transmitted centrally (Al-Falahe et al. 1990). To respond preferentially to passive movements, efference copy must have a suppressive effect on these passive-only cells (Seki and Fetz 2012). In this model, suppression of the afferent input to passive-only cells during active movement would lead to the similarity that we observed in the passive-movement timing of the discharge of nonselective and passive-only cells.
Previous microneurography results have shown that muscle spindles are directionally tuned and with different sensitivity to active and passive movements (Jones et al. 2001). As in our result, Jones et al. observed that active PDs tended to be aligned with passive PDs. However, primary afferent activity tended to be stronger during active than passive movements, an effect they attributed to increased fusimotor drive. Primary afferent activity alone would not have predicted our demonstration of the existence of passive-only neurons.
One alternative explanation for the active-only and passive-only cells might be that they are responding to cutaneous input, because the forces on the palm are different in the two cases; however, neither the active-only nor passive-only cells can be explained in terms of cutaneous cells with receptive fields in the hand. We never observed a cutaneous hand cell on any of the arrays from which the reported recordings were made. Even if we had, input from cutaneous receptors in the palm of the hand would not cause either response type. Rather, a cutaneous hand cell would respond when its receptive field was compressed. This would occur during active movements in one direction and passive movements in the opposite direction, leading to oppositely directed PDs. This prediction is contrary to our results that active and passive movements have the same PD.
Golgi tendon organs (GTOs) are differentially sensitive to active and passive forces (Crago et al. 1982), but their responses also cannot explain active- or passive-only cells. For active movements, tendons with increased force load are those that pull in the direction of motion. In the case of passive movements, the opposite is true. Thus, as for hypothetical cells responding to cutaneous input from the palm, cells responding predominately to GTOs would be expected to have oppositely directed PDs for active and passive movements. Our results cannot rule out the possibility that there is a subset of cells for which the GTO input is inhibitory, perhaps through 1b inhibitory spinal interneurons. However, for inhibitory GTO input to produce active- or passive-only cells it would need to cancel excitatory spindle input. This is unlikely since GTO and spindle activity would be expected to vary differently under dynamic loads, such as when manipulating an object. Additionally, a cortical role is particularly likely, because such cancelation is not observed in the periphery (Jones et al. 2001). The more likely explanation is that efference copy is subtracted from the spindle driven activity in S1, where they converge.
The presence of multiple types of sensory-motor interaction in S1 has implications for understanding not only the role of proprioception in guiding movements but also more general aspects of sensory physiology. Behavioral studies have long suggested the existence of internal models for sensory motor integration (Wolpert et al. 1995). We note that one such implementation of an internal model is a Kalman filter, which estimates the state of a dynamical system from noisy sensor data combined with knowledge of the system's dynamics. The inputs to a Kalman filter are sensor data and knowledge of a command signal sent to the system being modeled (similar to the description of efference copy). The internal computational elements of the Kalman filter closely parallel the various cell behaviors we found in area 2. For a system to implement a Kalman filter, it must have access to a quantity that reflects the a priori anticipated effects of the command signal (the active-only cells), an error signal calculated by gating or subtracting the expected sensory input from what is actually observed (the passive-only cells), and finally a signal that represents the a posteriori state estimate calculated by combining the two previous quantities (the nonselective cells). These cells contain information similar to what would be represented by an a posteriori state estimate in that they represent the actual state of the limb, much like a purely sensory response. However, the activity before movement onset, of some nonselective cells, suggests that, while faithfully representing limb state, they contain more information than would be available from sensory feedback alone.
These results suggest a specific implementation of a forward model, one that relies on both excitatory and inhibitory effects of active movement on afferent input. It is important to note that the limitations of our experimental paradigm did not allow us to reconstruct a forward model fully. Although we and others have described various characteristics of the representation of force and position and its derivatives (Weber et al. 2011; Gardner and Costanzo 1981; Prud'homme and Kalaska 1994), we do not know the particular combination of kinematic and dynamic variables that are represented. It is possible to predict other features that might be found if S1 were to represent a Kalman filter. For example, one might find cells that calculate the optimal Kalman gain, an estimate of the ratio of the certainty of the sensor measurement to the certainty of the forward model. The Kalman gain might be calculated from the relative variance of the predictions of the forward model to that of the sensory feedback. This gain could then be used to determine how much to weight the two inputs when forming the final estimate of limb state. It would be interesting to look for such signals within a higher brain region projecting into S1.
GRANTS
This work was supported in part by National Institute of Neurological Disorders and Stroke Grant 1R01-NS-048845 to L. E. Miller with further support from the Searle Program for Neurological Restoration of the Chicago Community Trust.
DISCLOSURES
No conflicts of interest, financial or otherwise, are declared by the author(s).
AUTHOR CONTRIBUTIONS
Author contributions: B.M.L. and L.E.M. conception and design of research; B.M.L. performed experiments; B.M.L. analyzed data; B.M.L. and L.E.M. interpreted results of experiments; B.M.L. and L.E.M. prepared figures; B.M.L. and L.E.M. drafted manuscript; B.M.L. and L.E.M. edited and revised manuscript; B.M.L. and L.E.M. approved final version of manuscript.
REFERENCES
- Al-Falahe NA, Nagaoka M, Vallbo AB. Response profiles of human muscle: afferents during active finger movements. Brain 113: 325–346, 1990 [DOI] [PubMed] [Google Scholar]
- Ashe J, Georgopoulos AP. Movement parameters, and neural activity in motor cortex and area 5. Cereb Cortex 4: 590–600, 1994 [DOI] [PubMed] [Google Scholar]
- Batschelet E. Circular Statistics in Biology. San Diego, CA: Academic, 1981 [Google Scholar]
- Bays PM, Flanagan JR, Wolpert DM. Attenuation of self-generated tactile sensations is predictive, not postdictive. PLoS Biol 4: e28, 2006 [DOI] [PMC free article] [PubMed] [Google Scholar]
- Bekkering H, Adam JJ, Kingma H, Huson A, Whiting HT. Reaction time latencies of eye, and hand movements in single- and dual-task conditions. Exp Brain Res 97: 471–476, 1994 [DOI] [PubMed] [Google Scholar]
- Bell C, Bodznick D, Montgomery J, Bastian J. The generation and subtraction of sensory expectations within cerebellum-like structures. Brain Behav Evol 50: 17–31, 1997 [DOI] [PubMed] [Google Scholar]
- Chapman CE. Active versus passive touch: factors influencing the transmission of somatosensory signals to primary somatosensory cortex. Can J Physiol Pharmacol 72: 558–570, 1994 [DOI] [PubMed] [Google Scholar]
- Cohen DA, Prud'homme MJ, Kalaska JF. Tactile activity in primate primary somatosensory cortex during active arm movements: correlation with receptive field properties. J Neurophysiol 71: 161–172, 1994 [DOI] [PubMed] [Google Scholar]
- Crago P, Houk J, Rymer W. Sampling of total muscle force by tendon organs. J Neurophysiol 47: 1069–1083, 1982 [DOI] [PubMed] [Google Scholar]
- Crapse TB, Sommer MA. Corollary discharge across the animal kingdom. Nat Rev Neurosci 9: 587–600, 2008a [DOI] [PMC free article] [PubMed] [Google Scholar]
- Crapse TB, Sommer MA. Corollary discharge circuits in the primate brain. Curr Opin Neurobiol 18: 552–557, 2008b [DOI] [PMC free article] [PubMed] [Google Scholar]
- Cullen KE. Sensory signals during active versus passive movement. Curr Opin Neurobiol 14: 698–706, 2004 [DOI] [PubMed] [Google Scholar]
- Eliades SJ, Wang X. Sensory-motor interaction in the primate auditory cortex during self-initiated vocalizations. J Neurophysiol 89: 2194–2207, 2003 [DOI] [PubMed] [Google Scholar]
- Equibar J, Quevedo J, Jimenez I, Rudomin P. Selective cortical control of information flow through different intraspinal collaterals of the same muscle afferent fiber. Brain Res 643: 328–333, 1994 [DOI] [PubMed] [Google Scholar]
- Gardner EP, Costanzo RM. Properties of kinesthetic neurons in somatosensory cortex of awake monkeys. Brain Res 214: 301–319, 1981 [DOI] [PubMed] [Google Scholar]
- Georgopoulos AP, Kalaska JF, Caminiti R, Massey JT. On the relations between the direction of two-dimensional arm movements and cell discharge in primate motor cortex. J Neurosci 2: 1527–1537, 1982 [DOI] [PMC free article] [PubMed] [Google Scholar]
- Huffman KJ, Krubitzer L. Area 3a: topographic organization and cortical connections in marmoset monkeys. Cereb Cortex 11: 849–867, 2001 [DOI] [PubMed] [Google Scholar]
- Huffman MD. An improved approximate two-sample Poisson test. Appl Stat 33: 224–226, 1984 [Google Scholar]
- Jones KE, Wessberg J, Vallbo ÅB. Directional tuning of human forearm muscle afferents during voluntary wrist movements. J Physiol 536: 635–647, 2001 [DOI] [PMC free article] [PubMed] [Google Scholar]
- Kalaska J, Caminiti R, Georgopoulos AP. Cortical mechanisms related to the direction of two-dimensional arm movements: relations in parietal area 5, and comparison with motor cortex. Exp Brain Res 51: 247–260, 1983 [DOI] [PubMed] [Google Scholar]
- Kalaska JF, Cohen DA, Hyde ML, Prud'homme M. A comparison of movement direction-related versus load direction-related activity in primate motor cortex, using a two-dimensional reaching task. J Neurosci 9: 2080–2102, 1989 [DOI] [PMC free article] [PubMed] [Google Scholar]
- Krubitzer L, Disbrow E. The evolution of parietal areas involved in hand use in primates, 2008 [Google Scholar]
- Merzenich MM, Kaas JH, Sur M, Lin CS. Double representation of the body surface within cytoarchitectonic area 3b, and 1 in “SI” in the owl monkey (aotus trivirgatus). J Comp Neurol 181: 41–73, 1978 [DOI] [PubMed] [Google Scholar]
- Mulliken GH, Musallam S, Andersen RA. Forward estimation of movement state in posterior parietal cortex. Proc Natl Acad Sci USA 105: 8170–8177, 2008 [DOI] [PMC free article] [PubMed] [Google Scholar]
- Nelson RJ. Activity of monkey primary somatosensory cortical neurons changes before active movement. Brain Res 406: 402–407, 1987 [DOI] [PubMed] [Google Scholar]
- Paxinos G, Huang XF, Toga AW. The Rhesus Monkey Brain in Stereotaxic Coordinates. San Diego, CA: Academic, 2000 [Google Scholar]
- Picard N, Smith AM. Primary motor cortical responses to perturbations of prehension in the monkey. J Neurophysiol 68: 1882–1894, 1992 [DOI] [PubMed] [Google Scholar]
- Pohlmeyer E, Solla S, Perreault E, Miller LE. Prediction of upper limb muscle activity from motor cortical discharge during reaching. J Neural Eng 4: 369–379, 2007 [DOI] [PMC free article] [PubMed] [Google Scholar]
- Pons TP, Garraghty PE, Cusick CG, Kaas JH. The somatotopic organization of area 2 in macaque monkeys. J Comp Neurol 241: 445–466, 1985 [DOI] [PubMed] [Google Scholar]
- Prud'homme MJ, Kalaska JF. Proprioceptive activity in primate primary somatosensory cortex during active arm reaching movements. J Neurophysiol 72: 2280–2301, 1994 [DOI] [PubMed] [Google Scholar]
- Pruszynski JA, Kurtzer I, Nashed JY, Omrani M, Brouwer B, Scott SH. Primary motor cortex underlies multi-joint integration for fast feedback control. Nature 478: 387–390, 2011 [DOI] [PMC free article] [PubMed] [Google Scholar]
- Seki K, Fetz EE. Gating of sensory input at spinal, and cortical levels during preparation and execution of voluntary movement. J Neurosci 32: 890–902, 2012 [DOI] [PMC free article] [PubMed] [Google Scholar]
- Soso MJ, Fetz EE. Responses of identified cells in postcentral cortex of awake monkeys during comparable active and passive joint movements. J Neurophysiol 43: 1090–1110, 1980 [DOI] [PubMed] [Google Scholar]
- Staines WR, Brooke JD, McIlroy WE. Task-relevant selective modulation of somatosensory afferent paths from the lower limb. Neuroreport 11: 1713–1719, 2000 [DOI] [PubMed] [Google Scholar]
- Stevenson IH, Cherian A, London BM, Sachs NA, Lindberg E, Reimer J, Slutzky MW, Hatsopoulos NG, Miller LE, Kording KP. Statistical assessment of the stability of neural movement representations. J Neurophysiol 106: 764–774, 2011 [DOI] [PMC free article] [PubMed] [Google Scholar]
- Suminski AJ, Tkach DC, Fagg AH, Hatsopoulos NG. Incorporating feedback from multiple sensory modalities enhances brain-machine interface control. J Neurosci 30: 16777–16787, 2010 [DOI] [PMC free article] [PubMed] [Google Scholar]
- Weber DJ, London BM, Hokanson JA, Ayers CA, Torres RR, Zaaimi B, Miller LE. Limb-state information encoded by peripheral, and central somatosensory neurons: Implications for an afferent interface. IEEE Trans Neural Syst Rehabil Eng 19: 501–513, 2011 [DOI] [PMC free article] [PubMed] [Google Scholar]
- West RW, Ogden RT. Continuous-time estimation of a change-point in a Poisson process. J Stat Comp 56: 293–302, 1997 [Google Scholar]
- Wolpert DM, Ghahramani Z, Jordan MI. An internal model for sensorimotor integration. Science 269: 1880–1882, 1995 [DOI] [PubMed] [Google Scholar]
- Woolsey C. Cortical Sensory Organization: Multiple Somatic Areas. Clifton, NJ: Humana, 1984 [Google Scholar]