

Abstract
It has been proposed that the brain predicts the sensory consequences of a movement and compares it to the actual sensory feedback. When the two differ, an error signal is formed, driving adaptation. How does an error in one trial alter performance in the subsequent trial? Here we show that the sensitivity to error is not constant but declines as a function of error magnitude. That is, one learns relatively less from large errors compared with small errors. We performed an experiment in which humans made reaching movements and randomly experienced an error in both their visual and proprioceptive feedback. Proprioceptive errors were created with force fields, and visual errors were formed by perturbing the cursor trajectory to create a visual error that was smaller, the same size, or larger than the proprioceptive error. We measured single-trial adaptation and calculated sensitivity to error, i.e., the ratio of the trial-to-trial change in motor commands to error size. We found that for both sensory modalities sensitivity decreased with increasing error size. A reanalysis of a number of previously published psychophysical results also exhibited this feature. Finally, we asked how the brain might encode sensitivity to error. We reanalyzed previously published probabilities of cerebellar complex spikes (CSs) and found that this probability declined with increasing error size. From this we posit that a CS may be representative of the sensitivity to error, and not error itself, a hypothesis that may explain conflicting reports about CSs and their relationship to error.
Keywords: cerebellum, motor learning, proprioception, vision
how we perceive the world is at the core of how we behave. As we make a movement, sensory inputs from multiple modalities converge in our brain to create an understanding of the results of that movement. Theory suggests movements may be planned with a forward model, which generates a prediction of our sensory feedback based on the outgoing motor command (Wolpert et al. 1995). If a movement has an unexpected sensory consequence, an error is experienced. Error feedback is rich in nature and can include size, relevance, direction, sensory modality, and other details about the error. Despite the large number of studies on adaptation (Pekny et al. 2011; Shadmehr and Mussa-Ivaldi 1994; Smith et al. 2006), little is known about how we adapt to a single error or how individual sensory prediction errors are processed and combined. Of particular interest are visual and proprioceptive errors, which arguably play the greatest role in control of movement. Here we explore the question of how learning from error depends on error size and sensory modality.
In models of adaptation, it is generally assumed that learning scales linearly with error size (Cheng and Sabes 2006; Scheidt et al. 2001; Smith et al. 2006; Thoroughman and Shadmehr 2000; van Beers 2009). This implies that sensitivity to error is constant as a function of error size. However, experiments suggest that the brain alters sensitivity to error based on its uncertainty about its predictions relative to its uncertainty about observations (Burge et al. 2008; Korenberg and Ghahramani 2002). For example, when visual feedback about the consequences of a movement is blurry, one is less likely to change their motor commands compared with when it is sharp (Izawa and Shadmehr 2008). Even when the quality of the sensory feedback is kept constant, the brain appears to modulate sensitivity to error as a function of error size. For example, Robinson et al. (2003) found that adaptation to saccadic errors declined as the error size increased. Additionally, in reaching tasks, both Fine and Thoroughman (2006) and Wei and Kording (2009) reported that trial-to-trial learning from a force perturbation of increasing size or a visual perturbation of increasing size showed rapid saturation, respectively. That is, learning did not increase linearly with error size.
From a neurophysiological perspective, it is also unclear how the brain encodes error sensitivity. Error-dependent adaptation of movements is generally thought to require integrity of the cerebellum (Martin et al. 1996; Maschke et al. 2004; Rabe et al. 2009; Smith and Shadmehr 2005). Complex spikes (CSs) that are generated by climbing fiber inputs onto Purkinje cells of the cerebellum are considered to be the biological representation of an error signal (Kitazawa et al. 1998). However, when the probability of a CS was measured in response to various error sizes, the probability was high for small errors but decreased for larger errors (Soetedjo et al. 2008). This result is inconsistent with the idea that CSs encode an error, and instead indicates that error size may play a role in plasticity of Purkinje cells.
In addition to errors having different sizes, errors can occur in multiple modalities. The most commonly used adaptation paradigms rely on visual error alone (i.e., a visuomotor rotation) or visual and proprioceptive error concurrently (i.e., a force field). Behavioral studies suggest that learning from visual and proprioceptive errors may occur independently (Bock and Thomas 2011; Krakauer et al. 1999; Pipereit et al. 2006). Furthermore, a recent study of people with cerebellar damage demonstrated that adaptation in these two paradigms relied on different regions of the cerebellum (Donchin et al. 2012; Rabe et al. 2009). Thus it is important to consider the relative contributions of visual and proprioceptive error and understand how the two interact.
Here we performed an experiment to measure sensitivity to error, defined as the ratio of the change in motor output from trial n − 1 to trial n + 1 to the error experienced in trial n. We aimed to understand the role of error size and modality on sensitivity to error in a way that unified the results of past studies. To do so, we performed a one-trial learning experiment in which we varied errors in vision, proprioception, and size of discrepancy throughout the same task. Our results demonstrate that, regardless of sensory modality, sensitivity to error declines with increasing error size. Furthermore, discrepancy between modalities does not significantly modulate error sensitivity; thus learning from each modality may occur independently. Finally, we show that the relationship between sensitivity and error size is similar to the relationship between the probability of a CS and error size. This suggests that the occurrence of a CS may be a reflection of sensitivity to error, and not the error itself.
METHODS
Ten subjects (age 25.8 ± 3.7 yr; 6 women, 4 men) participated in the experiment. The protocol was approved by the Johns Hopkins Institutional Review Board, and all subjects provided written informed consent. All subjects were healthy, right hand dominant, and naive for the purpose of the experiment. Subjects held the handle of a robotic manipulandum with their right hand below an opaque horizontal screen that prevented view of their arm (Fig. 1A). An elastic force helped guide their hand to the start position, indicated by a 6 × 6-mm green square. Once the hand was within 1 cm of the start box, a cursor indicating current hand position was turned on. After stopping within the start box, a target box (6 × 6 mm square) appeared at 8-cm distance and the start box disappeared. There was only a single target, always located 8 cm above the start position. Subjects were required to make a ballistic movement through the target box (a shooting movement), crossing through the target between 150 and 250 ms after the movement start, at which point a “pillow” force field cushioned and slowed their movement and the robot brought the hand back to the target box. The cursor indicating hand position remained on until the hand was returned to the target box. Subjects then received feedback regarding their movement. Feedback consisted of the target box turning red or blue or “exploding,” indicating that the movement was too fast, too slow, or accurate and correctly timed, respectively. For every target explosion, subjects gained a point toward their score. Subjects were instructed to score as many points as possible.
Fig. 1.
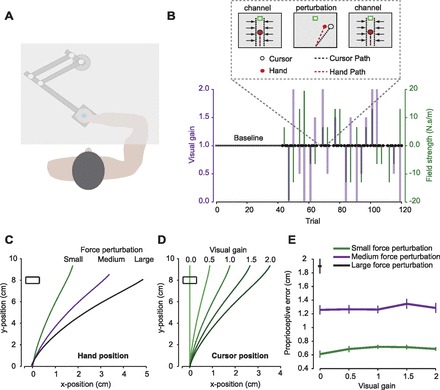
Experimental setup. A: schematic of the experimental setup. Subjects held the handle of a robotic manipulandum and made horizontal reaching movements below an opaque screen. B: perturbation schedule. After a warm-up of 40 trials, subjects were presented with movement triplets in a random order separated by 0, 1, or 2 null field trials for 15 blocks (block 1 is shown). Triplets consisted of a channel trial (C1), one of the possible perturbations (P), and then a second channel trial (C2). Purple trace indicates the size of the visual perturbation, and green trace indicates the size of the proprioceptive perturbation. A channel trial, noted by the thick dark points, clamped the subject's error to 0 while measuring the force produced along the channel wall. The change in force from C1 to C2 measures the amount the subject learned from the error experienced in trial P. C: example of hand trajectories through the small, medium, and large rightward force perturbations. D: example of the cursor trajectory in each of the 5 possible gains as applied to the small proprioceptive error. Visual gains were applied to manipulate visual errors by scaling the lateral deviation of the hand by 1 of 5 values: 0.0, 0.5, 1.0, 1.5, or 2.0. Thus the gain 1.0 trace in this figure corresponds to the small proprioceptive error trace in C. E: proprioceptive error resulting from the 3 different-sized force fields: small, medium, and large. Error was measured as the lateral deviation at 190 ms. Proprioceptive error was consistent for a given field, despite the applied visual gain.
The experiment lasted ∼90 min. There were 10 blocks with 80 movements in each. The experiment began with a warm-up period of 40 movements through a null field to acquaint the subjects with the apparatus.
Perturbations.
Subjects were exposed to 11 different perturbation types, each applied in both the left and right directions. In each block, all of the possible 22 perturbation types appeared once in a random order (Fig. 1B). Thus not only was the overall experiment balanced, but each individual block as well. The perturbation trials consisted of a force perturbation and a visual perturbation. The force perturbation was caused by a velocity-dependent curl force field that applied force perpendicular to the direction of movement,
where ẋ is hand velocity. There were three possible force perturbation sizes, causing a small proprioceptive error (B = ±6.5 N·s·m−1), a medium proprioceptive error (B = ±13 N·s·m−1), or a large proprioceptive error (B = ±19.5 N·s·m−1) to the left or right. Figure 1C shows sample hand trajectories for rightward perturbations. For the small or medium force perturbation one of five possible visual gains was applied to the cursor trajectory. The visual gain, g, scaled the lateral deviation of the hand from the straight line to the target by 0, 0.5, 1, 1.5, or 2. Thus the lateral trajectory taken by the cursor, cx, had either smaller, the same, or larger error than the lateral trajectory taken by the hand, hx:
Examples of these five cursor trajectories as applied to the small proprioceptive error are plotted in Fig. 1D. As can be seen in Fig. 1E, the proprioceptive errors that resulted from the force perturbations were consistent despite the changes in visual gain.
Finally, for the large force perturbation only the gain of 0 was applied, creating a large proprioceptive error with zero visual error. While this additional proprioceptive error size was critical in examining the linearity of the relationship between proprioceptive error and adaptation, we chose to not to apply all visual gains. This is because as perturbation schedules are increasingly random, learning rates decrease (Smith and Shadmehr 2004). Thus we opted for fewer perturbations in favor of a shorter, more efficient experiment.
Quantifying adaptation.
The brain responds to the error in one trial by changing the motor commands in the subsequent trial (Thoroughman and Shadmehr 2000). To quantify this adaptation, we measured the motor output before and after each perturbation trial. Each perturbation trial was preceded with a channel trial (C1) and was then followed by another channel trial (C2), as in Fig. 1B. These triplets of channel-perturbation-channel (C1PC2) were randomly separated by 0, 1, or 2 null field trials, preventing subjects from predicting the timing of the perturbation trials. During a channel trial (Scheidt et al. 2000), the hand path to the target was directed along a straight line with walls that had a spring force (spring coefficient = 2.5 kN/m) and a damping force (damping coefficient = 25 N·s·m−1). This clamped the lateral deviation of the hand to ±3 mm from a straight line between the center of the start box and the center of the target box. There were a total of 440 channel trials throughout the 800-trial experiment. A force transducer housed in the handle of the manipulandum measured the force applied by the subject against the channel walls.
To measure adaptation to the perturbation, we examined the force produced in C2 versus C1. In this way, the force produced in C1 acted as a baseline with respect to C2. In principle, the change in force from C1 to C2 is due to the error experienced in trial P that occurred between C1 and C2 and a natural decay of force from C1 to C2. We were primarily interested in the change due to the learning from error in trial P. To quantify this, suppose that in trial n − 1 we have a channel trial C1, where we measure the motor output f(n − 1). The motor output that the subject produces in the next two trials can then be characterized by three factors: 1) a forgetting factor α; 2) error that was experienced in trial n, labeled as ep(n) (proprioceptive error, i.e., the difference between the predicted and observed proprioceptive feedback) and ev(n) (visual error, i.e., the difference between the predicted and observed visual feedback); and 3) learning from error, labeled as λ(ev, ep):
| (1) |
From Eq. 1 it follows that the change in motor output from C1 to C2 due to learning from error is
| (2) |
To find the forgetting term α, we looked at the average ratio of the force profiles at all instances in the experiment in which there were back-to-back channel trials, i.e., C1C2 pairs. This occurred 121 times for each subject. We found a forgetting constant of α = 0.84 ± 0.07 (mean ± SE). This value is similar to the value of the forgetting term, 0.85, found for the fast state when block adaptation is fit to a multirate model (Joiner and Smith 2008). In this model, the fast state is responsible for the initial stages of learning, which would most appropriately map onto our one-trial learning experiment.
The motor output in a channel trial is measured as the force produced against the channel wall, resulting in a time-dependent force profile. However, the terms in Eq. 1 are scalar quantities and are therefore a proxy for the force trace on each trial. Traditionally, the proxy for the force trace has been the peak force, which would occur after passing the target in this ballistic paradigm, or force at an arbitrary time point. Here, we attempted a more principled approach. We measured the difference in force traces in the channel trials for all C1PC2 triplets for each subject. We then submitted the resulting data set to principal component analysis and found the time point into the force trace in which the first principal component had the largest value. Across our population, the resulting time point had the following distribution: 193 ± 16 ms (mean ± SD) after the start of the movement. As our sampling rate for the data was 100 Hz, we took the time point 190 ms after movement onset to determine the force that the subjects produced on a channel trial and the error that they experienced on a perturbation trial. To be certain that our findings were not too sensitive to this specific error measure, we also examined the data at various time points from early to late in the movement and at varying distances from the start. In all cases, the results were qualitatively the same; therefore we believe our measures of errors and adaptation to be robust. The use of principal component analysis to choose an error measure provides an objective justification for our choice, while accounting for the greatest amount of the variability in the data. Measurements from the left and right perturbation directions were collapsed, and although adaptation and error are oppositely signed, they are plotted in the first quadrant for ease of viewing. Movements that resulted in less than −2 N of learning, and thus showed adaptation in the same direction as the error was experienced, were excluded from our analysis. Across all subject, this discounted 36 movements out of 2,200. All statistics and data analysis were completed with custom software developed on MATLAB (MathWorks), Microsoft Excel, or SPSS (IBM).
RESULTS
We asked volunteers to reach to a target while we imposed a random perturbation on their hand. The trial that preceded the perturbation and the trial that came after the perturbation were channel trials, guiding the hand directly to the target with no error and allowing us to measure the force that subjects produced against the channel walls (Fig. 1B). On the perturbation trial, a force pushed the hand perpendicular to the direction of motion. As a result, learning from error produced a change in the force perpendicular to the direction of motion in the trial that followed the perturbation (Eq. 2). The perturbations consisted of three force perturbations (Fig. 1C) and five visual gains (Fig. 1D). It is important to note that the force perturbations generated a consistent proprioceptive error, despite the various visual gains, as shown in Fig. 1E. We found that there was no significant effect of visual gain on proprioceptive error for the small force perturbation [repeated-measures ANOVA: F(4,45) = 3.08, P = 0.11] or the medium force perturbation [repeated-measures ANOVA: F(4,45) = 3.00, P = 0.11]. This allows us to organize our results into three key subgroups of data: the small and medium proprioceptive error data, which had constant proprioceptive error and varying visual error, and the zero gain data, which had constant visual error and varying proprioceptive error. We will refer to these subgroups throughout our analysis.
Data from a typical subject are shown in Fig. 2, A–D. Figure 2A plots hand trajectory (solid lines) and cursor trajectory (dashed lines) for the five visual gain conditions applied to the medium-size force perturbation. The circles indicate 190 ms from the start of the movement; thus the time point at which we analyze our data occurred at a consistent distance into the movement across all error conditions. Figure 2B shows the change in force from the channel trial preceding the perturbation trial to the channel trial that followed the perturbation trial. As the visual gain increases, the trial-to-trial change in force initially increases but then tends to saturate despite increases in visual error. Using the force at 190 ms as our proxy for the motor output on a given channel trial, Fig. 2C shows the trial-to-trial change in force (Eq. 2) at the given proprioceptive error (medium size) as a function of visual error, with each point representing a different visual gain condition. Here, the relationship between visual error and adaptation can be more clearly observed, and the saturation of learning is apparent. Figure 2D plots adaptation at 190 ms when visual error is constant at zero, i.e., the three zero gain conditions, but proprioceptive error size is increasing. Again, adaptation in response to error size appears sublinear. This single-subject result echoes the results seen in previous one-trial learning studies (Fine and Thoroughman 2006; Wei and Kording 2009), suggesting that sensitivity to error tends to decline as error magnitude increases.
Fig. 2.
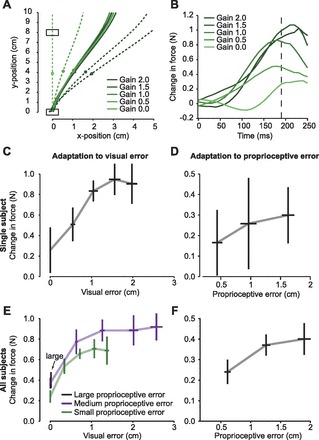
Adaptation tends to saturate as error size increases. A: hand trajectory (solid lines) and cursor trajectory (dashed lines) for a medium-size force perturbation for a representative subject. Circles indicate position at 190 ms from start of movement, which served as our proxy for measuring error. B: a channel trial preceded and followed each perturbation trial in A. This plot shows the change in force from the trial that preceded to the trial that followed the perturbation trial. The change in force represents how much the subject learned from the error in the preceding trial. This learning is small when the visual error is small (gain of 0.0), increases when visual error increases, but then saturates for large visual errors. Dashed line indicates 190 ms into the movement. C: change in force (measured at 190 ms) for the same representative subject across all 5 visual gains (0–2, sequentially from left to right) for the medium force perturbation. Error bars are SE. D: change in force (measured at 190 ms) for the 3 force perturbation sizes (small, medium, and large, from left to right) at 0 visual gain. Error bars are SE. E: group data: change in force as a function of visual error size. Each line represents a single force perturbation size, and each point represents a single visual gain on that proprioceptive error. Error bars are between-subject SE. F: change in force as a function of proprioceptive error size at 0 visual gain. Error bars are between-subject SE.
The group data are summarized in Fig. 2, E and F. Figure 2E illustrates the change in force for the three force perturbation magnitudes as a function of visual error, and Fig. 2F illustrates the change in force for the zero gain conditions as a function of proprioceptive error. In Fig. 2E, each point on the curve represents a different visual gain, increasing from 0 to 2 as visual error increases. If sensitivity to error was constant, the relationship between error size and adaptation would be linear. Upon inspection, it appears that adaptation does not grow linearly with either increasing visual or proprioceptive error size. To test this idea, we fit the data to both a linear model, λ = ae + b, and a logistic model, , where e is the error size and λ is adaptation. For the small proprioceptive error condition, the linear fit yielded r2 = 0.76 and the logistic fit yielded r2 = 0.99. A comparison of the two models using the Akaike information criterion (AIC) found that the goodness of fit was better for the logistic model (AIC = −37.18) than for the linear model (AIC = −20.67). This indicates that the relationship between adaptation and visual error size can be better characterized by a model in which the sensitivity to error is not a constant. We repeated this analysis for the medium proprioceptive error condition and found r2 = 0.59 and 0.99 for the linear and logistic fits, respectively. As with the small field, the AIC again indicates that the logistic model (AIC = −37.4) is a better fit than the linear model (AIC = −17.9). This suggests that sensitivity to visual error is not constant, as adaptation is a nonlinear function of visual error.
We also examined the relationship between proprioceptive error size and adaptation using the three zero gain conditions. The r2 was 0.76 for the linear function and 0.81 for the logistic function, with corresponding AIC values of −18.4 and −19.1, suggesting a better fit for the nonlinear function.
Sensitivity to error as a function of error size.
The observation that trial-to-trial change in force does not grow linearly with error size suggests that the brain may be more sensitive to small errors. However, this statement is ambiguous because it refers to magnitude of error without considering the possibility that learning may be modulated by factors such as discrepancy between errors in each sensory modality (Wei and Kording 2009). That is, it is possible that when one sensory modality reports a small error and the other reports a large error, the discrepancy reduces the likelihood that the error is reliable, resulting in reduced learning. Therefore, from the results in Fig. 2 it is not evident how sensitivity to error changes with error magnitude.
Let us label proprioceptive and visual errors as ep and ev and sensitivity to these errors as bp and bv. Models of motor adaptation often assume a fixed linear relationship between error size and amount of learning (Cheng and Sabes 2006; Smith et al. 2006; Thoroughman and Shadmehr 2000):
If the sensitivity to errors depends on the size of errors and on the discrepancy between these errors, one can imagine that the discrepancy might have an overall modulatory effect on learning:
| (3) |
where bvp describes the influence of discrepancy. This would be a function of the absolute distance between the two errors, equal to 1 for zero discrepancy and tending to 0 for large discrepancies. This function may, for instance, reflect the likelihood that vision and proprioception reported the same event (Wei and Kording 2009).
To dissociate the role of error size from the role of discrepancy between errors, we can consider a trial in which there is no discrepancy in the two sensory modalities, i.e., the gain-one condition where ev(n) = ep(n). In this condition, bvp = 1 (i.e., the term on the right-hand side of Eq. 3) and
| (4) |
To examine this, we binned the data from all movements in the gain-one condition, taking advantage of the natural variability of error size in response to a force field. Bin size was 0.25 cm, and bins with <20 total movements were excluded. Figure 3A plots our resulting estimates of the net sensitivity to error bv(n) + bp(n) as a function of error size. We find that sensitivity to error is not constant as a function of error size but declines as error magnitude increases [repeated-measures ANOVA, main effect of error magnitude, F(2,46) = 8.95, P = 0.001]. This result demonstrates that in the case where sensors agree on the size of the error, the brain is much more sensitive to small errors than large errors.
Fig. 3.
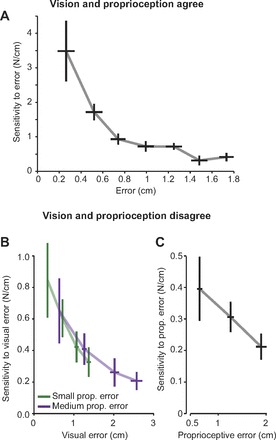
Sensitivity to error declines as error size increases. A: sensitivity to error when visual and proprioceptive modalities are matched. Sensitivity was calculated as described in Eq. 4. Movements from all subjects were binned, and bins with <20 movements were excluded. Bin size was 0.25 cm. Error bars represent SE for each bin. B: sensitivity to visual error as calculated via Eq. 6. Each point along each curve represents a different gain condition, increasing from a gain of 0.5 to 2.0 as visual error increases. The sensitivity declines with increasing visual error and appears independent of proprioceptive error, as evidenced by the fact that the 2 curves coincide. Error bars are between-subject SE. C: sensitivity to proprioceptive error, calculated via change in force in the zero visual gain condition for the small, medium, and large force perturbations. Error bars are between-subject SE.
Sensitivity to visual and proprioceptive error.
The fact that sensitivity to error (Fig. 3A) is not constant implies that λ remains a nonlinear function of ep and ev even when ep = ev. This result suggests that learning depends on the magnitude of individual errors. It is possible that learning is independent of discrepancy and that changes in proprioceptive error and changes in visual error result in independent contributions to adaptation. We can formulate this hypothesis mathematically as
| (5) |
Ideally, true independence could be verified experimentally by holding the magnitudes of error constant while varying discrepancy. Any resulting change in adaptation could be attributed to the change in discrepancy. Here, we attempted to exploit the properties of Eq. 5 to estimate the sensitivity to visual error, bv, at different magnitudes of proprioceptive error. If the resulting visual sensitivity is identical for different magnitudes of proprioceptive error (and therefore, different discrepancies), it is likely that the impact of discrepancy between feedback modalities is negligible. To do this, we first computed the trial-to-trial change in force in the zero-gain visual condition for both the small and medium force perturbations. We then subtracted this change in force from the change in force observed in all other visual gain conditions with the same force perturbation, for each subject. Finally, we divided the result by the size of the visual error:
| (6) |
In Fig. 3B we have plotted this estimate of the sensitivity to visual error at the small and medium proprioceptive error sizes. If sensitivity to visual error is independent of proprioceptive error size, and as such, independent of the discrepancy between ep and ev, then Eq. 5 can be substituted into Eq. 6, reducing it to
| (7) |
where λv(ev(n)) represents adaptation to a visual error only.
We can now examine the sensitivity to visual error alone at two different proprioceptive error sizes. If sensitivity to vision is independent of proprioception, the two curves in Fig. 3B will be continuous with one another and sensitivity at a given visual error will be constant regardless of proprioceptive error size. To compare the two curves, we fit exponential decay functions to the small and medium visual sensitivity curves for each subject, such that bv = βexp(τev). We found that the regression coefficients β (βsmall = 1.39 ± 0.42 and βmedium = 1.05 ± 0.39, mean ± SE) and τ (τsmall = −0.68 ± 0.34 and τmedium = −0.27 ± 0.21, mean ± SE) were not significantly different [paired t-test, β: t(9)= 0.58, P = 0.58, τ: t(9)= −0.84, P = 0.42], despite the medium proprioceptive error being significantly larger than the small proprioceptive error [1-tailed paired t-test, t(39) = 26.9, P < 0.0001]. Because the two curves in Fig. 3B appear to lie on top of each other and can be modeled by statistically indistinguishable exponential functions, it appears that sensitivity to visual error is not modulated by discrepancy between proprioception and vision.
Under the assumption that discrepancy is not responsible for the saturation of learning seen in Fig. 2, we can now examine the changing sensitivity to error more closely. To validate our prediction that visual sensitivity to error decreases with increasing error size, we compared the first and last points in Fig. 3B with a paired, one-tailed t-test and found that sensitivity significantly decreased [t(9) = 2.59, P = 0.01]. Thus it appears that the relative amount of adaptation to a given error size decreases with increasing error size.
We next considered sensitivity to proprioceptive error. We normalized adaptation in the zero-gain visual error condition for each force perturbation (small, medium, and large) by the magnitude of the proprioceptive error. The result, i.e., the sensitivity to proprioceptive error, is plotted in Fig. 3C. There is a significant decrease in sensitivity between the small and large force perturbation [1-tailed paired t-test, t(9) = −2.03, P = 0.036], and thus we see that sensitivity to proprioceptive error is decreasing with error size as well.
Analysis of previously published psychophysical results.
Our main result is that sensitivity to error declines with error size. To determine generality of our inference, we reanalyzed data from previous publications. Wei and Kording (2009) and Fine and Thoroughman (2006) examined single-trial adaptation in response to either a visual perturbation or force field perturbation, respectively. In both cases, error resulting from the perturbation on trial n + 1 was measured as lateral deviation of the cursor relative to a straight line between the start point and the target. Adaptation was measured as the perpendicular change in reach direction from the trial before the perturbation, trial n, to the trial after the perturbation, trial n + 2, i.e., Δx = x(n + 2) − x(n). Thus, to find sensitivity, we divided the reported adaptation, Δx, by error size y˜, giving a unitless measure of error sensitivity:
The results of our analysis are plotted in Fig. 4, A and B.
Fig. 4.
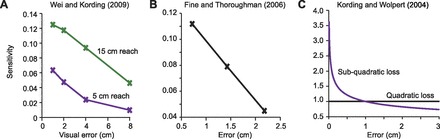
Reanalysis of previously published psychophysical results. A: from Wei and Kording (2009). Adaptation to a visual shift perturbation of increasing size was measured as a change in reach direction in the next movement. There was no proprioceptive error. Sensitivity was calculated as adaptation divided by the visual perturbation for each reach distance, 15 cm and 5 cm. B: from Fine and Thoroughman (2006). Adaptation to force pulses of increasing magnitude was measured as the change in reach direction in the next movement. Sensitivity was calculated as this adaptation divided by error size. C: sensitivity to error as described by the loss function measured in Kording and Wolpert (2004). Subjects adjusted their hand position in a pea shooting task depending on the distribution of errors. From this, a loss function was calculated and found to be a subquadratic function of error. We calculated the sensitivity to error for each loss function, using Eq. 9.
In Wei and Kording (2009) the task was a visuomotor shift paradigm: end point visual feedback was provided and displaced from the hand position by varying amounts, as indicated along the x-axis of Fig. 4A. Therefore, there was only a visual error, while the proprioceptive error was reported as approximately zero. Two separate experiments were done in which the same perturbations were applied to either a 15-cm or a 5-cm reaching movement. As seen in Fig. 4A, the result is a pattern in which sensitivity to error declines with increasing visual error size for both studies. This echoes our finding in Fig. 3B with a paradigm in which there are visual errors without proprioceptive errors.
In Fine and Thoroughman (2006), visual and proprioceptive feedback was consistent and errors were created by use of force pulses of three different magnitudes. Here, error was measured as displacement of the cursor, which was the same as displacement of the hand. Our reanalysis shows that sensitivity to error declines with error size (Fig. 4B). This echoes our finding in Fig. 3A, where we found that sensitivity to error declined without the presence of a discrepancy between error size in vision and proprioception.
Next we considered an experiment in which the objective was not to measure trial-to-trial learning but rather to estimate a loss function. A loss function is a theoretical construct that specifies costs associated with prediction errors, i.e., how much worse is it to have a large prediction error versus a small prediction error? For mathematical convenience, loss functions are often chosen to be quadratic functions of error, such that Ψ = (y − ŷ)2. However, in a creative study by Kording and Wolpert (2004), the loss function for human motor control was determined in a pea shooting task by providing subjects with various distributions of error sizes and examining how they altered their movements in order to maximize the probability of placing a pea in the goal area. They found that the data were most consistent with the following loss function: Ψ = |y − ŷ|1.72. As we will demonstrate, this loss function implies that sensitivity to error must decline as error size increases.
To demonstrate the relationship between sensitivity and error size using this loss function, suppose that our prediction on trial n is a function of some parameters w(n), i.e., ŷ(n) = g(w(n)). To minimize the loss function after experiencing an error, we change our parameters in a direction opposite to the gradient with respect to the parameters:
| (8) |
Thus adaptation can be thought of as the change in w, or Δw = w(n + 1) − w(n). From this, we can calculate sensitivity, where sensitivity to prediction error is the ratio of adaptation to error:
| (9) |
If the loss function is quadratic, which it is often assumed to be, then . When this is substituted into Eq. 9, sensitivity to error is constant as a function of error size. However, if Ψ = |y − ŷ|1.72, as was found in Kording and Wolpert (2004), then sensitivity to error declines with error size: b(ỹ) ∝ |ỹ|−0.28. Both results are plotted in Fig. 4C. We find that if the loss function is subquadratic, then sensitivity to error must decline with error size. These results suggest a consistent pattern of sensitivity to error in various paradigms.
Neural correlate of sensitivity to error.
Error-dependent learning in reaching is known to depend on the integrity of the cerebellum (Criscimagna-Hemminger et al. 2010; Donchin et al. 2012; Maschke et al. 2004; Rabe et al. 2009; Smith and Shadmehr 2005; Tseng et al. 2007). A prominent hypothesis states that cerebellar learning is driven by error signals that are communicated via climbing fibers to Purkinje cells, resulting in complex spikes (CSs) (Albus 1971; Marr 1969). In this theory, CSs encode an error signal, the difference between a prediction and an observation (Kawato 2003). However, in at least some neurophysiological experiments that have recorded CS history during adaptation there is considerable doubt that CSs encode prediction error (Catz et al. 2005; Ojakangas and Ebner 1992; Soetedjo and Fuchs 2006). While there is no doubt that occurrence of CSs is related to some aspect of cerebellar motor learning (Medina and Lisberger 2008), it is unclear whether a CS directly encodes prediction error, or some other measure related to error.
In presenting our psychophysical results, we have viewed adaptation as a process that depends on two factors: sensory prediction errors and sensitivity to those errors. If we label proprioceptive feedback on trial n as p(n) and visual feedback as v(n), then prediction error is a vector:
| (10) |
Trial-to-trial change in motor commands depends on prediction errors as well as sensitivity to error:
| (11) |
In principle, sensitivity to error is a measure of confidence associated with the error, indicating how much we should learn from the error. In our psychophysical results we found that sensitivity to error was not constant as a function of error but tended to decline as error size increased. Here, we wondered whether CSs reflect not error, but rather sensitivity to error.
A recent study by Soetedjo et. al. (2008) examined the probability of a CS in the oculomotor cerebellum as a function of error size in a saccade task. Upon initiation of a saccade to a target at 15°, the target was stepped backward or forward by a random amount. This made it so that at the end of the saccade there was a discrepancy between position of the eye and location of the target. This error resulted in CSs in Purkinje cells. The authors found two populations of Purkinje cells—some with a higher probability of CSs for small errors and some with a more constant probability of CSs for all errors. As described by the authors, the distinction between these two populations of neurons was “somewhat arbitrarily” based on the distribution of time to peak response and variability of the response. We collapsed these data together (Fig. 5) by taking the average of the two populations, weighted by the relative number of neurons in each populations. The result indicates that the probability of a CS decreased with error size. This follows a pattern similar to sensitivity to error in reaching movements but opposite what would be expected if CS was the biological representation of an error. From this, we posit that CSs may not be a reflection of an error signal, but rather the sensitivity to error during adaptation.
Fig. 5.
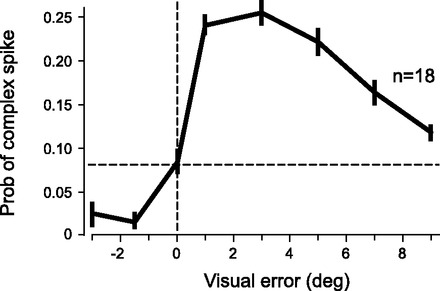
Reanalysis of data from Soetedjo et al. (2008). This plot is a summary of n = 18 Purkinje cells in the cerebellum showing the probability of a complex spike in response to errors of various sizes.
DISCUSSION
When a movement is made and the resulting sensory feedback differs from predicted, an error signal is generated to update subsequent motor commands. A core feature of this adaptation is the sensitivity to error, i.e., the amount the brain changes the motor commands in the trial following an error. Theoretically, this sensitivity can be determined by the relevance of the error signal and our confidence in our sensory feedback. We sought to examine this sensitivity in its most basic form through a single-trial adaptation task, which varied both visual and proprioceptive error sizes. We found that adaptation saturated in response to increasing error size. From this, we calculated sensitivity to error and found that this sensitivity was largest for smallest errors and declined with increasing error size. This was true for both visual and proprioceptive modalities of error and occurred with and without discrepancy between modalities.
Learning from error vs. sensing of error.
Sensitivity to error depends on a process that detects error and a process that learns from that error. Here, we measured trial-to-trial change in motor output, Δf, and computed learning sensitivity, labeled with variable b, as the ratio of Δf to a veridical estimate of error e. We assumed that sensing of error was unbiased, or rather that during the movement sensory feedback provided accurate information regarding the state of the arm. Is there evidence to support this assumption?
If the state of the arm is detected accurately even for large errors, then one would expect that within a given trial the brain would have the ability to correct for that error and bring the hand to the target. Alternatively, if the brain underestimates the size of large errors, then we would expect that the within-trial correction for a given error would show strong biases. Our experiment cannot answer this question because our movements were ballistic (time to reach the target was 150–250 ms), minimizing the opportunity for within-trial correction for the error. However, earlier works can shed light on this issue.
Scheidt et al. (2005) considered point-to-point reaching movements through a force field similar to the medium-strength field that we considered here. The key component of their experiment was a condition in which visual feedback was removed. They reported that in response to the proprioceptive errors alone, the hand corrected for the perturbations and brought the hand to the target (column 2 of their Fig. 2B and row 5 of their Fig. 4). As training in the field continued, the perturbations produced smaller errors, yet the subjects were able to place the hand at the target without changes in accuracy (column 3 of their Fig. 2B and row 5 of their Fig. 4). A second example comes from the work of Veerman et al. (2008). These authors examined within-reach response to a visual error (change in position of the target). They found that doubling the visual error caused the within-reach motor response to double as well. If we use within-trial response to an error as a proxy for how accurately the brain sensed that error, these data would suggest that the brain does not underestimate large errors compared with small errors. Therefore, in our experiment the reduced sensitivity to error as measured via trial-to-trial change in motor output was likely not a reflection of a bias toward underestimating large errors, but rather a reflection of a reduced sensitivity in response to that error.
Additional factors modulating sensitivity to error.
While sensitivity to error may change with error size, it may also change as task parameters are varied, impacting the subject's perception of error size. For example, the two lines in Fig. 4A display the sensitivity to visual error in two paradigms that were identical except for reach distance (Wei and Kording 2009). Why should a 4-cm error in a 5-cm movement produce less learning than a similar-size error in a 15-cm movement? The authors noted that the variability of the end point position for the 5-cm reach was significantly less than that of the 15-cm reach. If the distribution of end point positions for the 5-cm reach is small, then the z-scores of the errors (x-axis of Fig. 4A) would be relatively larger in the 5-cm reach than in the 15-cm reach. Alternatively, if error during a reach is considered with respect to reach amplitude, i.e., if error is measured in terms of angular error, then a 4-cm perturbation during a 5-cm reach is larger than the same perturbation in a 15-cm reach. These parameters of the task can lead to the perception that errors in the 5-cm reach are larger than errors in the 15-cm reach, and may account for the decreased sensitivity to error seen for the 5-cm movement. These are just two examples of how task parameters are potentially impacting the perception of error size. It is likely that the perception of an error, which is a complex and rich signal dependent on many factors, is responsible for the specific shape of the sensitivity curve and the rate of decline. Although our study has demonstrated consistently that sensitivity to error declines with error size, we currently cannot assess the specific shape of the decline across the variety of tasks and perturbation types considered in our results.
Previous work has demonstrated that sensitivity to error decreases when perturbations have a negative trial-to-trial autocorrelation and increases when errors have a positive trial-to-trial autocorrelation (Smith and Shadmehr 2004). This would suggest that the brain learns more from a given error if that error is a good predictor of future errors and learns less if that error is a poor predictor of future errors. This view is consistent with the result that learning rates are higher in blocks in which the perturbation is consistent versus random (Donchin et al. 2003).
Our estimate of sensitivity to error has larger variance for small errors compared with large errors (Fig. 3). This trend is inherent in the calculation of sensitivity. Sensitivity to error is a ratio of two random variables: trial-to-trial change in force and error. If we imagine that these two random variables are Gaussians with arbitrary but constant standard deviations, then as the mean of the random variable in the denominator becomes smaller (i.e., errors become smaller), the variance of the ratio becomes larger (Hinkley 1969). The fact that we have more uncertainty regarding our estimate of error sensitivity at small errors versus large errors is partly a reflection of the fact that our variable of interest depends on the ratio of two random variables.
The impact of discrepancy on adaptation.
Our finding that discrepancy between sensory modalities appeared not to affect error sensitivity is surprising given the speculation of the causal inference model (Wei and Kording 2009). According to that model, sensitivity to error declines when the two sensory modalities disagree. The model assumes that the brain maps various sensory modalities onto a common metric in which errors can be compared. We did not find evidence for modulation of error sensitivity as a function discrepancy between the sensory modalities. Our results may be related to a recent study of cerebellar lesion patients (Donchin et al. 2012). That study quantified adaptation to either a visuomotor (large intermodal sensory discrepancy) or a force field (no discrepancy) perturbation. They found that performances in the two tasks were not correlated to each other but rather seemed related to deficits in distinct regions in the cerebellum. They concluded that adaptation to visual prediction errors relied on cerebellar circuitry that was at least partially independent of the circuitry that was involved in adaptation to proprioceptive prediction errors. Next, consider a condition in which the sense of proprioception is artificially degraded. If discrepancy is relevant, in a visuomotor perturbation paradigm the degradation of proprioception should encourage learning from visual errors. However, degradation of proprioception appears not to affect adaptation in a visuomotor rotation paradigm (Bock and Thomas 2011; Pipereit et al. 2006). Both of these results seem to support the idea that visual and proprioceptive errors are processed independently.
Nevertheless, our result about the impact of discrepancy on sensitivity is a negative one and limited by the relatively small range of discrepancies studied. With the present data, we cannot exclude the possibility that larger discrepancies may have an impact on adaptation.
Complex spikes and error-dependent learning.
Our results suggest that adaptation is the result of two key factors—error and sensitivity to error. Cerebellar models of learning implicate CSs of the Purkinje cell as a biological error signal (Kawato 2003). A basic prediction of the current CS hypothesis is that in the initial phase of training when the errors are large there should be an increase in probability of CSs with respect to baseline. With further training, this probability should decrease as errors are reduced. During saccade adaptation, one study observed the exact opposite: the probability of a CS was small in the initial phase of adaptation when errors were large but then increased as training continued and errors declined in size (Catz et al. 2005). A second study found that despite robust reductions in error there were no corresponding changes in probability of CSs (Soetedjo and Fuchs 2006). This pattern was repeated in a reach adaptation study: probability of CSs initially increased with the onset of training when errors were large but remained essentially unchanged as errors declined (Ojakangas and Ebner 1992). Other than a single study (Gilbert and Thach 1977), no experiment, to our knowledge, has found that as errors become smaller during adaptation training there are corresponding reductions in probability of CSs.
In light of these experimental data, the idea that a CS encodes an error signal that describes in some way the difference between a prediction and an observation seems at best unsubstantiated. However, this does not mean that the cerebellum, or CSs in particular, are not involved in motor adaptation. For example, in a smooth pursuit task, on trials in which there was a CS there were also reductions in the rate of simple spikes on the following trial and a corresponding change in motor commands that reduced error on the next trial (Medina and Lisberger 2008). Therefore, the occurrence of a CS is related to some aspect of cerebellar motor learning, but it may not encode an error signal.
What do CSs encode? Here we propose a new idea. Consider the results of Soetedjo et al. (2008), which showed an inverse relationship between CSs and error size—similar to the relationship we found for sensitivity to error and error size. Perhaps CSs do not encode error but rather a measure of uncertainty about that error, which in turns acts as a signal that modulates learning from error. Essentially, CSs may represent sensitivity to error.
Our framework has the potential to account for an intriguing aspect of neurophysiological data. In the oculomotor vermis, the probability of a CS strongly depends on the direction of the saccade error, resulting in an “on” direction (Soetedjo et al. 2008). For example, when a rightward horizontal saccade is paired with a step-back of the target (gain-down) we have the same error as when a leftward saccade is paired with a step-ahead of the target (gain-up). Therefore, for two saccades that are in opposite directions one can produce the same error vector via gain-up and gain-down. In both cases, these errors are in the “on” direction of the Purkinje cell, resulting in CSs. However, monkeys adapt much less to a gain-up error than a gain-down error (Robinson et al. 2003). If the probability of a CS encodes error, then in these two conditions the error is the same, and probability of a CS should be the same. However, if probability of a CS encodes sensitivity to error, then the fact that the monkey learns more from a gain-down error would imply that in that condition error sensitivity is higher, and therefore probability of a CS should be higher. When we view the probability of a CS in this way, it nicely explains a previous finding: consider the cell shown in Fig. 4 of Soetedjo and Fuchs (2006). When the error vector was gain-down, it caused a greater and more sustained increase in CS activity than when the same error vector was gain-up. Despite equal error magnitudes, the probability of a CS was higher when the sensitivity to error was higher. In some instances, saccades will systematically undershoot the target. This causes the errors to be smaller in the gain-down condition than in the gain-up condition. Nonetheless, both adaptation and the probability of a CS are greater for the gain-down condition, further suggesting that CS activity represents sensitivity to error and not error magnitude.
Implications for patient studies.
In a recent study of patients with cerebellar degeneration, we found that severely affected patients had improved adaptation when the perturbation protocol induced small errors rather than large errors (Criscimagna-Hemminger et al. 2010). This indicates that despite widespread degeneration of the cerebellum, sensitivity to small errors was spared in these patients. If we are right that small errors induce increased probability of a CS discharge, then perhaps the latent adaptation in these patients is a reflection of greater engagement of residual circuits in their cerebellum. Further studies examining how the brain determines an error to be large or small may provide insight into how to design perturbation paradigms these patients can adapt to, and may lead to improvements in therapeutics.
Abnormalities in the weighting of sensory feedback during motor tasks are present in disease populations. For instance, patients with schizophrenia show increased confidence in visual feedback when it is rotated from their actual hand position (Synofzik et al. 2010). In contrast, children with autism have increased generalization of motor learning in proprioceptive coordinates, suggesting an overreliance on proprioception during adaptation (Haswell et al. 2009; Izawa et al. 2012b). Both results may stem from an increased sensitivity to vision or proprioception, respectively. It may prove useful to have a metric, such as the present study, that specifically tests for sensitivity to visual and proprioceptive error as it relates to adaptation.
Why should sensitivity to error decline with error size?
In principle, why might adaptation of reaching exhibit reduced sensitivity to error as error size increases? One possible reason may be the nature of how reaching movements are learned. When one reaches to a target and the hand or the cursor is perturbed, the learning from that error generalizes to neighboring targets. Interestingly, this learning is greatest near the trajectory that the hand actually traveled rather than the trajectory that was intended (Gonzalez Castro et al. 2011; Izawa et al. 2012a; Izawa and Shadmehr 2011). In other words, the generalization patterns suggest that maximum learning is not to the original target (intended movement) but more likely to a neighboring target (near the actually experienced movement). This can be understood in terms of learning that depends strongly on a forward model: a forward model is defined as a map between motor commands and their expected sensory consequences. Suppose that when an error occurs, this map is updated. Theoretically, what one has actually learned is that the motor command issued will result in the observed trajectory, rather than how to generate a trajectory directly to the target. Selecting a motor command that will bring the hand to the target requires this learning to be generalized from the experienced motor-sensory mapping to a desired sensory state. If we assume that generalization of a forward model declines with distance, then this model predicts that sensitivity to error should decline with error size.
While this framework may account for reduced sensitivity to error with error size, it is probably not the sole contributor. Izawa and Shadmehr (Izawa et al. 2012a) measured adaptation to a gradually introduced visuomotor rotation and found that the peak in the generalization function was shifted toward the adapted reach direction, rather than the target direction, when full online feedback was given. This can be considered as evidence for the forward model hypothesis. However, when only end point feedback was provided, the peak of generalization was at the target direction and not the reach direction—thus suggesting that with reduced quality of sensory feedback the learning seems to depend less on the forward model. Our reanalysis of published results includes an instance where only end point feedback was provided, and still there was a decline in sensitivity with respect to error size (Fig. 4A). Thus, while it is possible that the declining sensitivity is partially related to generalization of a learned forward model, it may not fully explain the given results.
Conclusion.
It is believed that upon completion of a movement the brain compares predicted sensory consequences with actual sensory feedback. Any difference between the two leads to an error signal, from which we adapt our subsequent movements for improved performance. Our experiment was designed to yield a better understanding of sensitivity, or the amount we learn from error. State-space model theory would suggest that adaptation with respect to error size is linear, and by varying error sizes in vision and proprioception we could obtain a constant value for sensitivity to error in either modality. Instead, we found that sensitivity declined with error size, regardless of the discrepancy between modalities. A reanalysis of previously published psychophysical results showed a similar pattern of declining sensitivity. Finally, we found that the inverse relationship between error size and sensitivity resembles the pattern seen when the probability of cerebellar CSs was measured with respect to error size. This leads to the new hypothesis that sensitivity to error, not the error itself, may be represented by CSs.
GRANTS
This work was supported by grants from the National Institute of Neurological Disorders and Stroke (NS-37422) and the Human Frontiers Science Program.
DISCLOSURES
No conflicts of interest, financial or otherwise, are declared by the author(s).
AUTHOR CONTRIBUTIONS
Author contributions: M.K.M. and R.S. conception and design of research; M.K.M. and M.D.H. performed experiments; M.K.M. and M.D.H. analyzed data; M.K.M., A.M.H., and R.S. interpreted results of experiments; M.K.M. and R.S. prepared figures; M.K.M. and R.S. drafted manuscript; M.K.M., A.M.H., and R.S. edited and revised manuscript; M.K.M., A.M.H., M.D.H., and R.S. approved final version of manuscript.
REFERENCES
- Albus JS. A theory of cerebellar function. Math Biosci 10: 25–61, 1971 [Google Scholar]
- Bock O, Thomas M. Proprioception plays a different role for sensorimotor adaptation to different distortions. Hum Mov Sci 30: 415–423, 2011 [DOI] [PubMed] [Google Scholar]
- Burge J, Ernst MO, Banks MS. The statistical determinants of adaptation rate in human reaching. J Vis 8: 20.1.19415–20, 2008 [DOI] [PMC free article] [PubMed] [Google Scholar]
- Catz N, Dicke PW, Thier P. Cerebellar complex spike firing is suitable to induce as well as to stabilize motor learning. Curr Biol 15: 2179–2189, 2005 [DOI] [PubMed] [Google Scholar]
- Cheng S, Sabes PN. Modeling sensorimotor learning with linear dynamical systems. Neural Comput 18: 760–793, 2006 [DOI] [PMC free article] [PubMed] [Google Scholar]
- Criscimagna-Hemminger SE, Bastian AJ, Shadmehr R. Size of error affects cerebellar contributions to motor learning. J Neurophysiol 103: 2275–2284, 2010 [DOI] [PMC free article] [PubMed] [Google Scholar]
- Donchin O, Francis JT, Shadmehr R. Quantifying generalization from trial-by-trial behavior of adaptive systems that learn with basis functions: theory and experiments in human motor control. J Neurosci 23: 9032–9045, 2003 [DOI] [PMC free article] [PubMed] [Google Scholar]
- Donchin O, Rabe K, Diedrichsen J, Lally N, Schoch B, Gizewski ER, Timmann D. Cerebellar regions involved in adaptation to force field and visuomotor perturbation. J Neurophysiol 107: 134–147, 2012 [DOI] [PubMed] [Google Scholar]
- Fine MS, Thoroughman KA. Motor adaptation to single force pulses: sensitive to direction but insensitive to within-movement pulse placement and magnitude. J Neurophysiol 96: 710–720, 2006 [DOI] [PubMed] [Google Scholar]
- Gilbert PFC, Thach WT. Purkinje cell activity during motor learning. Brain Res 128: 309–328, 1977 [DOI] [PubMed] [Google Scholar]
- Gonzalez Castro LN, Monsen CB, Smith MA. The binding of learning to action in motor adaptation. PLoS Comput Biol 7: e1002052, 2011 [DOI] [PMC free article] [PubMed] [Google Scholar]
- Haswell CC, Izawa J, Dowell LR, Mostofsky SH, Shadmehr R. Representation of internal models of action in the autistic brain. Nat Neurosci 12: 970–972, 2009 [DOI] [PMC free article] [PubMed] [Google Scholar]
- Hinkley DV. On the ratio of two correlated normal random variables. Biometrika 56: 635–639, 1969 [Google Scholar]
- Izawa J, Criscimagna-Hemminger SE, Shadmehr R. Cerebellar contributions to reach adaptation and learning sensory consequences of action. J Neurosci 32: 4230–4239, 2012a [DOI] [PMC free article] [PubMed] [Google Scholar]
- Izawa J, Pekny SE, Marko MK, Haswell CC, Shadmehr R, Mostofsky SH. Motor learning relies on integrated sensory inputs in ADHD, but over-selectively on proprioception in autism spectrum conditions. Autism Res 5: 124–136, 2012b [DOI] [PMC free article] [PubMed] [Google Scholar]
- Izawa J, Shadmehr R. On-line processing of uncertain information in visuomotor control. J Neurosci 28: 11360–11368, 2008 [DOI] [PMC free article] [PubMed] [Google Scholar]
- Izawa J, Shadmehr R. Learning from sensory and reward prediction errors during motor adaptation. PLoS Comput Biol 7: e1002012, 2011 [DOI] [PMC free article] [PubMed] [Google Scholar]
- Joiner WM, Smith MA. Long-term retention explained by a model of short-term learning in the adaptive control of reaching. J Neurophysiol 100: 2948–2955, 2008 [DOI] [PMC free article] [PubMed] [Google Scholar]
- Kawato M. Cerebellum and motor control. In: The Handbook of Brain Theory and Neural Networks, edited by Arbib MA. Cambridge, MA: MIT Press, 2003, p. 190–195 [Google Scholar]
- Kitazawa S, Kimura T, Yin PB. Cerebellar complex spikes encode both destinations and errors in arm movements. Nature 392: 494–497, 1998 [DOI] [PubMed] [Google Scholar]
- Kording KP, Wolpert DM. The loss function of sensorimotor learning. Proc Natl Acad Sci USA 101: 9839–9842, 2004 [DOI] [PMC free article] [PubMed] [Google Scholar]
- Korenberg A, Ghahramani Z. A Bayesian view of motor adaptation. Curr Psychol Cogn 21: 537–564, 2002 [Google Scholar]
- Krakauer JW, Ghilardi MF, Ghez C. Independent learning of internal models for kinematic and dynamic control of reaching. Nat Neurosci 2: 1026–1031, 1999 [DOI] [PubMed] [Google Scholar]
- Marr D. A theory of cerebellar cortex. J Physiol 202: 437–470, 1969 [DOI] [PMC free article] [PubMed] [Google Scholar]
- Martin TA, Keating JG, Goodkin HP, Bastian AJ, Thach WT. Throwing while looking through prisms. I. Focal olivocerebellar lesions impair adaptation. Brain 119: 1183–1198, 1996 [DOI] [PubMed] [Google Scholar]
- Maschke M, Gomez CM, Ebner TJ, Konczak J. Hereditary cerebellar ataxia progressively impairs force adaptation during goal-directed arm movements. J Neurophysiol 91: 230–238, 2004 [DOI] [PubMed] [Google Scholar]
- Medina JF, Lisberger SG. Links from complex spikes to local plasticity and motor learning in the cerebellum of awake-behaving monkeys. Nat Neurosci 11: 1185–1192, 2008 [DOI] [PMC free article] [PubMed] [Google Scholar]
- Ojakangas CL, Ebner TJ. Purkinje cell complex and simple spike changes during a voluntary arm movement learning task in the monkey. J Neurophysiol 68: 2222–2236, 1992 [DOI] [PubMed] [Google Scholar]
- Pekny SE, Criscimagna-Hemminger SE, Shadmehr R. Protection and expression of human motor memories. J Neurosci 31: 13829–13839, 2011 [DOI] [PMC free article] [PubMed] [Google Scholar]
- Pipereit K, Bock O, Vercher JL. The contribution of proprioceptive feedback to sensorimotor adaptation. Exp Brain Res 174: 45–52, 2006 [DOI] [PubMed] [Google Scholar]
- Rabe K, Livne O, Gizewski ER, Aurich V, Beck A, Timmann D, Donchin O. Adaptation to visuomotor rotation and force field perturbation is correlated to different brain areas in patients with cerebellar degeneration. J Neurophysiol 101: 1961–1971, 2009 [DOI] [PubMed] [Google Scholar]
- Robinson FR, Noto CT, Bevans SE. Effect of visual error size on saccade adaptation in monkey. J Neurophysiol 90: 1235–1244, 2003 [DOI] [PubMed] [Google Scholar]
- Scheidt RA, Conditt MA, Secco EL, Mussa-Ivaldi FA. Interaction of visual and proprioceptive feedback during adaptation of human reaching movements. J Neurophysiol 93: 3200–3213, 2005 [DOI] [PubMed] [Google Scholar]
- Scheidt RA, Dingwell JB, Mussa-Ivaldi FA. Learning to move amid uncertainty. J Neurophysiol 86: 971–985, 2001 [DOI] [PubMed] [Google Scholar]
- Scheidt RA, Reinkensmeyer DJ, Conditt MA, Rymer WZ, Mussa-Ivaldi FA. Persistence of motor adaptation during constrained, multi-joint, arm movements. J Neurophysiol 84: 853–862, 2000 [DOI] [PubMed] [Google Scholar]
- Shadmehr R, Mussa-Ivaldi FA. Adaptive representation of dynamics during learning of a motor task. J Neurosci 14: 3208–3224, 1994 [DOI] [PMC free article] [PubMed] [Google Scholar]
- Smith MA, Ghazizadeh A, Shadmehr R. Interacting adaptive processes with different timescales underlie short-term motor learning. PLoS Biol 4: e179, 2006 [DOI] [PMC free article] [PubMed] [Google Scholar]
- Smith MA, Shadmehr R. Modulation of the rate of error-dependent learning by the statistical properties of the task. Proc Adv Computational Motor Control 3, 2004 [Google Scholar]
- Smith MA, Shadmehr R. Intact ability to learn internal models of arm dynamics in Huntington's disease but not cerebellar degeneration. J Neurophysiol 93: 2809–2821, 2005 [DOI] [PubMed] [Google Scholar]
- Soetedjo R, Fuchs AF. Complex spike activity of purkinje cells in the oculomotor vermis during behavioral adaptation of monkey saccades. J Neurosci 26: 7741–7755, 2006 [DOI] [PMC free article] [PubMed] [Google Scholar]
- Soetedjo R, Kojima Y, Fuchs AF. Complex spike activity in the oculomotor vermis of the cerebellum: a vectorial error signal for saccade motor learning? J Neurophysiol 100: 1949–1966, 2008 [DOI] [PMC free article] [PubMed] [Google Scholar]
- Synofzik M, Thier P, Leube DT, Schlotterbeck P, Lindner A. Misattributions of agency in schizophrenia are based on imprecise predictions about the sensory consequences of one's actions. Brain 133: 262–271, 2010 [DOI] [PubMed] [Google Scholar]
- Thoroughman KA, Shadmehr R. Learning of action through adaptive combination of motor primitives. Nature 407: 742–747, 2000 [DOI] [PMC free article] [PubMed] [Google Scholar]
- Tseng YW, Diedrichsen J, Krakauer JW, Shadmehr R, Bastian AJ. Sensory prediction errors drive cerebellum-dependent adaptation of reaching. J Neurophysiol 98: 54–62, 2007 [DOI] [PubMed] [Google Scholar]
- van Beers RJ. Motor learning is optimally tuned to the properties of motor noise. Neuron 63: 406–417, 2009 [DOI] [PubMed] [Google Scholar]
- Veerman MM, Brenner E, Smeets JB. The latency for correcting a movement depends on the visual attribute that defines the target. Exp Brain Res 187: 219–228, 2008 [DOI] [PMC free article] [PubMed] [Google Scholar]
- Wei K, Kording K. Relevance of error: what drives motor adaptation? J Neurophysiol 101: 655–664, 2009 [DOI] [PMC free article] [PubMed] [Google Scholar]
- Wolpert DM, Ghahramani Z, Jordan MI. An internal model for sensorimotor integration. Science 269: 1880–1882, 1995 [DOI] [PubMed] [Google Scholar]