

Abstract
Environmental enrichment induces powerful changes in the adult cerebral cortex. Studies in primary sensory cortex have observed that environmental enrichment modulates neuronal response strength, selectivity, speed of response, and synchronization to rapid sensory input. Other reports suggest that nonprimary sensory fields are more plastic than primary sensory cortex. The consequences of environmental enrichment on information processing in nonprimary sensory cortex have yet to be studied. Here we examine physiological effects of enrichment in the posterior auditory field (PAF), a field distinguished from primary auditory cortex (A1) by wider receptive fields, slower response times, and a greater preference for slowly modulated sounds. Environmental enrichment induced a significant increase in spectral and temporal selectivity in PAF. PAF neurons exhibited narrower receptive fields and responded significantly faster and for a briefer period to sounds after enrichment. Enrichment increased time-locking to rapidly successive sensory input in PAF neurons. Compared with previous enrichment studies in A1, we observe a greater magnitude of reorganization in PAF after environmental enrichment. Along with other reports observing greater reorganization in nonprimary sensory cortex, our results in PAF suggest that nonprimary fields might have a greater capacity for reorganization compared with primary fields.
Keywords: cortical plasticity, phase-locked responses, voice onset time, nonprimary cortex, receptive field
environmental enrichment reorganizes anatomical and physiological characteristics of the adult cerebral cortex. Morphological studies reveal that environmental enrichment increases cortical thickness (Diamond et al. 1966; Katz and Davies 1984), oligodendrocyte-to-neuron ratio (Katz and Davies 1984), dendritic branching (Bose et al. 2010; Greenough et al. 1973; Volkmar and Greenough 1972), dendritic spines (Globus et al. 1973), and synapses per neuron (Sirevaag and Greenough 1987). Physiological studies in primary visual, somatosensory, and auditory cortex provide evidence that enrichment induces neurons to respond more selectively and more strongly to sensory stimuli (Beaulieu and Cynader 1990a; Cai et al. 2009; Coq and Xerri 1998; Engineer et al. 2004). Enrichment also alters temporal response properties of primary sensory cortex neurons (Beaulieu and Cynader 1990b; Percaccio et al. 2005). The physiological consequences of environmental enrichment in sensory cortices outside of primary cortex have yet to be examined.
Sensory conditioning generates greater changes in nonprimary sensory cortex compared with primary cortex. For example, operant conditioning causes greater orientation tuning changes in V4 neurons compared with V1 neurons (Raiguel et al. 2006). Tone fear conditioning generates discharge reorganization in more nonprimary auditory cortex neurons compared with primary auditory cortex (A1) (Diamond and Weinberger 1984). Pairing a tone with stimulation of nucleus basalis causes relative narrowing of receptive fields in posterior auditory field (PAF) that is not observed in A1 (Puckett et al. 2007). These studies led us to hypothesize that enrichment will induce a greater magnitude of change in nonprimary auditory cortex compared with changes documented in A1 (Engineer et al. 2004; Percaccio et al. 2005).
We conducted our study in the extensively characterized PAF. Compared with A1, PAF neurons have broader receptive fields and slower response times (Doron et al. 2002; Pandya et al. 2008), and PAF prefers responding to slowly modulated stimuli (Heil and Irvine 1998; Loftus and Sutter 2001; Pandya et al. 2008; Phillips et al. 1995; Tian and Rauschecker 1998). PAF is well-established as a nonprimary cortical field distinct from A1.
To test our hypothesis that enrichment would generate greater reorganization in PAF compared with A1, we exposed rats to the same environment for the same time period as used in our earlier enrichment study in A1 (Engineer et al. 2004; Percaccio et al. 2005). Rats were housed in either a standard cage (1–2 rats in an animal colony cage) or an enriched auditory environment. In the enriched auditory environment, activity of four to eight rats triggered activity- and location-specific sounds. A CD player provided a rich variety of sounds, some of which triggered the release of a sugar pellet. After 8 wk of standard or enriched housing, we anesthetized the rats and used sound-evoked multiunit, local field potential (LFP), and isolated single-unit recordings to probe the effect of enrichment in PAF.
METHODS
Sixteen female Sprague-Dawley rats aged 25 postnatal days (60–80 g) were placed in either enriched or standard environments for 8 wk. Male and female rats process acoustic input differently (Fitch et al. 1993). To avoid the possibility of any sex-based variability in cortical processing of sounds, we restricted our study to female rats. The enriched and standard housing conditions were identical to those in earlier reports published from our lab (Bose et al. 2010; Engineer et al. 2004; Kilgard et al. 2007; Nichols et al. 2007; Percaccio et al. 2005). Rats in both environments received food and water ad libitum, were on a reverse 12:12-h light-dark cycle, and were exposed to the same constant temperature and humidity levels.
Environmental Exposure
Enriched environment.
Eight rats were housed in a large cage (45 × 76 × 90 cm) located in a room separate from the main rat colony. The enriched housing cage had four levels linked by ramps (Fig. 1B). Hanging chains and wind chimes hung over the entrance of two levels and produced unique sounds with rat movements. A rat's movement onto two of the three ramps triggered delivery of a ramp-specific tone (lowest ramp = 2.1 kHz; highest ramp = 4 kHz). The weight of the rat on the ramp triggered the tone from a speaker located at the same height as the bottom of that ramp and horizontally 10 cm lateral from the ramp. The duration of the tone was the brief time spent by the rat on the ramp during transit. Each rotation of the exercise wheel evoked a tone (3 kHz). A magnet on the circumference of the exercise wheel triggered a 3-kHz tone each time it came within range of a magnet detector. The duration of the tone depended on the speed of the wheel rotation. The location of the speaker was at the same height as the base of the wheel and horizontally 10 cm lateral from the wheel. Activation of a motion detector near the water source resulted in an electronic chime from a speaker located at the same height as the water source, horizontally 10 cm lateral to the water source. The duration of the chime was the time the animal was in motion. In this report, “chime” refers to the musical sound made by a Portable Motion Detector Chime manufactured by RadioShack (catalog no. 49-426, Fort Worth, TX). A tone refers to a sinusoidal wave-shaped pure tone. Each of these sounds was behaviorally triggered, and with more than one rat in the environment there could be more than one speaker emitting a sound sometimes. With spectrally different triggered acoustic stimuli, each of which varied in duration depending on rat behavior, the occurrence of each behaviorally triggered sound had unique spectral and temporal features that provided behaviorally meaningful information about the location and activity of other rats in the cage.
Fig. 1.
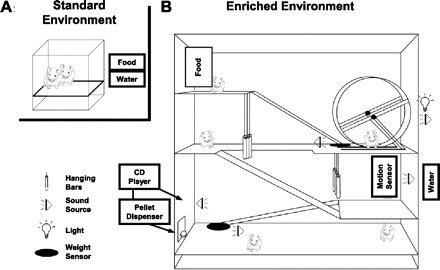
Schematic diagram of standard and enriched housing conditions. A: standard-housed rats were 1–2 in a hanging cage in the animal colony room. B: enriched-housed rats were 4–8 in a large cage separate from the animal colony room. The cage had 4 levels linked by ramps. Sounds like ramp movement triggered tones (2.1 and 4 kHz); hanging chains, wind chimes, a motion detector-triggered electronic chime near the water source, and an exercise wheel-triggered tone (3 kHz) provided unique spectral and temporal features that provided behaviorally meaningful information about the location and activity of other rats in the cage. The rats were exposed to 74 randomly selected sounds—simple tones, amplitude-modulated and frequency-modulated tones, noise bursts, and other complex sounds (rat vocalizations, classical music, rustling leaves, etc.)—every 2–60 s from a CD player, 7 of which triggered a pellet dispenser to release a sugar pellet to encourage attention to the sounds. While the number of complex sounds heard by the standard-housed rats (from other neighbor cage rats and regular animal room traffic) was similar to that in enriched housing, the enriched environment was designed to have sounds that were more behaviorally meaningful.
The rats were exposed to 74 randomly selected sounds every 2–60 s from a CD player, seven of which triggered a pellet dispenser (Med Associates, St. Albans, VT) to release a sugar pellet to encourage attention to the sounds. The sounds from the CD player were emitted from a speaker 10 cm behind and 1 ft. above the receptacle inside the enrichment cage for the sugar pellet. The location of this speaker was different from that for behaviorally driven sounds. The sounds included simple tones, amplitude-modulated and frequency-modulated tones, noise bursts, and other complex sounds (rat vocalizations, classical music, rustling leaves, etc.). The rewarded tracks included interleaved tones of different carrier frequencies (25-ms-long, 4-, 5-, 9-, 12-, 14-, and 19-kHz tones with interstimulus intervals ranging from 50 ms to 2 s) and frequency-modulated sweeps (1 octave up or down in a 140- or 300-ms sweep with interstimulus intervals ranging from 80 to 800 ms). Rats in the enriched environment were exposed to these sounds spanning their entire hearing range (1–45 kHz, <75 dB SPL), 24 h/day.
The enriched environment was designed to provide more varied and behaviorally meaningful acoustic information to indwelling rats. A previous study using the same environment documented 1) that the environments were probably not distressful, 2) that the interval between complex sounds was significantly shorter in the enriched environment, and 3) that the total numbers of complex sounds in the enriched and standard environment were similar (Percaccio et al. 2005). Since both experimental groups of rats were exposed to the same number of complex sounds and cortical reorganization only occurred in rats in the enriched environment, this suggests that it was not the number of sounds but the behavioral relevance of sounds (as enhanced by the designed apparatus) in the enriched environment that drove cortical reorganization. After 4 wk in the enriched environment, rats reached sexual maturity and a vasectomized male rat was added to the cage to encourage natural social interactions appropriate for the age.
Standard environment.
Eight age-matched rats were housed one or two per cage (26 × 18 × 18 cm) in the animal colony room (Fig. 1A). Standard-housed rats heard sounds related to typical animal center room traffic and vocalizations from 30–40 other similarly housed rats.
All methods and procedures were in accordance with guidelines set by the National Institutes of Health (NIH) for ethical treatment of animals and received the approval of the University Committee on Animal Research at the University of Texas at Dallas.
Acute Surgery
Physiological experiments were conducted after 8 wk of differential housing. Anesthesia for surgery was induced by pentobarbital sodium [50 mg/kg intraperitoneally (ip)] to achieve a state of areflexia and maintained with supplemental dilute pentobarbital (8 mg/kg ip). The rat's level of anesthesia was monitored by heart rate, breath rate, and toe pinch. A rectal temperature probe provided feedback to a heating pad to hold the core body temperature at 37°C. Fluid balance was maintained with a 1:1 mixture of 5% dextrose and Ringer lactate (∼0.5 ml/h). The trachea was cannulated to administer humidified air, ensure adequate ventilation, and minimize breathing sounds. The cisterna magna was drained to prevent cerebral edema. The temporalis muscle was retracted, and the skull bone and dura over the right auditory cortex were removed. Viscous silicon oil was added to the brain surface to prevent desiccation. Electrode penetration points were referenced with vascular landmarks and marked on a digitized photograph of the auditory cortex surface.
Experimenters were blind to the housing condition of the rat during surgery and recordings, although in some cases unkempt fur of the rat on the recording table indicated that the rat might have been housed in the enriched environment.
Stimulus Presentation
Acoustic stimuli were presented to the anesthetized rats in a double-walled sound-attenuating chamber from a speaker (Motorola model 40-1221) at 90° azimuth and 30° elevation from the base of the left ear. Frequency and intensity calibrations were done with Tucker-Davis Technologies (Alachua, FL) SigCal software and an ACO Pacific (Belmont, CA) microphone (PS9200-7016).
Tones.
Randomly interleaved pure tones (1,296; 25-ms duration, 3-ms ramps, every 500 ms) were generated with BrainWare (Tucker-Davis Technologies). The tones consisted of 81 logarithmically spaced frequencies from 1 to 32 kHz, each at 16 different intensities spaced 5 dB SPL apart from 0 to 75 dB SPL.
Noise burst trains.
Twelve repetitions of 14 noise burst trains (3- to 20-Hz interstimulus intervals) were presented, with each noise burst 25 ms in duration and 60 dB in intensity with ramps of 3 ms and a bandwidth of 1–32 kHz. Each train was presented 2 s after the termination of the last train. The 168 noise burst trains were randomly interleaved.
Speech.
Natural speech sounds /tad/ and /dad/ were recorded from a single native English speaker in a sound booth with a sampling rate of 44,100 Hz. As in our earlier study, the sounds were frequency shifted 1 octave higher with a vocoder without altering the amplitude envelope to better match the rat hearing range (Engineer et al. 2008). The intensity of each speech sound was adjusted so that the loudest 100 ms was 65 dB SPL. Speech sounds were presented in random order, each speech sound repeated a total of 20 times, with a sampling rate of 100 kHz and a silent interval of 2 s separating each stimulus presentation.
Recording
Two pairs of Parylene-coated tungsten microelectrodes (FHC, Bowdoin, ME) with 250-μm separation (1.5 ± 0.5 MΩ) were inserted orthogonal to and 600–680 μm below the pial surface (layer IV/V) of the auditory cortex to record multiunit activity from ∼60 penetration sites per animal (standard = 61.7 ± 4.8 sites, enriched = 60 ± 8.6 sites). Spikes and LFP data were acquired simultaneously. The neural signals from the electrode were filtered with a high-pass filter (0.3–8 kHz) for multiunit activity and a low-pass filter (2–100 Hz) for LFPs and amplified by a factor of 10,000 with hardware (RX5-2, RP2, PA5) and software (BrainWare) provided by Tucker-Davis Technologies. Responses >600 mV were recorded as action potentials. Single units were isolated with BrainWare software.
Data Analysis
We started all our recordings by first demarcating the A1-PAF border and then progressed posteriorly with recording sites. In three rats, two from the enriched group and one from the standard group, unintended puncture of a major blood vessel resulted in early termination of the acute recording and resulted in few PAF recording sites, most of them close to the A1-PAF border. Onset latencies get longer and more variable in PAF neurons with posterior progression of recording sites (Doron et al. 2002). Adding data from an incompletely sampled posterior extent of PAF could introduce a sampling error. For example, adding data from sites closer to the A1-PAF border would bias the population mean onset latency to lower values. Onset latencies are correlated with repetition rate transfer functions (RRTFs) (Kilgard and Merzenich 1999) and with bandwidths (Loftus and Sutter 2001). To avoid the possibility of a sampling error confound, we restricted data analysis to those animals with relatively equal posterior extent of recording sites.
Tuning curve analysis.
Tuning curves were determined for each site by recording responses to 81 tones spanning 5 octaves, each at 16 different intensities. Plotting the response of a site to tones on a frequency-intensity grid revealed a tuning curve (Fig. 2, B and C). Tuning curve parameters were defined by a program written in MATLAB (The Mathworks, Natick, MA). The response threshold was defined as the lowest intensity that elicited a reliable neuronal response. The frequency at which this threshold response occurred was defined as the characteristic frequency (CF).
Fig. 2.
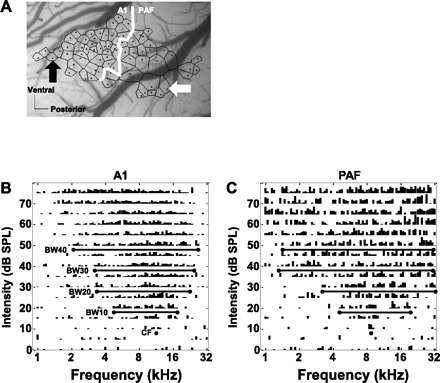
Recording from the auditory cortex of rats. A: representative photomicrograph of the right temporal cortex of a rat housed in the standard environment. Each dot represents a recording microelectrode penetration site. Site locations were chosen with a view to avoid visible blood vessels and record from an area wide enough to include posterior auditory field (PAF) and posterior-most primary auditory cortex (A1) neurons. Black and white arrows point to A1 and PAF recording sites respectively, illustrated in B and C and in Fig. 3. The black line polygon surrounding each site was generated by Voronoii tessellation. Each polygon represents an estimation of the cortical region with properties similar to that of the recording site within the polygon. Representative multiunit tuning curves from A1 and PAF are depicted in B and C, respectively. The length of each vertical line within a tuning curve represents the number of evoked action potentials from 14 to 85 ms after onset of the tone. The frequency that elicits a consistent neural response at the lowest intensity level (neural threshold) was defined as characteristic frequency (CF). The range of frequencies that evoke action potentials at 10, 20, 30, and 40 dB above neural threshold were defined as bandwidths BW10, BW20, BW30, and BW40, respectively. Note the relatively larger receptive field (bandwidths) seen in the PAF example shown. Scale bars in A, 0.25 mm.
For 10, 20, 30, and 40 dB above threshold, the lowest and highest tone frequencies that elicited a reliable response and were contiguous with the rest of the frequencies within the bandwidth were considered the lower and upper edge of each bandwidth. The spontaneous firing rate was calculated as the spike rate in the 200 ms recorded before onset of the speech stimuli. Onset latency was the time from the onset of the stimulus to the earliest reliable neural response reaching two standard deviations above spontaneous firing rate (Fig. 3). End latency was defined as the time when the poststimulus time histogram (PSTH)—created by summing responses to all the tones within a site's tuning curve with a bin size of 1 ms (Fig. 3)—returned to response levels less than two standard deviations above spontaneous firing rate. The two-standard deviation criterion was not used to exclude any sites from analysis. The criterion was simply used as a standard measure for every site to define the time of the onset and end of neural responses. Voronoii tessellation was used to illustrate cortical topography (Kilgard and Merzenich 1998). BrainWare was used to visualize waveforms of spikes recorded from each site. With BrainWare .src files, spike sorting for single-unit analysis was done on the basis of features like first peak amplitude, second peak amplitude, and spike area. The researcher analyzing the waveforms was blind to the source of the housing group of the data being analyzed.
Fig. 3.
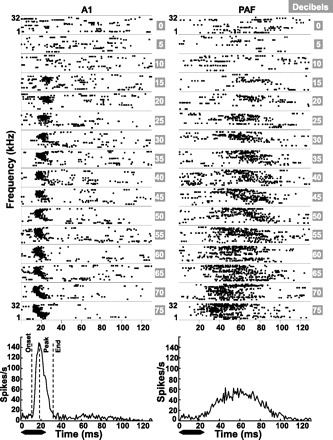
Representative dot rasters and poststimulus time histograms (PSTHs) from multiunit recordings in A1 and PAF of a rat housed in the standard environment. Left: recording site in A1 (black arrow in Fig. 2). Right: site in PAF (white arrow in Fig. 2). Each panel contains raster plots of spikes recorded at 1 tone intensity (0–75 dB SPL) plotted as a function of tone frequency (81 logarithmically spaced frequencies from 1–32 kHz, 1 row/trial per frequency). The PSTH generated from these spikes (1-ms bins) is given below each set of dot raster panels for A1 (left) and PAF (right). Onset, peak, and end of response latencies were then computed from the PSTH. Note the slower onset and peak latencies and longer response duration in the PAF example shown compared with the example from A1. The black bar below each PSTH indicates the duration of the tone relative to the neural responses.
Sites were classified as being in A1 or PAF by determining the A1-PAF border. The A1-PAF border was based on 1) the abrupt interruption of a decreasing tonotopic gradient at the A1-PAF border, 2) an increase in bandwidths with posterior progression of sites from A1, and 3) an increase in onset and peak latencies with posterior progression of sites from A1. In addition, the reversing tonotopic gradient at the ventral-posterior border of A1 (Doron et al. 2002) was used as a marker for the A1-PAF border. A1 border sites with driven response to tones for which a CF could not be defined were not classified as being in A1.
Noise burst train analysis.
PSTHs were computed with 1-ms bins. A site's response to successive noise bursts was quantified by RRTFs. A normalized RRTF for a repetition rate was calculated by finding the average evoked response to the last five noise bursts and dividing that by the evoked response to the first noise burst (Kilgard and Merzenich 1998). Hence, values >1 indicate facilitation and values <1 indicate depression. The spontaneous firing rate was calculated as the spike rate in the 200 ms recorded before onset of the speech stimuli for that site. Action potentials within a time window of 14–85 ms after the onset of a noise burst in a noise burst train were considered as having occurred in response to the noise burst. The 14–85 ms time period is designed to include onset and response durations of neurons in PAF and is the same as that used in a previously published PAF study in rats (Pandya et al. 2008), to allow for comparison. For noise burst trains presented at rates >10 Hz, the time windows associated with each noise burst in a train would overlap. Hence for rates >10 Hz the time window began 14 ms after the onset of the second noise burst and ended 85 ms after the onset of the sixth noise burst.
To examine the synchronization between neuronal firing and repeated noise bursts, we estimated vector strength (R) (Goldberg and Brown 1969) as done in previous studies from our group (Pandya et al. 2008; Percaccio et al. 2005). Essentially, vector strength is an indicator of the precision with which neurons lock their firing of action potentials to the same phase of the stimulus period. A value of 1 would indicate perfect time-locking, i.e., all action potentials fire at the same time relative to the noise burst onset, while a value of 0 indicates no time-locked responses. For calculation of vector strength, the whole period from noise burst start to noise burst start was used. Vector strength was calculated as follows:
where n = total number of action potentials, ti is the time of occurrence of the ith action potential, and T is the interstimulus interval. To assess the statistical significance of the vector strength, we measured the Rayleigh statistic (2nR2, where n = total number of action potentials) (Liang et al. 2002). A value >13.8 indicates statistically significant phase locking (Mardia and Jupp 2000).
Speech analysis.
The average spike rate for each speech sound was estimated in 1-ms bins from the PSTH. A recording of spontaneous activity for 200 ms prior to the onset of the speech stimuli was used to calculate spontaneous firing rate (spikes/s). The speech stimulus was repeated 20 times, yielding 20 values of spontaneous firing rate for that site. Mean and standard deviation were determined from the 20 trials. The spontaneous discharge rate was subtracted from the mean firing rate in all analyses. Speech sound /tad/ consists of an initial high-frequency /t/ sound, followed by the onset of a low-frequency voicing sound, followed by the high-frequency /d/ sound. Pilot data in controls (later validated by experimental data; see Fig. 13) indicated an end of response to the onset of voicing by 140 ms. A period of 14–140 ms was chosen to compute response strength to the onset of the speech sound. The response strength calculated was only used to exclude nonresponsive sites.
Fig. 13.
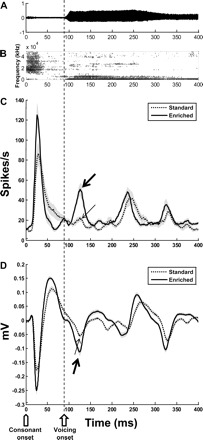
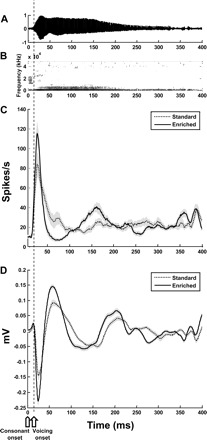
Environmental enrichment enhances response of PAF neurons to a temporal cue in speech sound /tad/. Time-amplitude representation of /tad/ in A and /tad/ speech spectrogram in B illustrate that for speech sound /tad/, after initiation of the consonant sound (open pentagon on time axis), there is a ∼70-ms delay in the onset of voicing, i.e., the onset of the vibration of vocal cords (onset of voicing indicated by open arrow on time axis and dotted line that runs through all panels). Mean population multiunit (C) and LFP (D) responses from PAF neurons (standard = 156 sites, enriched = 127 sites) indicate that enriched rat PAF responds significantly stronger to the onset of voicing (thick arrow) compared with standard housed rats (thin arrow). Gray areas indicate SE.
Analysis of synchronicity of spikes in spike trains from paired electrodes.
Among the four microelectrodes inserted into the auditory cortex, any two microelectrodes simultaneously recording from PAF were considered as a pair and their recorded spike trains were analyzed for spike coincidences as done in an earlier study (Kilgard et al. 2007). For each pair, multiunit activity recorded simultaneously was subjected to a pairwise cross-correlation analysis. The number of spike coincidences between the two electrode spike trains was counted for each bin (bin size = 1 ms) for various time shifts (−50 to 50 ms) (Brosch et al. 2005). Cross-correlation functions were computed 1) using 200 ms before onset of a stimulus for spontaneous activity cross-correlation and 2) using 200 ms after onset of a noise burst for driven activity cross-correlation. Simultaneous sensory stimulation of neurons at the two paired sites could introduce a covariation in firing rates. To remove the effect of sensory stimulation-induced covariation in firing rate, the shift predictor was computed and subtracted from the cross-correlation function for each 1-ms bin (Perkel 1967).
All tests for statistical significance were done by two-tailed unpaired t-test unless otherwise specified. Population means for the two groups mentioned in parentheses in results are given as mean ± SE. All data analysis was done off-line to avoid a potential bias in site selection and by an observer blind to the housing condition of the rat for the data being analyzed.
RESULTS
General Observations
Extracellular multiunit and LFP data were recorded from 283 sites in PAF (standard = 156 sites, enriched = 127 sites) from 13 rats (standard = 7, enriched = 6). Single-unit sorting revealed 25 well-isolated single units (standard = 10, enriched = 15). In addition, while the boundaries of PAF were determined, 79 multiunit recordings were obtained from the ventral auditory field (standard = 45 sites, enriched = 34 sites) and 179 from A1 (standard = 110 sites, enriched = 69 sites). A1 low-frequency neurons were identified by their antero-posterior (AP) frequency gradient, onset latencies shorter than adjoining nonprimary fields, and narrow receptive fields. In addition, the reversing tonotopic gradient at the ventral-posterior border of A1 (Doron et al. 2002) was used as a marker for the A1-PAF border. Although the number of A1 recordings in this study was low and included mostly low-frequency sites, enriched A1 low-frequency neurons (1–4 kHz CF) demonstrated a significant increase in response strength measured by LFPs (mean amplitude of first major negative deflection N1 in response to a single 60-dB noise burst: standard = −0.19 ± 0.02 mV, enriched = −0.32 ± 0.07 mV; P = 0.0385) and displayed a statistically insignificant trend toward decreased receptive field bandwidth (mean bandwidth 20 dB above threshold: standard = 2.31 ± 0.09 octaves, enriched = 2.05 ± 0.13 octaves; P = 0.09). These findings are consistent with a previous environmental enrichment study from our lab (Engineer et al. 2004). A1 neurons progressively decrease in CF with posterior extent, and a sharp interruption of this frequency gradient at A1's posterior limit demarcates the A1-PAF border (Doron et al. 2002; Pandya et al. 2008). In agreement with earlier studies, neurons in PAF in our study had greater onset latencies and wider bandwidths, which contrasted sharply with A1 neurons at the A1-PAF border (Fig. 4, A and B). The distribution of CFs of sites in PAF for both housing groups was similar (mean CF: standard = 2.59 ± 0.12 octaves, enriched = 2.8 ± 0.12 octaves; P = 0.11). The AP length and total area of sampled PAF were similar in enriched- and standard-housing rats [AP length: standard = 1.07 ± 0.15 mm, enriched = 1.35 ± 0.18 mm (P = 0.38); area: standard = 0.71 ± 0.15 mm2, enriched = 1.07 ± 0.18 mm2 (P = 0.24)]. Neural thresholds of tone-evoked multiunit responses were similar in standard- and enriched-housing rats (standard = 14.05 ± 1.3, enriched = 17.07 ± 1.1; P = 0.8). PAF neurons from standard- and enriched-housing rats had similar multiunit spontaneous firing rates (standard = 9.36 ± 0.8 spikes/s, enriched = 10.85 ± 0.8 spikes/s; P = 0.17).
Fig. 4.
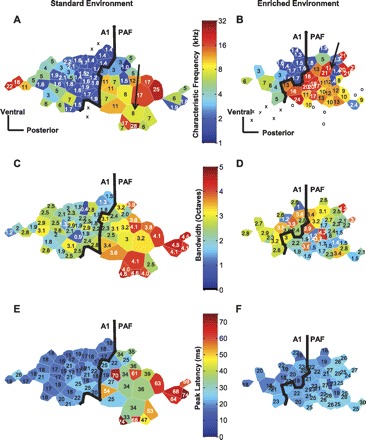
Representative PAF maps from standard- and enriched-environment rats demonstrate narrower receptive fields and faster time to peak response in enriched rats. Each polygon represents 1 recording microelectrode site. The color of the polygon and the value within it represent the parameter being mapped. The thick black line denotes the A1-PAF border. In A and B, color represents CF of the recorded site from multiunit recordings. Note the gradual decrease in CF of sites with posterior progression in A1; the interruption of this frequency gradient at the A1-PAF border was used as a criterion to classify sites as belonging to A1 or PAF. In addition, the reversing tonotopic gradient at the ventral-posterior border of A1 (Doron et al. 2002) was used as a marker for the A1-PAF border. Black arrows indicate sites used for representative tuning curves and PSTHs in Fig. 5 and Fig. 6. In C and D, color represents multiunit receptive fields (bandwidth 30 dB above neuronal threshold). For the standard-housed rat cortex illustrated in C, note that PAF has greater bandwidths than A1. This distinction was used as a criterion to confirm the A1-PAF border. Note that enriched rat PAF had narrower bandwidths than standard housed rat PAF. In E and F, color indicates time to peak response for multiunit recordings. For the standard-housed rat cortex depicted in E, note that PAF neurons had slower peak latency times compared with A1. Peak response times were used as criteria to distinguish PAF from A1 sites. For the enriched rat cortex illustrated in F, note that PAF sites had greater response times compared with A1 sites but these PAF response times were much quicker than standard-housed rat PAF. Open circles in A and B indicate sites that did not respond to tones. Sites that responded to tones but did not meet our criteria for A1 or PAF are indicated by “x”. Scale bars in A and B, 0.25 mm.
PAF Receptive Fields Decrease After Enrichment
In an earlier study in A1, enrichment decreased multiunit receptive field bandwidths by 7% for tone intensities 40 dB (BW40) above threshold intensity (Engineer et al. 2004). For less loud tones, there was no significant effect on bandwidths. In contrast, PAF exhibited decreased multiunit bandwidths across almost all tone intensities after enrichment (Fig. 4, C and D, Fig. 5). Enrichment's strongest effect on bandwidths in PAF—i.e., a 35% decrease in BW10—was 5 times its strongest effect in A1. Receptive fields demonstrate more reorganization in PAF than in A1 after environmental enrichment.
Fig. 5.
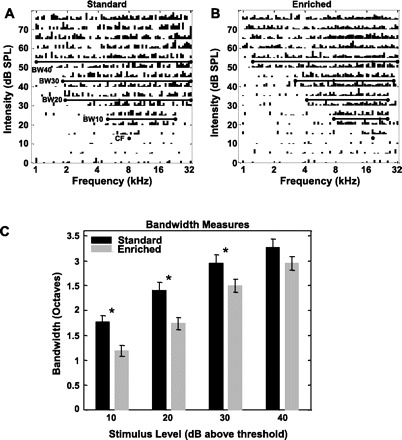
Receptive fields in PAF of enriched rats are narrower than those in standard housed rats. A and B: representative tuning curves from multiunit recordings in PAF of standard (A)- and enriched (B)-housing rats. The position of the representative sites are indicated by an arrow in Fig. 4, A and B. The 2 representative sites are approximately equidistant (∼0.4 mm) from the posterior-most point in the A1-PAF border. Bars in C plot the mean receptive field (bandwidth) size for 10, 20, 30, and 40 dB above neural threshold for standard (black)- and enriched (gray)-housing rats. Receptive fields are significantly narrower for the enriched group for almost all intensities above neural threshold. *Statistical significance at P < 0.01, 2-tailed t-test.
We compared the magnitude of receptive field reorganization in a subset of broadly tuned A1 cells to a matched subset of PAF cells with similar receptive field sizes. To determine the magnitude of bandwidth reorganization in A1, we analyzed data collected previously by Engineer et al. (2004). In control A1, recordings from a broader receptive field subset (75th–95th percentile, hereafter referred to as A1BW75–95) had values ranging from 2.05 to 2.9 octaves for bandwidths 20 dB above threshold. For a A1BW75–95 subset in environmentally enriched animals, bandwidths were 7% smaller (mean A1BW75–95: standard = 2.34 ± 0.03 octaves, enriched = 2.18 ± 0.03; P < 0.001).
The subset of PAF control neurons with bandwidths matching control A1BW75–95 (i.e., with BW20 values ranging from 2.05 to 2.9 octaves) had values between the 31st and 60th percentile (hereafter referred to as PAFBW31–60). For the PAFBW31–60 subset in enriched animals, bandwidths were 46% smaller than control PAFBW31–60 (mean PAFBW31–60: standard = 2.53 ± 0.05 octaves, enriched = 1.37 ± 0.4; P < 0.001). Our data demonstrate that for neurons in PAF and A1 with similar receptive field sizes, PAF neurons undergo a much greater magnitude of reorganization compared with A1 neurons.
PAF Neurons Respond More Quickly and More in Synchrony with Stimuli After Enrichment
In a previous study, enrichment did not alter onset response times in A1 neurons (Engineer et al. 2004). An increase in the number of A1 tone-evoked action potentials induced by enrichment contributed to a delayed peak response, a delayed end of response, paired-pulse depression, and decreased time-locking to stimuli in A1. In sharp contrast, PAF neurons responded significantly quicker after enrichment. In response to a tone, multiunit action potentials began firing earlier and reached peak firing rate in almost half the time of standard-housed rat PAF neurons (Fig. 4, E and F, Fig. 6, Fig. 7). The return of neuronal firing rate to spontaneous levels took less time than taken by rats housed in standard cages. The rapid rise to peak firing rate and quick return to baseline led to a significantly shorter response duration compared with standard-housing rats (Fig. 7). LFP responses reflect a weighted linear summation of the extracellular potentials of cells that change their membrane potential in response to presented sounds. In essence, LFPs reflect dendritic activation of local cells (Kaur et al. 2004; Mitzdorf 1987). The first major negative peak in the evoked LFP response corresponds to the influx of dendritic current—the sink—and is referred to as N1 (∼35 ms). Enrichment significantly decreased the time to maximum amplitude for N1 in PAF (standard = 41.5 ± 2.13, enriched = 34.01 ms ± 1.63; P = 0.005). Since quicker onset latencies are correlated with better cortical following rates (Kilgard and Merzenich 1999), we predicted that PAF neurons would have a better ability to respond robustly to rapidly presented sounds after enrichment. Besides, an earlier study employing the same environment used in our study revealed that although the total number of sounds was similar in both environments, the average interval between the occurrence of complex sounds in the enriched environment (∼108 ms) was significantly shorter than that in the control environment (∼133 ms) (Percaccio et al. 2005). To examine the impact of rapidly occurring environmental acoustic input with a probe stimulus that all PAF neurons respond to, we used repeated noise burst trains during physiological experiments.
Fig. 6.
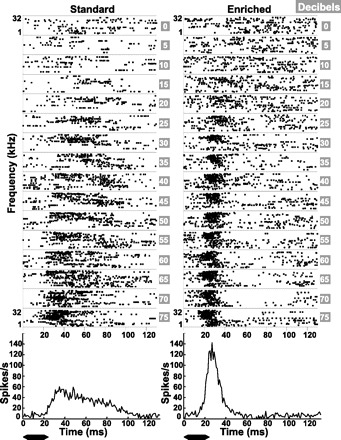
Representative dot rasters and PSTHs from multiunit recordings in PAF. Left: recording site from a rat housed in the standard environment. Right: site from a rat housed in an enriched environment. The PSTH generated from these spikes (1-ms bins) is given below each set of dot raster panels for the example site from a standard-housing rat (left) and an enriched-housing rat (right). The position of the example sites within PAF are indicated by an arrow in Fig. 4, A and B. Since response times increase with posterior progression of recording sites in PAF (Doron et al. 2002, Fig. 6), 2 sites approximately equidistant (∼0.4 mm) from the posterior-most point in the A1-PAF border were chosen to represent the 2 housing groups and illustrate the difference in response times between them. The black bar below each PSTH indicates the duration of the tone relative to the neural responses.
Fig. 7.
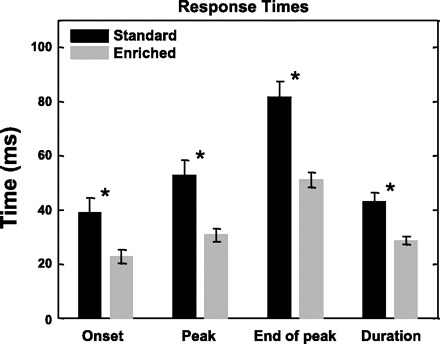
Environmental enrichment induces quicker responses with shorter response durations in PAF neurons. Bars plot average response times and response duration for standard (black) and enriched (gray) housing rats. *Statistical significance at P < 0.01, 2-tailed t-test.
PAF neural responses have characteristics similar to a low-pass filter. For repeated acoustic stimuli with long interstimulus intervals, PAF neurons respond almost as well to successive stimuli as they do to the first. For more rapid incoming acoustic input, neurons respond more weakly to successive stimuli (Pandya et al. 2008). In agreement with these prior studies, our standard-housed rat PAF response to a successive noise burst was almost as strong as its response to the first noise burst for repetition rates up to 7.5 Hz in multiunit recordings (Fig. 10A). With more rapid modulation rates, the neuronal response to repeated stimuli progressively decreased (Figs. 8A and 10A). In contrast to standard-housing rat neurons, environmental enrichment induced enhancement of PAF neuronal response to rapidly repeated sounds (Figs. 8B and 10A). The average best modulation rate (the modulation rate that evoked most action potentials) for enriched rats was significantly higher than that for standard-housing rats (standard = 4.13 ± 0.27 Hz, enriched = 5.29 ± 0. 37 Hz; P = 0.014). After responding to the first noise burst in a train, enriched neurons needed less time to recover. The average limiting repetition rate (the fastest repetition rate that evoked a response at least 50% of the best modulation rate) was significantly greater after enrichment (standard = 8.49 ± 0.44 Hz, enriched = 10.93 ± 0.42 Hz; P < 0.001). Enriched neurons were more resistant to undergoing paired-pulse depression. For example, at a modulation rate of 8.5 Hz, standard rats had a mean normalized response significantly less than 1, denoting paired-pulse depression, whereas enriched rats responded to the second noise burst with 20% more spikes than evoked for the first noise burst (Fig. 10A). For faster repetition rates, the enriched PAF neurons underwent a lesser degree of paired-pulse depression. At a repetition rate of 10.5 Hz, standard-housing rat PAF neurons had minimal response to the second noise burst in a train (Fig. 9A), barely 20% of the response to the first noise burst. In contrast, enriched PAF neurons had a distinct robust second response, with a magnitude 80% of the response to the first noise burst. LFP findings mirrored that seen by multiunit recordings (Figs. 9B and 10B).
Fig. 10.
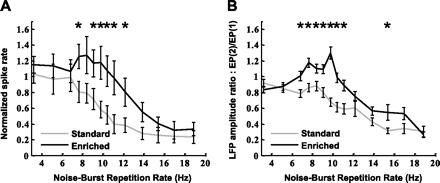
Response of PAF neurons to noise bursts repeated at different speeds. In A, ratio of the mean number of action potentials evoked by 2nd–6th noise bursts in a train with respect to the 1st noise burst is plotted for each repetition rate. In B, the ratio of the LFP amplitude evoked by the 2nd noise burst in a train [EP(2)] with respect to the 1st noise burst [EP(1)] is plotted for each repetition rate. A value above 1 indicates increased response to the 2nd noise burst compared with the 1st noise burst. These results indicate that environmental enrichment enhances the activation response of PAF neurons to each iteration of a rapidly repeating stimulus. Significant differences between the groups: *P < 0.05 by 2-tailed, unpaired t-test. Error bars indicate SE.
Fig. 8.
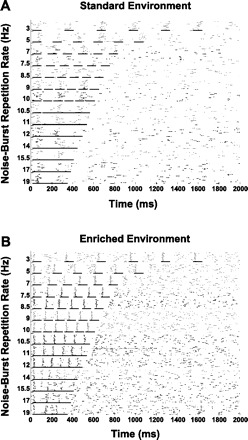
Representative individual dot rasters from multiunit recordings in response to noise burst trains presented at different speeds, from standard-housed (A) and enrichment-housed (B) rat PAF neurons. Note the ability of enriched rat PAF neurons to respond robustly to all 6 noise bursts in a train for rates beyond 10 Hz, while standard-housed rat PAF neurons lose this ability at slower rates of noise burst iterations. The leftmost short horizontal lines mark time windows used to quantify response to the first noise burst. The other short horizontal lines indicate time windows used to calculate responses to subsequent noise bursts in a train of a total of 6 noise bursts.
Fig. 9.
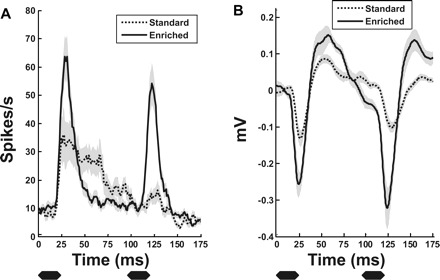
Population mean PSTHs in response to noise burst iterations at 10.5 Hz (95 ms between onset of each noise burst). A: mean multiunit PSTH response. B: mean local field potential (LFP) response. Note that standard-housed rat PAF neurons (dashed) undergo considerable paired-pulse depression while the enriched rat PAF neurons (black) have minimal depression of response to the second noise burst in a train presented at 10.5 Hz. Gray areas indicate SE. Black bars below each PSTH indicate the duration of the noise burst relative to the neural responses.
Enrichment induced neurons to fire more in time with each iteration of a noise burst in a rapidly modulated noise burst train (Fig. 11A). The average maximum vector strength for standard-housing condition rats was 0.52 ± 0.02 and for enriched rats was 0.69 ± 0.02 (P < 0.001). As a population, standard-housing rat PAF neurons had their highest vector strength at 5.12 Hz, while enrichment increased this measure to 7.6 Hz. The Rayleigh statistic, a measure of the statistical significance of vector strength (Fig. 11B), was higher for the enriched group (average maximum Rayleigh statistic: standard rats 128 ± 16.9, enriched rats 182.9 ± 17.9; P = 0.02). Our results suggest that temporal properties of PAF neurons are more responsive than A1 to changes induced by environmental enrichment.
Fig. 11.
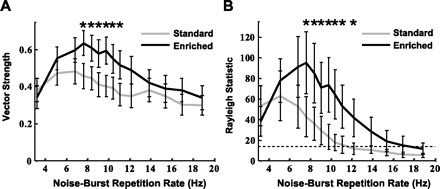
Measurement of synchronization between repeated noise burst onset and action potentials. A: vector strength is an indicator of the precision with which neurons lock their firing of action potentials to the same time of the stimulus period. A value of 1 would indicate perfect time-locking, i.e., all action potentials fire at the same time relative to the noise burst onset. B: the Rayleigh statistic combines the degree of synchronization with the number of action potentials to assess the statistical significance of vector strength. A value > 13.8 indicates P < 0.001, indicated by the dotted horizontal line. Environmental enrichment enhanced time-locking of PAF neurons for rapidly successive noise bursts. Significant differences between the groups: *P < 0.05 by Mann-Whitney test. Error bars indicate SE.
Enrichment Preserves Total Number of Evoked Action Potentials
The present study demonstrates that enrichment induces PAF neurons to fire for a significantly shorter duration. In light of this brevity of response, we expected that a narrower time window for firing might result in fewer action potentials in response to a sound. Contrary to our prediction, in response to tones enriched PAF neurons had a similar number of evoked spikes measured by multiunit recordings as control neurons (for tones above neural threshold: standard = 1.65 ± 0.2 spikes/tone, enriched =1.56 ± 0.16 spikes/tone; P = 0.35). Since the most posterior or most ventral rodent PAF neurons do not respond to tones but respond preferentially to noise bursts (Doron et al. 2002), we probed multiunit PAF neuronal response strength to single broadband noise bursts, too, but did not find a difference between the two housing groups (standard = 1.77 ± 0.19 spikes/noise burst, enriched = 1.69 ± 0.14 spikes/noise burst; P = 0.28). A preservation of response strength in enriched PAF neurons despite a significantly narrower response window appeared to be due to a stronger peak in multiunit instantaneous firing rate during the first 50 ms after onset of the sound (Fig. 12A) (peak instantaneous firing rate in the first 50 ms: standard 24.80 ± 3.79 spikes/s, enriched 37.97 ± 3.91 spikes/s; P = 0.03). It should be noted in Fig. 12A that the enriched group had an early strong peak in instantaneous firing rate, but the total number of spikes (i.e., the area under the response curves) was the same in the two groups.
Fig. 12.
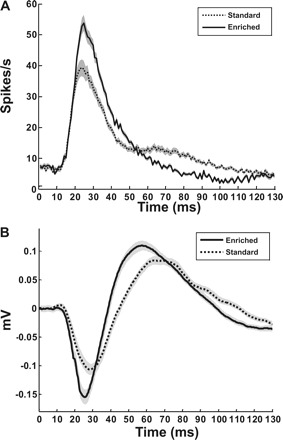
Environmental enrichment induces strong early activation of neurons in PAF. A: population mean multiunit response to tones (1-ms bins). B: population mean LFP response to a 75-dB tone at the CF of the recorded site. PAF responses from standard (dashed)- and enriched (black)-housing rats demonstrate a strong early activation of neurons after environmental enrichment (standard = 156 sites, enriched = 127 sites). Gray areas indicate SE.
LFPs reflect summed dendritic activation, and after enrichment LFPs recorded from PAF had significantly stronger sinks (Fig. 12B) (N1 amplitude: standard = −0.24 ± 0.02 mV, enriched = −0.32 ± 0.02 mV; P < 0.001) and sources for a 75-dB tone at CF (P2 amplitude: standard = 0.19 ± 0.01 mV, enriched = 0.23 ± 0.01 mV; P = 0.02). A single 60-dB noise burst also elicited a stronger sink (N1 amplitude: standard = −0.1624 ± 0.01 mV, enriched = −0.1966 ± 0.01 mV; P = 0.04) and source magnitude (P2 amplitude: standard = 0.1028 ± 0.01 mV, enriched = 0.1275 ± 0.01 mV; P = 0.007) from enriched PAF neurons. Our results provide evidence that enrichment induces brief but strong early activation of PAF neurons.
We examined cortical responses to acoustic stimuli present in the enriched environment. In the enriched environment, 2.1-kHz and 4-kHz tones were evoked by rats stepping on ramps leading to the water and food source. A 3-kHz tone was evoked with each rotation of the exercise wheel. We observed no tone-specific change in multiunit firing rate after enrichment [spikes/tone for 2.1-kHz tone: standard = 0.13 ± 0.03, enriched = 0.08 ± 0.04 (P = 0.66); for 3-kHz tone: standard = 0.12 ± 0.03, enriched = 0.09 ± 0.05 (P = 0.59); for 4-kHz tone: standard = 0.12 ± 0.03, enriched = 0.09 ± 0.04 (P = 0.34)]. The proportion of PAF area responding to any of 2.1-, 3-, or 4-kHz tones (i.e., the proportion of PAF area with neurons having 2.1, 3, or 4 kHz within their bandwidths) was equal for the standard and enrichment groups (% PAF area: standard = 45.07 ± 6.2, enriched = 40.54 ± 9.55; P = 0.65). There was no frequency-specific reorganization in PAF for the tones present in the enriched environment. Our findings in PAF are similar to those observed in A1 after enrichment, where no overrepresentation of any frequency was found after enrichment (Engineer et al. 2004). A previous study in A1 indicated that increasing the saliency of multiple tone frequencies by pairing them with nucleus basalis stimulation induced a reorganization to all probed tone frequencies—including tones not paired with nucleus basalis stimulation (Kilgard et al. 2001). We speculate that multiple relevant sounds in the enriched environment induce a similar global reorganization in PAF neurons across all tonal frequencies.
We analyzed spike-spike coincidences in spike trains recorded from microelectrode pairs. For microelectrode pairs 250–400 μm apart and recording multiunit activity simultaneously in PAF, we observed no change in the cross-correlation height for spontaneous activity (average peak correlation coefficient: standard = 0.083 ± 0.011, enriched = 0.079 ± 0.017; P = 0.9) or for activity driven by a noise burst (average peak correlation coefficient: control = 0.083 ± 0.019, enriched = 0.095 ± 0.035; P = 0.9).
Single-Unit Responses
Reorganization in single neuron responses to tones (standard = 10 single units, enriched = 15 single units) mirrored changes detected by multiunit and LFP recordings. Single neurons in PAF of enriched rats had significantly narrower receptive fields compared with control rats for 10 dB above threshold (standard = 1.67 ± 0.25 octaves, enriched = 0.62 ± 0.08 octaves; P < 0.001), 20 dB above threshold (standard = 2.09 ± 0.32 octaves, enriched = 1.09 ± 0.15 octaves; P = 0.003,), and 30 dB above threshold (standard = 2.74 ± 0.37 octaves, enriched = 1.49 ± 0.27 octaves; P = 0.009). Time to peak response for single units after tone onset (for 50 dB and louder tones) was significantly shorter for enriched neurons (standard = 48.38 ± 10.78 ms, enriched 31.13 ± 2.26 ms; P = 0.015). Similar to findings in multiunit recordings, the total evoked action potentials (standard 0.28 ± 0.05 spikes/tone, enriched 0.22 ± 0.04 spikes/tone; P = 0.41) in response to a tone were not different between the two experimental groups.
Collectively, these results indicate that PAF is very plastic and an enriched auditory experience can induce strong reorganization in receptive fields and temporal response properties. Given above are the physiological consequences of this reorganization when probed with pure tones and broadband noise bursts.
A PAF neuron can respond to multiple noncontinuous frequencies (Loftus and Sutter 2001). Differing frequencies induce responses with different onset times in the same neuron. This rich temporal variety of responses to various spectral inputs suggests that PAF may have a role in processing complex spectro-temporal stimuli (Loftus and Sutter 2001). Our results so far demonstrate that enriched PAF neurons have quick, strong, time-locked responses to the onset of tones and noise bursts. This led us to predict that enrichment would increase PAF's response to a temporal cue in a complex spectro-temporal stimulus.
To examine PAF's response to a temporal cue in a complex sound, we probed literature for well-investigated complex spectro-temporal sounds whose temporal information and the brain's response to it had been well studied, especially in the context of disease models and brain reorganization. The brain's temporal response properties to speech sounds with voice onset time differences has been extensively studied (Aizawa and Eggermont 2006; Buonomano and Merzenich 1995; Eggermont 1995; Papanicolaou et al. 2003; Steinschneider et al. 1994, 1995, 1999, 2005; Tremblay et al. 2001). The brain's temporal response to delayed voicing shows deficits in disease models (Aizawa and Eggermont 2006; Floody et al. 2010; Tomita et al. 2004) and is capable of undergoing reorganization with training (Tremblay et al. 1998, 2001). Speech sound /tad/ is well established as a complex sound with a distinct well-studied voice onset time as a temporal cue. We chose speech sound /tad/ to examine enriched PAF's response to a temporal cue in a complex sound.
Enrichment Enhances PAF Response to a Temporal Cue in Novel Speech Sound /tad/
A1 encodes speechlike sounds in the precise timing of generated action potentials (Engineer et al. 2008). Human speech sounds /tad/ and /dad/ have the same place of articulation yet elicit distinct temporal patterns of A1 activation. After initiation of the consonant sound in /tad/, an ∼70-ms delay in the onset of voicing—i.e., the onset of the vibration of vocal cords—results in two distinct onset-activation peaks in A1 (Steinschneider et al. 2003, 2005). For /dad/, a lack of delayed voicing results in a single onset-activation peak in A1.
Unlike A1, PAF responds best to temporal cues that change slowly over time. PAF neurons respond to spectro-temporally rich sounds with poorer temporal fidelity (Gourevitch and Eggermont 2007). In our study, recordings from control PAF neurons demonstrate that the onset of voicing in /tad/ elicits a weak response (Fig. 13, C and D). After enrichment, the onset of voicing evoked double the magnitude of response (Fig. 13, C and D) than that seen in control neurons (maximum firing rate within 85 ms of voicing onset: standard = 36.34 ± 3.05 spikes/s, enriched 62.36 ± 7.58 spikes/s; P = 0.006). An enhanced response to voicing in /tad/ was reflected in LFP recordings, too (max amplitude within 85 ms of voicing onset: standard = −0.1 ± 0.01 mV, enriched = −0.19 ± 0.01 mV; P < 0.001). Congruent with strong early activation of neurons to onset of tones and noise bursts, enrichment also significantly increased the amplitude of the LFP response to speech sound /tad/ (max amplitude within 100 ms of /tad/ onset: standard = −0.25 ± 0.01 mV, enriched = −0.31 ± 0.02 mV; P < 0.001). Sound /dad/ lacks delayed voicing, and PAF neurons from both standard and enriched environment groups responded with a single onset-activation peak to /dad/ (Fig. 14). Our findings indicate that an enriched auditory experience reorganizes PAF to respond more robustly to the temporal information in speech sound /tad/.
Fig. 14.
PAF neuronal response to speech sound /dad/. Time-amplitude representation of /dad/ in A and /dad/ speech spectrogram in B illustrate that for speech sound /dad/, after initiation of the consonant sound (open pentagon on time axis), there is no delay in the onset of voicing (onset of voicing indicated by open arrow on time axis and dotted line that runs through all panels). Mean population multiunit (C) and LFP (D) responses from PAF neurons (standard = 156 sites, enriched = 127 sites) indicate that PAF neurons from enriched- and standard-housed rats have similar single onset-activation peaks in the absence of delayed voicing. Gray areas indicate SE.
DISCUSSION
Summary of Findings
Our study demonstrates that PAF neurons have sharper receptive fields after environmental enrichment. Enriched PAF neurons also respond more quickly, with greater instantaneous firing rate, and for a briefer period to single sounds. Rapidly repeated sounds evoke a higher cortical following rate and a more time-locked response from enriched PAF neurons. Enrichment sensitizes PAF neurons to a temporal cue in /tad/, a complex spectro-temporal sound. Compared with cortical reorganization measured in an earlier enrichment study in A1, we find that PAF neurons undergo a greater degree of change after enrichment (comparison of response properties of A1 and PAF after environmental enrichment given in Table 1).
Table 1.
Summary of environmental enrichment-induced changes in A1 and PAF
| Parameter | A1 | PAF |
|---|---|---|
| Receptive field bandwidth | ||
| Bandwidth 10 dB above threshold | NS | 35%↓ |
| Bandwidth 20 dB above threshold | NS | 28%↓ |
| Bandwidth 30 dB above threshold | NS | 15%↓ |
| Bandwidth 40 dB above threshold | 7%↓ | NS |
| Latency | ||
| MUA onset latency, ms | NS | 42%↓ |
| MUA peak latency, ms | 5%↑ | 42%↓ |
| MUA end latency, ms | 5%↑ | 37%↓ |
| LFP N1 peak latency | NA | 18%↓ |
| Auditory evoked potential N1 peak latency | 30%↑ | NA |
| Response to rapidly repeated sounds | ||
| MUA best modulation rate | 16%↓ | 22%↑ |
| MUA maximum phase-locked rate | 16%↓ | 33%↑ |
| Firing strength | ||
| MUA tonal response strength, spikes/tone | 30%↑ | NS |
| MUA noise burst response strength, spikes/noise burst | 39%↑ | NS |
| LFP N1 peak amplitude to tone | NA | 25%↑ |
| Auditory evoked potential N1 peak amplitude to tone | 66%↑ | NA |
| MUA spontaneous firing rate, spikes/20 ms | 21%↑ | NS |
Values are means ± SE. Statistical significance was assessed with Student's t-tests. ↓ or ↑ indicates a decrease or increase in value. All % change observations for primary auditory cortex (A1) plotted in this table are determined from values published earlier (Engineer et al. 2004). PAF, posterior auditory field; MUA, multiunit activity; LFP, local field potential; NS, not statistically significant; NA, not applicable. LFPs in PAF were recorded from the same intracortical electrodes used to record MUA. Auditory evoked potentials in A1 from an earlier study (Engineer et al. 2004) were recorded in an awake rat from an epidural ball electrode placed over A1.
Mechanism of PAF Reorganization: Brain Regions Involved
PAF changes observed in our study could be explained by reorganization in at least five regions, as described below.
A1.
PAF neurons receive convergent inputs from multiple frequency regions of the A1 map (Lee and Winer 2008). Since A1 neurons exhibit increased evoked responses to tones and noise bursts after enrichment (Engineer et al. 2004), an additive effect of multiple strong simultaneous inputs from A1 to a PAF neuron could increase the likelihood that a PAF neuron quickly reaches threshold to fire an action potential. This could explain shorter PAF onset latencies and stronger instantaneous firing rates after enrichment.
Medial and dorsal division of medial geniculate body.
Along with receiving auditory input from the ventral region of the medial geniculate body (MGB) via A1, PAF receives direct auditory connections from medial and dorsal regions of the MGB as part of the nonclassical pathway (Read et al. 2002).The medial and dorsal regions of the MGB (but not the ventral division) are capable of undergoing long-term experience-dependent reorganization following tone shock conditioning (Edeline and Weinberger 1991, 1992). Enrichment-induced experiential reorganization in medial and dorsal MGB could be transmitted via direct connections to PAF. Environmental enrichment potentiates thalamocortical transmission (Mainardi et al. 2010), and if the relative contribution of short-latency thalamic inputs to PAF activation increased, PAF neuronal latencies would decrease after enrichment.
Higher cortical centers.
PAF receives direct projections from higher cortical stations like the multisensory “parabelt” region posterior ectosylvian gyrus (Lee and Winer 2008). There is evidence that attentional modulation can induce strong changes in nonprimary auditory cortex. For example, in humans involved in a short-term tone attention task during fMRI imaging, nonprimary auditory cortex was more susceptible to change than A1 (Petkov et al. 2004). While higher cortical centers do undergo reorganization after enrichment (Del Arco et al. 2007; Gelfo et al. 2009; Kolb and Gibb 1991), it remains to be seen whether this is a consequence or a cause of reorganization in lower hierarchical centers. Chronic evoked potential recordings from electrodes over auditory and frontal cortex and the temporal development of enrichment-induced reorganization in both regions could offer some insight into this issue.
Nonauditory sensory cortex.
Nonauditory stimuli, like somatosensory and visual input, influence activity in nonprimary auditory cortex (Bizley and King 2008; Bizley et al. 2007; Brosch et al. 2005; Kayser et al. 2005, 2008). Environmental enrichment induces cortical reorganization in somatosensory and visual cortices (Beaulieu and Cynader 1990a, 1990b; Coq and Xerri 1998). It is conceivable that enrichment-induced reorganization in nonauditory cortex can influence neuronal properties in PAF. A potential experiment to explore the influence of nonauditory enrichment on PAF could be to record PAF's responses after enrichment, after silencing activity in the somatosensory and visual cortices by local infusion of GABA-A agonist muscimol or by using a cooling coil (King et al. 2007; Malhotra et al. 2004).
Local changes in PAF.
Local PAF neuronal reorganization is supported by three observations. 1) LFP findings mirror those seen in multiunit and single-unit data. LFP reflects dendritic activation, which suggests that in PAF after enrichment either the input into PAF is stronger or local cortical cell dendrites are more sensitive to incoming input. While the possibility of an enhancement of input into PAF has been discussed above, there is evidence, too, supporting the presence of a substrate for increased dendritic excitation. An increase in glutamate receptors, spine number, dendritic number, and arborization has been demonstrated in all examined cortical regions, including higher cortical centers involved in processing enriched sensory input (Gelfo et al. 2009; Katz and Davies 1984; Restivo et al. 2005). 2) Reports suggest that enrichment decreases inhibition in cortex (Baroncelli et al. 2009). The number of inhibitory synapses decreases (Beaulieu and Cynader 1990b) and basal levels of GABA decrease in cortex after enrichment (Sale et al. 2007). This could contribute to greater cortical excitability and, hence, decreased onset latencies and increased instantaneous firing rate in PAF. 3) In our study, enrichment induced quick curtailing of responses, suggesting an increase in local stimulus-evoked inhibition. In addition, PAF bandwidths narrow to a greater extent than can be explained by direct transmission of bandwidth changes in A1, suggesting increased local stimulus-evoked surround inhibition in PAF after enrichment. The fact that basal GABA levels decrease (Sale et al. 2007) but there is no decrease in evoked GABA release in primary sensory cortex (Nichols et al. 2007) suggests that enrichment could affect basal and evoked GABA levels differently in the cortex. We propose that while enrichment decreases basal levels of GABA, it increases local stimulus-evoked GABAergic inhibition of pyramidal cells in PAF. Whole cell patch-clamp studies observing evoked inhibitory currents in pyramidal cells in PAF after enrichment could be used to test this hypothesis.
Role of Enriched Acoustic Environment in Cortical Reorganization
Along with enriched auditory stimuli, environmental enrichment involves a larger cage, an exercise wheel, and more social contact with other rats. A previous study explored the contribution of a larger cage size, social factors, and motor activity in enrichment-induced auditory cortex reorganization (Percaccio et al. 2007). Rats housed in a large cage with three other rats for social interaction but no other enhancement in the acoustic environment did not have auditory cortex properties different from standard-caged rats. Rats housed in a cage with a running wheel but with no auditory cue associated with each revolution of the wheel did not have auditory cortex changes associated with environmental enrichment. For a rat in a single cage separate from but well within hearing range of the enriched cage, sounds heard from the enriched cage were enough to drive enrichment-induced reorganization (Percaccio et al. 2007). The Percaccio et al. (2007) study underscores the relevance of the acoustic stimuli in the enriched environment in driving cortical reorganization.
Task-Related and Environmental Enrichment-Induced Cortical Plasticity
It is currently not fully determined whether 1) each relevant sensory stimulus in the enriched environment induces reorganization in an instrumental or classical conditioning manner or 2) exposure to the enriched sounds away from an instrumental or a classical conditioning context would be sufficient to drive brain reorganization. Evidence for the latter is provided by a study in which rats separated from but within hearing range of the enriched cage underwent enrichment-induced reorganization (Percaccio et al. 2007).
Task-related cortical plasticity differs in some respects from reorganization induced by environmental enrichment. Training on tasks that require attention to spectral input typically induces cortical reorganization specific to the region of the cortex being activated (Fritz et al. 2003; Recanzone et al. 1993). Although our enriched environment included some behaviorally relevant tones, in the present study and in a previous environmental enrichment study (Engineer et al. 2004), we observed cortical reorganization across all tonal frequencies. Training on a task that required attention to the rapidness of temporal input induced A1 neurons to fire in a more time-locked manner to rapid sounds (Bao et al. 2004). In contrast, environmental enrichment induced A1 neurons to fire in a less time-locked manner to rapid sounds (Percaccio et al. 2005). However, both task-related training and environmental enrichment 1) induce immediate-early gene Arc activation (CarpenterHyland et al. 2010; Pinaud et al. 2001), 2) require BDNF for reorganization (Alonso et al. 2005; Sale et al. 2004), and 3) involve induction of the cAMP-CREB system (Cancedda et al. 2004; Rapanelli et al. 2010). The mechanisms inducing cortical reorganization in the two paradigms appear to be similar.
Reorganization in Primary vs. Nonprimary Sensory Cortex: Comparison with Previous Studies
Multiple studies have documented greater reorganization in nonprimary compared with primary sensory cortex. More neurons in secondary auditory cortex (AII) compared with A1 underwent tone-specific increases in response strength after fear conditioning (Diamond and Weinberger 1984). Pairing of tones with nucleus basalis stimulation increases frequency selectivity and response strength for the paired tone in PAF, but not in A1 (Puckett et al. 2007). Neurons that responded to a single tone paired with nucleus basalis stimulation had bandwidths (at 40 dB above threshold) 19% narrower than their controls. In our study, environmental enrichment narrowed bandwidths (at 40 dB above threshold) by 13%. Greater nonprimary cortex reorganization has been seen across sensory systems. Visual cortex area V4 undergoes greater orientation tuning reorganization than V1 (Raiguel et al. 2006).
Along with the above-mentioned reports, our study of enrichment's effect in PAF suggests that nonprimary sensory cortex is more plastic than primary cortex. However, instances of greater reorganization in primary sensory cortex also have been reported (Polley et al. 2006). It is likely that the scale and direction of experience-dependent changes in different cortical fields will depend on many sensory and cognitive factors (Hochstein and Ahissar 2002).
Difference Between Primary and Nonprimary Cortical Response After Environmental Enrichment
In our study, enrichment induces PAF neurons to fire with faster peak firing latencies and shorter response time. Interestingly, enrichment induces A1 neurons to respond with longer peak firing latencies and longer response durations (Engineer et al. 2004). With a decrease in the difference between A1 and PAF response times and response durations, an obvious concern is that primary and nonprimary cortical areas could respond as one homogeneous region after enrichment. However, after enrichment the mean population onset, peak, and end latencies in A1 are approximately 12, 19, and 36 ms, respectively (Engineer et al. 2004), and in the present study we observe that after enrichment the mean population onset, peak, and end latencies in PAF are approximately 24, 32, and 52 ms, respectively. As a population, PAF still responds at least 12 ms slower than A1 after enrichment. While enrichment decreases the difference between A1 and PAF response times, A1 and PAF still respond as distinct auditory fields in their response times. Besides, after enrichment there is an increase in response in A1 for rapid sensory inputs presented at 2–10 Hz and an increase in response in PAF for inputs >8 Hz. The difference in enrichment-induced response to repeated inputs is further proof that A1 and PAF respond not as one homogeneous area after enrichment, but as two distinct auditory fields.
After enrichment, PAF neurons fired for a shorter duration in our study. For a PAF tuning curve, neuronal responses to tones at CF have the shortest onset latency (Loftus and Sutter 2001). Tones further away from CF elicit slower onset latencies and contribute to the net sustained response of neurons seen in PAF. In our study, enrichment induced significant narrowing of tuning curve widths. We propose that such narrowing of bandwidths eliminates responses to tones further away from CF that would otherwise have contributed to a sustained neuronal response. The functional consequences of a 35% shorter response duration in PAF are unknown. Behavioral studies indicate that PAF plays a role in sound localization (Lomber and Malhotra 2008; Malhotra et al. 2004). The onset latency for a PAF neuron varies with the location of the sound source (Stecker et al. 2003). It has been proposed that a prolonged response duration in PAF could allow integration of sensory inputs entering PAF with different latencies. Interestingly, in the study of Stecker et al. (2003), the variation in onset latency with sound location for PAF recordings had a mean of 12 ms and rarely varied more than 25 ms—well within the response duration seen in our study for PAF neurons after enrichment. While it appears that a 35% reduced response duration in PAF after enrichment might still allow enough time to integrate inputs from different locations, definite proof of this conjecture will require behavioral experiments in enriched animals.
Technical Considerations
We used pentobarbital sodium as anesthesia while recording from the auditory cortex. Barbiturate anesthesia increases latency times of cortical neurons (Gaese and Ostwald 2001) by binding to inhibitory GABAA receptors. An increase in cortical inhibition by barbiturates could hypothetically be responsible for delayed A1 response times after enrichment, which would decrease the difference between A1 and PAF response times. However, 1) enrichment decreases inhibitory transmission in the cortex (Mainardi et al. 2010; Sale et al. 2007) (the influence of barbiturate anesthesia should be less pronounced in enriched animals) and 2) if barbiturates were responsible for slowing down A1 response times after enrichment, PAF response times also should have slowed down. However, in the present study PAF response times got significantly faster after enrichment. This indicates that the changes seen can be attributed to environmental enrichment and not barbiturate anesthesia. Our study could detect evidence of strong underlying network reorganization as depicted earlier in multiple anatomical studies. This suggests concrete cortical reorganization that is expressed even in the absence of higher cortical input lost in anesthesia. Our earlier studies in A1 indicate that enrichment-induced changes are similar in awake and anesthetized rats.
Awake recordings reflecting nonprimary auditory cortex reorganization after environmental enrichment have been conducted previously, and the findings support the present study. In the study of Engineer et al. 2004 (Fig. 6 and Discussion), in awake epidural recordings it was observed that enrichment-induced increase in amplitude of evoked potential N1b peak was greater than that in the N1a peak. The N1a peak has a latency (20–25 ms) that corresponds to the peak latency of A1 neurons measured by microelectrodes (Rutkowski et al. 2003) and has its source in rodent A1 (Ohl et al. 2000). The latency of the N1b peak (∼45 ms) corresponds to peak activity in a nonprimary auditory field, most likely PAF. For the four nonprimary auditory fields described in the Sprague-Dawley rat (Polley et al. 2007)—anterior auditory field (AAF), ventral auditory field (VAF), suprarhinal auditory field (SRAF), and PAF—the peak latencies are AAF ∼18 ms, VAF ∼30 ms, SRAF ∼30 ms, and PAF ∼50 ms (Pandya et al. 2008; Polley et al. 2007; Rutkowski et al. 2003). Peak neural activity in PAF neurons best corresponds to peak N1b of the awake rat epidural evoked potential. In awake rats, peak N1b increases to a greater extent after enrichment than the peak corresponding to A1, indicating that a nonprimary cortical region, most likely PAF, undergoes greater reorganization than A1 after environmental enrichment, and this supports the present study's hypothesis.
Compared with epidural recordings, multiunit recordings from PAF of awake rats could potentially offer a better spatial resolution and confirmation of PAF reorganization after long-term (8 wk) environmental enrichment. However, the feasibility of chronic multiunit recordings from rat PAF is questionable. Sprague-Dawley rat auditory cortex surface is without gyri or landmark blood vessels that demarcate an auditory field. The topographic location of an auditory field is not fixed in relation to the bregma and can vary as much as 0.5 mm in any direction between rats (for reference, A1's area is ∼1.35 mm2) (Polley et al. 2007). Classification of an electrode site as being in PAF (and not in A1, AAF, VAF, or SRAF) would need to be confirmed physiologically with a wide and dense array of active electrodes still functional 8 wk after implantation. However, the quality of awake multiunit recordings deteriorates after implantation with the onset of local inflammation (Polikov et al. 2005). While use of collagenase-coated electrodes and the anti-inflammatory agent minocycline helps decrease deterioration of electrode activity over time and offers recordings from a subset of 8–14 implanted electrodes for 4 wk (Paralikar and Clement 2008; Rennaker et al. 2007), there is currently no record of a technique that offers the possibility of 8 wk of dense, active intracortical recordings from a Sprague-Dawley rat after 8 wk in an enriched environment. One way to address this issue would be to implant electrode arrays before and after environmental enrichment in matched animals. However, if this was done, one would need to take the following factors into account. 1) This would involve an unpaired analysis. Given the reduced number of recording sites in awake recordings (∼8–14 sites distributed over at least A1 and PAF), for the same effect size, standard deviation, and sampled site number seen in our anesthetized recordings, the study would require a large number of animals (∼40–70 total for both groups) to confirm our finding. 2) Cortical effects of enrichment fade rapidly in a nonenriched environment (Engineer et al. 2005), and time spent by the animals recovering from electrode implantation surgery could attenuate cortical reorganization that occurred prior to surgery. Future development of intracortical electrodes that are viable for months will help examine reorganization of multiunit activity after long-term enrichment in awake rats.
Sensory cortex researchers design environmental enrichment cages with a strategy to maximize the variety of textures, object shapes, and visual cues experienced by the rodents. This includes insertion of artificial objects like plastic pipes and symmetrical wooden blocks (Baroncelli et al. 2009; Ortuzar et al. 2011). A similar strategy of having a wide variety of acoustic stimuli was employed in the construction of our enrichment cage, including acoustically rich but artificial sounds like classical music. Artificial stimuli in the enrichment cage increase the richness of sensory stimuli and likely contribute to brain reorganization that might not be seen in a more naturalistic environment. The location of the speaker for sounds from the CD player was different from that for behaviorally driven sounds like ramp- and running wheel-activated tones. A rat in the enrichment cage would be exposed to multiple behaviorally driven sounds as well as a unique source for nondriven but unpredictable and spectrally and temporally rich sounds. PAF plays an important role in sound localization (Lomber and Malhotra 2008; Malhotra et al. 2004). The presence of a unique location for the different driven and nondriven sounds in the enriched environment could have contributed to engaging PAF more in the enriched environment compared with the standard cage environment. PAF recordings from an animal trained to localize sound in an instrumental conditioning experiment will help determine the contribution of sound localization in driving PAF reorganization in enriched animals.
Individual rats likely know their own locations without relying on the sounds triggered at different locations. The sounds are behaviorally relevant to the rats because they inform them about the location of other rats, which has high social value. The presence of multiple and spectrally varied relevant sounds likely contributes to a global increase in response to all tones, without overrepresentation of any single tone in the environment.
Our initial evaluation of reorganization of PAF responses to complex sounds is limited to investigating the response to the presence or lack of a temporal cue in sounds /tad/ and /dad/, respectively. Further experiments investigating responses to other voiced and unvoiced consonant-vowel sounds and parametrically varying voice-onset delays of modeled artificial sounds could yield greater insights into the operative mechanisms involved. Additional studies to systematically test a wide range of complex sounds should provide a more comprehensive view of reorganization of responses in higher auditory fields to complex sounds.
This study was not designed to make direct comparisons between A1 and PAF neurons in the same animals. Although such a design would be ideal, we believe comparison with our earlier studies of enrichment effects in A1 is justified. The housing conditions in this study were identical to those in the earlier study. The time course of enrichment and neurophysiology and analysis methods were also the same. The few A1 recordings we obtained while delineating PAF's anterior border suggest that the A1 changes in the rats used in this study were comparable to the changes in previous reports.
Conclusion
Fear conditioning, operant conditioning, and nucleus basalis stimulation protocols suggest that nonprimary cortex is more plastic than primary cortex. Our results in PAF support our hypothesis that nonprimary cortical regions can more robustly undergo long-lasting experience-dependent changes compared with primary cortex.
GRANTS
This work was supported by a grant from the James S. McDonnell Foundation and NIDCD (5R01DC010433).
DISCLOSURES
No conflicts of interest, financial or otherwise, are declared by the author(s).
AUTHOR CONTRIBUTIONS
Author contributions: V.J. and K.Q.C. performed experiments; V.J. and M.P.K. analyzed data; V.J. and M.P.K. interpreted results of experiments; V.J. prepared figures; V.J. drafted manuscript; V.J., K.Q.C., and M.P.K. edited and revised manuscript; V.J., K.Q.C., and M.P.K. approved final version of manuscript; M.P.K. conception and design of research.
ACKNOWLEDGMENTS
We thank Pritesh Pandya and Cherri Whang for pilot data. We thank Roshini Jain for initial acute surgeries and Claudia Perez and Helen Chen for assistance with recordings. We thank Josanne Howard for assistance with maintaining the enriched environment. We are grateful to Amanda Puckett and Benjamin Porter for intellectual input helpful in editing the manuscript and to Amanda Puckett, Navzer Engineer, and Crystal Engineer for input in analyzing data.
REFERENCES
- Aizawa N, Eggermont JJ. Effects of noise-induced hearing loss at young age on voice onset time and gap-in-noise representations in adult cat primary auditory cortex. J Assoc Res Otolaryngol 7: 71–81, 2006 [DOI] [PMC free article] [PubMed] [Google Scholar]
- Alonso M, Bekinschtein P, Cammarota M, Vianna MRM, Izquierdo I, Medina JH. Endogenous BDNF is required for long-term memory formation in the rat parietal cortex. Learn Mem 12: 504–510, 2005 [DOI] [PMC free article] [PubMed] [Google Scholar]
- Bao S, Chang E, Woods J, Merzenich M. Temporal plasticity in the primary auditory cortex induced by operant perceptual learning. Nat Neurosci 7: 974–981, 2004 [DOI] [PubMed] [Google Scholar]
- Baroncelli L, Braschi C, Spolidoro M, Begenisic T, Sale A, Maffei L. Nurturing brain plasticity: impact of environmental enrichment. Cell Death Differ 17: 1092–1103, 2009 [DOI] [PubMed] [Google Scholar]
- Beaulieu C, Cynader M. Effect of the richness of the environment on neurons in cat visual cortex. I. Receptive field properties. Dev Brain Res 53: 71–81, 1990a [DOI] [PubMed] [Google Scholar]
- Beaulieu C, Cynader M. Effect of the richness of the environment on neurons in cat visual cortex. II. Spatial and temporal frequency characteristics. Dev Brain Res 53: 82–88, 1990b [DOI] [PubMed] [Google Scholar]
- Bizley JK, King AJ. Visual-auditory spatial processing in auditory cortical neurons. Brain Res 1242: 24–36, 2008 [DOI] [PMC free article] [PubMed] [Google Scholar]
- Bizley JK, Nodal FR, Bajo VM, Nelken I, King AJ. Physiological and anatomical evidence for multisensory interactions in auditory cortex. Cereb Cortex 17: 2172–2189, 2007 [DOI] [PMC free article] [PubMed] [Google Scholar]
- Bose M, Muñoz-Llancao P, Roychowdhury S, Nichols J, Jakkamsetti V, Porter B, Byrapureddy R, Salgado H, Kilgard M, Aboitiz F. Effect of the environment on the dendritic morphology of the rat auditory cortex. Synapse 64: 97–110, 2010 [DOI] [PMC free article] [PubMed] [Google Scholar]
- Brosch M, Selezneva E, Scheich H. Nonauditory events of a behavioral procedure activate auditory cortex of highly trained monkeys. J Neurosci 25: 6797–6806, 2005 [DOI] [PMC free article] [PubMed] [Google Scholar]
- Buonomano DV, Merzenich MM. Temporal information transformed into a spatial code by a neural network with realistic properties. Science 267: 1028–1030, 1995 [DOI] [PubMed] [Google Scholar]
- Cai R, Guo F, Zhang J, Xu J, Cui Y, Sun X. Environmental enrichment improves behavioral performance and auditory spatial representation of primary auditory cortical neurons in rat. Neurobiol Learn Mem 91: 366–376, 2009 [DOI] [PubMed] [Google Scholar]
- Cancedda L, Putignano E, Sale A, Viegi A, Berardi N, Maffei L. Acceleration of visual system development by environmental enrichment. J Neurosci 24: 4840–4848, 2004 [DOI] [PMC free article] [PubMed] [Google Scholar]
- Carpenter-Hyland EP, Plummer TK, Vazdarjanova A, Blake DT. Arc expression and neuroplasticity in primary auditory cortex during initial learning are inversely related to neural activity. Proc Natl Acad Sci USA 107: 14828–14832, 2010 [DOI] [PMC free article] [PubMed] [Google Scholar]
- Coq J, Xerri C. Environmental enrichment alters organizational features of the forepaw representation in the primary somatosensory cortex of adult rats. Exp Brain Res 121: 191–204, 1998 [DOI] [PubMed] [Google Scholar]
- Del Arco A, Segovia G, Garrido P, de Blas M, Mora F. Stress, prefrontal cortex and environmental enrichment: studies on dopamine and acetylcholine release and working memory performance in rats. Behav Brain Res 176: 267–273, 2007 [DOI] [PubMed] [Google Scholar]
- Diamond D, Weinberger N. Physiological plasticity of single neurons in auditory cortex of the cat during acquisition of the pupillary conditioned response. II. Secondary field (AII). Behav Neurosci 98: 189–210, 1984 [PubMed] [Google Scholar]
- Diamond M, Law F, Rhodes H, Lindner B, Rosenzweig M, Krech D, Bennett E. Increases in cortical depth and glia numbers in rats subjected to enriched environment. J Comp Neurol 128: 117–125, 1966 [DOI] [PubMed] [Google Scholar]
- Doron N, Ledoux J, Semple M. Redefining the tonotopic core of rat auditory cortex: physiological evidence for a posterior field. J Comp Neurol 453: 345–360, 2002 [DOI] [PubMed] [Google Scholar]
- Edeline J, Weinberger N. Associative retuning in the thalamic source of input to the amygdala and auditory cortex: receptive field plasticity in the medial division of the medial geniculate body. Behav Neurosci 106: 81–105, 1992 [DOI] [PubMed] [Google Scholar]
- Edeline J, Weinberger N. Thalamic short-term plasticity in the auditory system: associative returning of receptive fields in the ventral medial geniculate body. Behav Neurosci 105: 618–639, 1991 [DOI] [PubMed] [Google Scholar]
- Eggermont JJ. Representation of a voice onset time continuum in primary auditory cortex of the cat. J Acoust Soc Am 98: 911–920, 1995 [DOI] [PubMed] [Google Scholar]
- Engineer C, Perez C, Chen Y, Carraway R, Reed A, Shetake J, Jakkamsetti V, Chang K, Kilgard M. Cortical activity patterns predict speech discrimination ability. Nat Neurosci 11: 603–608, 2008 [DOI] [PMC free article] [PubMed] [Google Scholar]
- Engineer N, Percaccio C, Pandya P, Moucha R, Rathbun D, Kilgard M. Environmental enrichment improves response strength, threshold, selectivity, and latency of auditory cortex neurons. J Neurophysiol 92: 73–82, 2004 [DOI] [PubMed] [Google Scholar]
- Fitch RH, Brown CP, O'Connor K, Tallal P. Functional lateralization for auditory temporal processing in male and female rats. Behav Neurosci 107: 844–850, 1993 [DOI] [PubMed] [Google Scholar]
- Floody OR, Ouda L, Porter BA, Kilgard MP. Effects of damage to auditory cortex on the discrimination of speech sounds by rats. Physiol Behav 101: 260–268, 2010 [DOI] [PMC free article] [PubMed] [Google Scholar]
- Fritz J, Shamma S, Elhilali M, Klein D. Rapid task-related plasticity of spectrotemporal receptive fields in primary auditory cortex. Nat Neurosci 6: 1216–1223, 2003 [DOI] [PubMed] [Google Scholar]
- Gaese B, Ostwald J. Anesthesia changes frequency tuning of neurons in the rat primary auditory cortex. J Neurophysiol 86: 1062–1066, 2001 [DOI] [PubMed] [Google Scholar]
- Gelfo F, De Bartolo P, Giovine A, Petrosini L, Leggio M. Layer and regional effects of environmental enrichment on the pyramidal neuron morphology of the rat. Neurobiol Learn Mem 91: 353–365, 2009 [DOI] [PubMed] [Google Scholar]
- Globus A, Rosenzweig M, Bennett E, Diamond M. Effects of differential experience on dendritic spine counts in rat cerebral cortex. J Comp Physiol Psychol 82: 175–181, 1973 [DOI] [PubMed] [Google Scholar]
- Goldberg J, Brown P. Response of binaural neurons of dog superior olivary complex to dichotic tonal stimuli: some physiological mechanisms of sound localization. J Neurophysiol 32: 613–636, 1969 [DOI] [PubMed] [Google Scholar]
- Gourevitch B, Eggermont J. Spatial representation of neural responses to natural and altered conspecific vocalizations in cat auditory cortex. J Neurophysiol 97: 144–158, 2007 [DOI] [PubMed] [Google Scholar]
- Greenough W, Volkmar F, Juraska J. Effects of rearing complexity on dendritic branching in frontolateral and temporal cortex of the rat. Exp Neurol 41: 371–378, 1973 [DOI] [PubMed] [Google Scholar]
- Heil P, Irvine D. Functional specialization in auditory cortex: responses to frequency-modulated stimuli in the cat's posterior auditory field. J Neurophysiol 79: 3041–3059, 1998 [DOI] [PubMed] [Google Scholar]
- Hochstein S, Ahissar M. View from the top: hierarchies and reverse hierarchies in the visual system. Neuron 36: 791–804, 2002 [DOI] [PubMed] [Google Scholar]
- Katz H, Davies C. Effects of differential environments on the cerebral anatomy of rats as a function of previous and subsequent housing conditions. Exp Neurol 83: 274–287, 1984 [DOI] [PubMed] [Google Scholar]
- Kaur S, Lazar R, Metherate R. Intracortical pathways determine breadth of subthreshold frequency receptive fields in primary auditory cortex. J Neurophysiol 91: 2551–2567, 2004 [DOI] [PubMed] [Google Scholar]
- Kayser C, Petkov CI, Augath M, Logothetis NK. Integration of touch and sound in auditory cortex. Neuron 48: 373–384, 2005 [DOI] [PubMed] [Google Scholar]
- Kayser C, Petkov CI, Logothetis NK. Visual modulation of neurons in auditory cortex. Cereb Cortex 18: 1560–1574, 2008 [DOI] [PubMed] [Google Scholar]
- Kilgard M, Merzenich M. Cortical map reorganization enabled by nucleus basalis activity. Science 279: 1714–1718, 1998 [DOI] [PubMed] [Google Scholar]
- Kilgard M, Merzenich M. Distributed representation of spectral and temporal information in rat primary auditory cortex. Hear Res 134: 16–28, 1999 [DOI] [PMC free article] [PubMed] [Google Scholar]
- Kilgard M, Vazquez J, Engineer N, Pandya P. Experience dependent plasticity alters cortical synchronization. Hear Res 229: 171–179, 2007 [DOI] [PMC free article] [PubMed] [Google Scholar]
- Kilgard MP, Pandya PK, Vazquez J, Gehi A, Schreiner CE, Merzenich MM. Sensory input directs spatial and temporal plasticity in primary auditory cortex. J Neurophysiol 86: 326–338, 2001 [DOI] [PubMed] [Google Scholar]
- King AJ, Bajo VM, Bizley JK, Campbell RAA, Nodal FR, Schulz AL, Schnupp JWH. Physiological and behavioral studies of spatial coding in the auditory cortex. Hear Res 229: 106–115, 2007 [DOI] [PMC free article] [PubMed] [Google Scholar]
- Kolb B, Gibb R. Environmental enrichment and cortical injury: behavioral and anatomical consequences of frontal cortex lesions. Cereb Cortex 1: 189–198, 1991 [DOI] [PubMed] [Google Scholar]
- Lee C, Winer J. Connections of cat auditory cortex. III. Corticocortical system. J Comp Neurol 507: 1920–1943, 2008 [DOI] [PMC free article] [PubMed] [Google Scholar]
- Liang L, Lu T, Wang X. Neural representations of sinusoidal amplitude and frequency modulations in the primary auditory cortex of awake primates. J Neurophysiol 87: 2237–2261, 2002 [DOI] [PubMed] [Google Scholar]
- Loftus W, Sutter M. Spectrotemporal organization of excitatory and inhibitory receptive fields of cat posterior auditory field neurons. J Neurophysiol 86: 475–491, 2001 [DOI] [PubMed] [Google Scholar]
- Lomber SG, Malhotra S. Double dissociation of “what” and “where” processing in auditory cortex. Nat Neurosci 11: 609–616, 2008 [DOI] [PubMed] [Google Scholar]
- Mainardi M, Landi S, Gianfranceschi L, Baldini S, De Pasquale R, Berardi N, Maffei L, Caleo M. Environmental enrichment potentiates thalamocortical transmission and plasticity in the adult rat visual cortex. J Neurosci Res 88: 3048–3059, 2010 [DOI] [PubMed] [Google Scholar]
- Malhotra S, Hall A, Lomber S. Cortical control of sound localization in the cat: unilateral cooling deactivation of 19 cerebral areas. J Neurophysiol 92: 1625–1643, 2004 [DOI] [PubMed] [Google Scholar]
- Mardia K, Jupp P. Directional Statistics. New York: Wiley, 2000 [Google Scholar]
- Mitzdorf U. Properties of the evoked potential generators: current source-density analysis of visually evoked potentials in the cat cortex. Int J Neurosci 33: 33–59, 1987 [DOI] [PubMed] [Google Scholar]
- Nichols J, Jakkamsetti V, Salgado H, Dinh L, Kilgard M, Atzori M. Environmental enrichment selectively increases glutamatergic responses in layer II/III of the auditory cortex of the rat. Neuroscience 145: 832–840, 2007 [DOI] [PMC free article] [PubMed] [Google Scholar]
- Ohl FW, Scheich H, Freeman WJ. Topographic analysis of epidural pure-tone-evoked potentials in gerbil auditory cortex. J Neurophysiol 83: 3123–3132, 2000 [DOI] [PubMed] [Google Scholar]
- Ortuzar N, Argandoña EG, Bengoetxea H, Lafuente JV. Combination of intracortically administered VEGF and environmental enrichment enhances brain protection in developing rats. J Neural Transm 118: 135–142, 2011 [DOI] [PubMed] [Google Scholar]
- Pandya P, Rathbun D, Moucha R, Engineer N, Kilgard M. Spectral and temporal processing in rat posterior auditory cortex. Cereb Cortex 18: 301–314, 2008 [DOI] [PMC free article] [PubMed] [Google Scholar]
- Papanicolaou AC, Castillo E, Breier JI, Davis RN, Simos PG, Diehl RL. Differential brain activation patterns during perception of voice and tone onset time series: a MEG study. Neuroimage 18: 448–459, 2003 [DOI] [PubMed] [Google Scholar]
- Paralikar KJ, Clement RS. Collagenase-aided intracortical microelectrode array insertion: effects on insertion force and recording performance. IEEE Trans Biomed Eng 55: 2258–2267, 2008 [DOI] [PubMed] [Google Scholar]
- Percaccio C, Engineer N, Pruette A, Pandya P, Moucha R, Rathbun D, Kilgard M. Environmental enrichment increases paired-pulse depression in rat auditory cortex. J Neurophysiol 94: 3590–3600, 2005 [DOI] [PubMed] [Google Scholar]
- Percaccio CR, Pruette AL, Mistry ST, Chen YH, Kilgard MP. Sensory experience determines enrichment-induced plasticity in rat auditory cortex. Brain Res 1174: 76–91, 2007 [DOI] [PubMed] [Google Scholar]
- Perkel DH, Gerstein GL, Moore GP. Neuronal spike trains and stochastic point processes. II. Simultaneous spike trains. Biophys J 7: 419–440, 1967 [DOI] [PMC free article] [PubMed] [Google Scholar]
- Petkov C, Kang X, Alho K, Bertrand O, Yund E, Woods D. Attentional modulation of human auditory cortex. Nat Neurosci 7: 658–663, 2004 [DOI] [PubMed] [Google Scholar]
- Phillips D, Semple M, Kitzes L. Factors shaping the tone level sensitivity of single neurons in posterior field of cat auditory cortex. J Neurophysiol 73: 674–686, 1995 [DOI] [PubMed] [Google Scholar]
- Pinaud R, Penner MR, Robertson HA, Currie RW. Upregulation of the immediate early gene arc in the brains of rats exposed to environmental enrichment: implications for molecular plasticity. Mol Brain Res 91: 50–56, 2001 [DOI] [PubMed] [Google Scholar]
- Polikov VS, Tresco PA, Reichert WM. Response of brain tissue to chronically implanted neural electrodes. J Neurosci Methods 148: 1–18, 2005 [DOI] [PubMed] [Google Scholar]
- Polley D, Steinberg E, Merzenich M. Perceptual learning directs auditory cortical map reorganization through top-down influences. J Neurosci 26: 4970–4982, 2006 [DOI] [PMC free article] [PubMed] [Google Scholar]
- Polley DB, Read HL, Storace DA, Merzenich MM. Multiparametric auditory receptive field organization across five cortical fields in the albino rat. J Neurophysiol 97: 3621–3638, 2007 [DOI] [PubMed] [Google Scholar]
- Puckett A, Pandya P, Moucha R, Dai W, Kilgard M. Plasticity in the rat posterior auditory field following nucleus basalis stimulation. J Neurophysiol 98: 253–265, 2007 [DOI] [PubMed] [Google Scholar]
- Raiguel S, Vogels R, Mysore S, Orban G. Learning to see the difference specifically alters the most informative V4 neurons. J Neurosci 26: 6589–6602, 2006 [DOI] [PMC free article] [PubMed] [Google Scholar]
- Rapanelli M, Lew S, Frick L, Zanutto B. Plasticity in the rat prefrontal cortex: linking gene expression and an operant learning with a computational theory. PLoS One 5: e8656, 2010 [DOI] [PMC free article] [PubMed] [Google Scholar]
- Read H, Winer J, Schreiner C. Functional architecture of auditory cortex. Curr Opin Neurobiol 12: 433–440, 2002 [DOI] [PubMed] [Google Scholar]
- Recanzone G, Schreiner C, Merzenich MM. Plasticity in the frequency representation of primary auditory cortex following discrimination training in adult owl monkeys. J Neurosci 13: 87–103, 1993 [DOI] [PMC free article] [PubMed] [Google Scholar]
- Rennaker R, Miller J, Tang H, Wilson D. Minocycline increases quality and longevity of chronic neural recordings. J Neural Eng 4: L1–L5, 2007 [DOI] [PMC free article] [PubMed] [Google Scholar]
- Restivo L, Ferrari F, Passino E, Sgobio C, Bock J, Oostra B, Bagni C, Ammassari-Teule M. Enriched environment promotes behavioral and morphological recovery in a mouse model for the fragile X syndrome. Proc Natl Acad Sci USA 102: 11557–11562, 2005 [DOI] [PMC free article] [PubMed] [Google Scholar]
- Rutkowski RG, Miasnikov AA, Weinberger NM. Characterisation of multiple physiological fields within the anatomical core of rat auditory cortex. Hear Res 181: 116–130, 2003 [DOI] [PubMed] [Google Scholar]
- Sale A, Putignano E, Cancedda L, Landi S, Cirulli F, Berardi N, Maffei L. Enriched environment and acceleration of visual system development. Neuropharmacology 47: 649–660, 2004 [DOI] [PubMed] [Google Scholar]
- Sale A, Vetencourt J, Medini P, Cenni M, Baroncelli L, De Pasquale R, Maffei L. Environmental enrichment in adulthood promotes amblyopia recovery through a reduction of intracortical inhibition. Nat Neurosci 10: 679–681, 2007 [DOI] [PubMed] [Google Scholar]
- Sirevaag A, Greenough W. Differential rearing effects on rat visual cortex synapses. III. Neuronal and glial nuclei, boutons, dendrites, and capillaries. Brain Res 424: 320–332, 1987 [DOI] [PubMed] [Google Scholar]
- Stecker GC, Mickey BJ, Macpherson EA, Middlebrooks JC. Spatial sensitivity in field PAF of cat auditory cortex. J Neurophysiol 89: 2889–2903, 2003 [DOI] [PubMed] [Google Scholar]
- Steinschneider M, Fishman Y, Arezzo J. Representation of the voice onset time (VOT) speech parameter in population responses within primary auditory cortex of the awake monkey. J Acoust Soc Am 114: 307–321, 2003 [DOI] [PubMed] [Google Scholar]
- Steinschneider M, Schroeder CE, Arezzo JC, Vaughan HG. Physiologic correlates of the voice onset time boundary in primary auditory cortex (A1) of the awake monkey: temporal response patterns. Brain Lang 48: 326–340, 1995 [DOI] [PubMed] [Google Scholar]
- Steinschneider M, Schroeder CE, Arezzo JC, Vaughan HG., Jr Speech-evoked activity in primary auditory cortex: effects of voice onset time. Electroencephalogr Clin Neurophysiol 92: 30–43, 1994 [DOI] [PubMed] [Google Scholar]
- Steinschneider M, Volkov I, Fishman Y, Oya H, Arezzo J, Howard M., III Intracortical responses in human and monkey primary auditory cortex support a temporal processing mechanism for encoding of the voice onset time phonetic parameter. Cereb Cortex 15: 170–186, 2005 [DOI] [PubMed] [Google Scholar]
- Steinschneider M, Volkov IO, Noh MD, Garell PC, Howard MA. Temporal encoding of the voice onset time phonetic parameter by field potentials recorded directly from human auditory cortex. J Neurophysiol 82: 2346–2357, 1999 [DOI] [PubMed] [Google Scholar]
- Tian B, Rauschecker J. Processing of frequency-modulated sounds in the cat's posterior auditory field. J Neurophysiol 79: 2629–2642, 1998 [DOI] [PubMed] [Google Scholar]
- Tomita M, Noreña AJ, Eggermont JJ. Effects of an acute acoustic trauma on the representation of a voice onset time continuum in cat primary auditory cortex. Hear Res 193: 39–50, 2004 [DOI] [PubMed] [Google Scholar]
- Tremblay K, Kraus N, McGee T. The time course of auditory perceptual learning: neurophysiological changes during speech-sound training. Neuroreport 9: 3556–3560, 1998 [DOI] [PubMed] [Google Scholar]
- Tremblay K, Kraus N, McGee T, Ponton C. Central auditory plasticity: changes in the N1-P2 complex after speech-sound training. Ear Hear 22: 79–90, 2001 [DOI] [PubMed] [Google Scholar]
- Volkmar F, Greenough W. Rearing complexity affects branching of dendrites in the visual cortex of the rat. Science 176: 1445–1447, 1972 [DOI] [PubMed] [Google Scholar]