

Abstract
Aminoacyl-tRNA synthetases are enzymes that charge specific tRNAs with their cognate amino acids and play an essential role in the initial steps of protein synthesis. Because these enzymes are attractive targets for drug development in many microorganisms, there is a pressing need for assays suitable for compound screening. We developed 1) a high throughput assay for measuring aminoacyl-tRNA synthetase activity and 2) an accompanying method for preparing the tRNA substrate. The assay can be performed in 96-well plates and relies on malachite green detection of pyrophosphate (Pi) as an indicator of aminoacyl-tRNA synthetase activity. Analysis of Trypanosoma brucei isoleucyl-tRNA synthetase (IleRS) activity showed that the assay exhibits sensitivity to picomoles of product, and yielded a Z′-factor of 0.56. We show that this assay is applicable to other aminoacyl-tRNA synthetases and to enzyme inhibition studies. Using this assay, we found that the compound NSC616354 inhibits recombinant IleRS with an IC50 of 0.6μM. Enzymology studies were also performed with rIleRS and its Km and kcat determined as 3.97 × 10⁻⁵ mol/L and 142 S−1, respectively. This assay will facilitate the screening of compounds to identify inhibitors of aminoacyl-tRNA synthetases.
Keywords: aminoacyl-tRNA synthetase, high throughput assay, malachite green, tRNA, aminoacylation
Introduction
Amino acids are ligated to their cognate tRNAs by aminoacyl-tRNA synthetases, a group of at least 20 enzymes whose members contribute to protein synthesis 1. Aminoacylation of tRNA is an essential step in translation, and its reaction occurs in two steps: first, the aminoacyl-tRNA synthetase hydrolyzes ATP to activate an amino acid with AMP, thereby forming an aminoacyl-adenylate intermediate and releasing pyrophosphate (E + ATP + AA + tRNA ↔ E:AA-AMP + tRNA + PPi); second, it esterifies the activated amino acid to the terminal ribose of the tRNA and releases adenosine-monophosphate (AMP) (E:AA-AMP + tRNA + PPi ↔ E + AA-tRNA + AMP + PPi). The final product of this reaction is aminoacylated tRNA (AA-tRNA), with AMP and PPi also released as reaction byproducts. Aminoacyl-tRNA synthetases are attractive targets for drug development since they have been shown to be essential for growth and survival of many pathogenic microorganisms. In Trypanosoma brucei, the parasite responsible for causing Human African Trypanosomiasis, aminoacyl-tRNA synthetases have been shown to be essential for parasite growth and survival 2. Similarly, aminoacyl-tRNA synthetases have been shown to be essential for other pathogens of global importance, including Plasmodium sp. 3, the parasite that causes malaria, and Mycobacterium tuberculosis4, which causes tuberculosis.
Despite the importance of aminoacyl-tRNA synthetases as potential drug development targets, few assays have been developed to date. The lack of appropriate assays has been a major factor hindering the identification of aminoacyl-tRNA synthetase inhibitors. Of the few assays that have been developed, most rely on the use of radiolabeled amino acids or tRNAs 5, 6. These assays are impractical for high throughput screening and are poor for quantitation. On the other hand, the spectrophotometric assays that have been developed require multiple coupled enzymes and generally exhibit high background and a low signal to noise ratio 7, 8. Recently, a compound screen using a luciferase chemiluminescence-based assay was reported for methionyl-tRNA synthetase, using E. coli bulk tRNAs, on the PubChem database; however, detailed information on assay quality and validation is not available 9. Alternatively, a luciferase assay has been reported using bacteria lysates 10. This method is convenient for high throughput screening, but it is limited to bacterial tRNA synthetases and cannot be used for enzymology studies. To overcome these limitations, we developed a 96-well plate spectrophotometric assay for quantitative measurement of in vitro aminoacyl-tRNA synthetase activity. In this assay, the inorganic pyrophosphatase enzyme was coupled to the aminoacylation reaction to convert the pyrophosphate into inorganic phosphate, which was quantitatively measured via malachite green. We also developed a detailed protocol for preparation of the tRNA substrate, which facilitates adaptation of the assay to any aminoacyl-tRNA synthetase.
Using this method, we showed that recombinant T. brucei isoleucyl-tRNA synthetase (rIleRS) aminoacylates its cognate tRNAIle more efficiently than either total T. brucei RNAs or yeast tRNAs. The assay is sensitive to picomoles of product and has a Z′ - factor of 0.56. Using this assay we identified the compound NSC616354 as an inhibitor of T. brucei IleRS, which shows its application for enzyme inhibition studies. Furthermore, kinetic assays were performed to determine enzymatic parameters (Km and kcat) of rIleRS, demonstrating its use for enzymology analysis. This assay can be easily used in a high throughput drug development context to identify inhibitors of aminoacyl-tRNA synthetases.
Material and methods
Cloning, expression and purification of recombinant protein
The DNA sequence of the gene Tb927.10.9190 (which codes for isoleucyl-tRNA synthetase) were amplified by PCR without the mitochondrial targeting sequence (nucleotides 1–198) using specific primers (9820-forward: CCCGAATTCATGACTGGACCACTACAA and 9821-reverse: CCCGCGGCCGCCGATTCACCAGCCGACGG) and cloned into pET28b+ vector (Novagen) using BamHI and NotI restriction sites with a C-terminal 6xHis-tags. For the gene Tb927.11.7170, which codes for seryl-tRNA synthetase, the PCR product was amplified using specific primers (8307-forward: CCCGGTCTCAAGCTTCATATGGTGCTTGATATACAGCTGTTTC and 8308-reverse: CCCGGTCTCCTCGAGCTCCCCCTTGTCGGGT) and cloned into pET29a+ using NdeI and XhoI restriction sites with a C-terminal 6xHis-tag. The constructs were used to transform E. coli Rosetta™ 2(DE3) pLysS strain (Novagen) and protein expression was induced with 1 mM IPTG. E. coli were grown in LB media, harvested and the lysate prepared with Bugbuster reagent (Novagen). Proteins were purified using nickel-magnetic beads (Millipore), dialyzed against 50 mM Tris, 140 mM NaCl and kept at 4°C (with 0.05% sodium azide) until use. For the gene Tb927.10.1500 (which codes for methionyl-tRNA synthetase), the DNA sequence were amplified by PCR using specific primers (8478-forward: CCCAAGCTTATGGCTCTAAAGCTGCTTTCAGA and 8479-reverse: CCCAGATCTTGTACTCTTTGTATTCTCTGTTGAGCG) and cloned into pLEW79-MH-TAP vector using HindIII and BamHI restriction sites with a C-terminal tandem affinity purification (TAP)-tag. Plasmids were linearized with NotI digestion and transfected in T. brucei procyclic forms as previously described 11. Protein expression and purification was performed as previously reported 11. Briefly, T. brucei procyclic cells were grown in 1 liter of SDM-79 medium supplemented with 10% fetal bovine serum (Gibco BRL) at 27°C and protein expression were induced with 100 ng/ml of tetracycline (Sigma). For protein purification, 2.0 ×10¹⁰ procyclic cells were harvested and the pellet ressuspended in lysis buffer (50 mM Tris, 150 mM NaCl, 1% Triton-X100, 0.2% NP40) with EDTA-free protease inhibitor cocktail (Roche). The cleared lysate were incubated with Protein A Sepharose 4 fast flow (Pharmacia) for 2h rotating at 4°C. The protein-resin mix was washed with 100 ml of wash buffer (50 mM Tris, 600 mM NaCl, 0.2% NP40) followed by wash in 10 ml of Tobacco Etch Virus (TEV) protease buffer (50 mM Tris, 150 mM NaCl, 0.2% NP40, 1 mM DTT). The resin was incubated with 100u of AcTEV protease (Invitrogen) in 1ml of TEV buffer at 4°C for 2h. Afterwards, the proteins were eluted with 1.5 ml of TEV buffer and stored in aliquots at 4°C until use.
Preparation of tRNA substrate
The substrates tRNAIle, tRNASer and tRNAMet were prepared by in vitro transcription using the MEGAScript in vitro transcription kit (Ambion). A T7 promoter sequence (TAATACGACTCACTATAGGG) was added at the 5′ of the forward primers used to amplify the tRNAs from genomic DNA. Similarly, the CCA sequence was added to the reverse primers used to amplify the tRNAs (TGG sequence at the 5′ of the reverse primer). The template tRNAIle were amplified by PCR (using Phusion High Fidelity DNA polymerase, Fermentas) from genomic DNA using specific primers (9015-forward: TAATACGACTCACTATAGGGCTCCTATAGCTCAGTCGGTTAGAG and 9016-reverse: TGGTGCTCCCAACAGGGGTC). For tRNASer, primers 9019-forward: TAATACGACTCACTATAGGGTCACCATACCCAAGTGGTTACG and 9020-reverse: TGGCGTCACCAGCAGGATTCG were used. For tRNAMet we used the primers 10028-forward: TAATACGACTCACTATAGGGCGAGCGTGGCGC and 10029-reverse: TGGTGCGATCGGTGAGGCT. Additionally, the initial guanine (G) of the tRNAs was removed from the forward primers because the T7 polymerase transcripts carry the last G of the T7 promoter at the beginning of the RNA sequence. The in vitro transcription reaction for the tRNAs was extracted with phenol:chloroform:isoamyl alcohol (25:24:1) pH=5.2 (Fisher) and the aqueous phase, which contained the tRNAs, was precipitated with V/V isopropanol. The tRNAs were washed in 70% ethanol and resuspended in DEPC-treated H2O. The tRNA was stored in aliquots at −80°C until used. The tRNAs were folded prior to aminoacylation reactions by heating at 70°C for 10 minutes, followed by addition of 10mM of MgCl2 and slow cooling by incubation at RT for 5 minutes.
Aminoacylation assays
Aminoacylation assays were performed in aminoacylation buffer (30 mM HEPES buffer, 140 mM NaCl, 30 mM KCl, 40 mM MgCl2) with 1mM DTT, 200 μM ATP, 2u/ml inorganic pyrophosphatase (PPiase) (SIGMA-Aldrich), 1mM L-isoleucine (SIGMA-Aldrich), 40 μg/ml recombinant IleRS and 8 μM tRNAIle at 37°C (unless otherwise stated). Alternatively, 1 mg/ml of yeast tRNAs (SIGMA-Aldrich) or 0.4 mg/ml of T. brucei total RNA enriched in microRNAs were used. T. brucei total RNA enriched in microRNAs were prepared using a miRNA kit (Ambion) according to manufacturer’s instructions. The aminoacylation reactions (50μl total volume each) were performed in clear, flat bottom 96-well plates (Costar® 96-Well Standard Microplates) and incubated for 30 minutes at 37°C. Reactions were stopped by addition of 100 μl of malachite green (Echelon Biosciences) and developed for 30 minutes at RT. Absorbances were then measured at 620 nm using a Spectramax M2 (Molecular Devices). Assay for calculation of Z′-factor: Reactions were performed with 80 μg/ml recombinant IleRS, 8 μM tRNAIle, 200 μM ATP, 2u/ml inorganic pyrophosphatase (PPiase) (SIGMA-Aldrich), 5 mM L-isoleucine (SIGMA-Aldrich) at 37°C for 30 minutes. The reactions were stopped by addition of 100μl of malachite green. The Z′-factor were calculated as previously reported 12.
Enzymology assays and analysis
Reactions were performed in a 50μl volume with rIleRS enzyme (40 μg/ml), L-isoleucine (0.1, 0.5, 1, 5, 10 and 50 mM), 8 mu;M of tRNAIle, 2u/ml PPiase, 100μM ATP, and 1mM DTT in aminoacylation buffer. Reactions were incubated at 37°C; at 2.5, 5 and 10 minutes, 15 μl aliquots were withdrawn and mixed with 10 mM EDTA on ice to stop the reactions. 100 μl of malachite green solution was added, and the absorbance measured at 620 nm. For the Lloyd et al. 1995 method 7, reactions were performed as described above (for enzymology assays) except that reactions volume were 40μl with additional 0.2 mM 2-amino-6-mercapto-7-methylpurine riboside (MESG) and 0.4 u/ml of purine nucleoside phosphorylase (EnzChek® Phosphate Assay, Life Technologies). The reactions were incubated at 37°C and the absorbance measured at 360 nm for every 15 seconds for a period of 30 minutes. A phosphate standard (150–1000 pmol) was used for product quantification. Reaction velocities were calculated with data collected at the linear phase of the reaction using GraphPad Prism (v5). Velocities were plotted against the amino acid concentrations and Michaelis-Menten constants and kcat were calculated using GraphPad Prism (v5).
Identification of IleRS inhibitor and IC50 calculation
We searched the National Cancer Institute (NCI/DTP) database using the PubChem search engine for compounds with structural similarity equal or higher than 80% to the Ile-AMP intermediate. The Ile-AMP structure (smile: CC[C@@H](C)[C@H](N)C(=O)N[P](=O)(O)NC[C@@H]1O[C@H]([C@H](O)[C@H]1O) [N]2C=NC3=C2N=CN=C3N) was used as query. The molecule NSC616354 was identified and used for compound inhibition assays. The compound NSC616354 (stock solution prepared at 10 mM of dimethylsulfoxide, Sigma) were used at concentrations of 0.001, 0.05, 0.1, 0.5, 1 and 10 μM. Reactions were performed with 80μg/ml recombinant IleRS, 8 μM tRNAIle, 200 μM ATP, 2u/ml inorganic pyrophosphatase (PPiase) (SIGMA-Aldrich), 5 mM L-isoleucine (SIGMA-Aldrich) and incubated at 37°C for 20 minutes. Reactions were stopped by addition of 100μl of malachite green and absorbance measured at 620 nm. Data points were normalized to percentage, where 100% is equal the mean of the data points without inhibitor after background subtraction. Background values were obtained from reactions without enzyme. The IC50 were calculated using a nonlinear regression (dose response versus inhibitor) from GraphPad Prism (v5) for windows (GraphPad Software, Inc.).
Results and discussion
A spectrophotometric assay for measuring aminoacyl-tRNA synthetase activity
The aminoacyl-tRNA synthetase reaction produces pyrophosphate (PPi) and adenosine monophosphate (AMP) as a byproduct of ATP hydrolysis during ligation of the amino acid to its cognate tRNA (Figure 1a). Therefore, we couple the inorganic pyrophosphatase (PPiase) enzyme to the aminoacylation reaction for PPi conversion to inorganic phosphate (Pi), which can be easily detected using malachite green (Figure 1a). Addition of malachite green solution to the aminoacylation reaction results in malachite green reaction with Pi. As a result, a change in color from yellow to green can be detected and quantitatively measured using a spectrophotometer at 620 nm wavelength (Figure 1a). To initially test the assay, we cloned the T. brucei isoleucyl-tRNA synthetase and expressed in E. coli. The enzyme was purified using nickel-affinity magnetic beads (Figure 1b), and enzymatic activity confirmed in an aminoacylation assay using 32P-labelled tRNAIle as previously described 6 (not shown). To test the assay, we performed an aminoacylation reaction using rIleRS in presence of PPiase and the Pi produced was measured using malachite green solution. High levels of Pi (1,402 pmol) could be detected in the reaction containing rIleRS (Figure 1c), which resulted from the conversion of the PPi produced during the aminoacylation into Pi. On the other hand, a low amount of Pi (216 pmol) was detected when the assay was performed in the absence of rIleRS (Figure 1c). This amount corresponds to the conversion of the PPi present in the assay components themselves, since almost no Pi could be detected in absence of both enzymes. The amount of Pi produced in the reactions was quantified using an inorganic phosphate standard (figure 1d). This is an important part of the assay, because accurate reaction quantification is necessary for enzymology studies and compound screening in drug development.
Figure 1. A spectrophotometric assay for measuring aminoacyl-tRNA synthetase activity.

a) Schematic representation of the aminoacylation assay. Firstly, the aminoacyl-tRNA synthetase hydrolyzes ATP to conjugate the amino acid to AMP, thereby forming aminoacyl-adenylate (AA-AMP) and releasing pyrophosphate (PPi). In the second step of the reaction, the amino acid is transferred to the tRNA, resulting in aminoacyl-tRNA (AA-tRNA) formation and release of AMP. In this assay, the reaction is coupled with inorganic pyrophosphatase to cleave the PPi into two molecules of inorganic phosphate (2Pi). The Pi produced reacts with malachite green after incubation with a solution of malachite green/ammonium molybdate. As the assay develops, a change in color from yellow to green can be quantified at 620 nm using a spectrophotometer. b) 4–20% SDS/PAGE showing rIleRS of T. brucei stained with Imperial Protein Stain (PIERCE); M, protein ladder (#SM1811, Fementas). The protein migrates with an expected molecular weight of 122 kDa. c) Aminoacylation assay using malachite green solution to detect Pi. Reactions were performed with 40 μg/ml of rIleRS and 2 u/ml of PPiase at 37°C for 30 minutes. d) Inorganic phosphate standard used for assay quantification. Serial dilutions of PO4 in reaction buffer were incubated with malachite green solution and the absorbance was measured at 620 nm. Data points on (c) are presented as means of triplicate measures ± standard deviations (SD). Data on (d) are the means of 6 experiments ± SD.
Preparation of the tRNA substrate by in vitro transcription
An important aspect of the aminoacylation assay is the preparation of its substrate tRNA, which will vary according to the enzyme under study. For better specificity of the assay we recommend the use of the cognate specific tRNA rather than a mix of tRNAs (such as total cellular RNAs). The tRNA can be easily prepared by in vitro transcription reactions. The first step in this process is to amplify the tRNA sequence from genomic DNA or other sources (i.e. plasmids, etc.) to be used as template in the in vitro transcription reaction. We amplified tRNAIle, tRNASer and tRNAMet from T. brucei genomic DNA using specific primers. The forward primers were designed to have a T7 promoter sequence at the 5′ before the tRNA sequence (Figure 2a). The addition of the T7 promoter is necessary because the PCR product can be directly used for the in vitro transcription reaction, bypassing the need to clone the tRNA into plasmids. During the in vitro transcription reaction, the T7 polymerase produces transcripts containing an extra guanine (from the T7 promoter sequence) at the 5′ of the tRNA; therefore, we have removed the first guanine of the tRNA from the forward primer sequence so that no additional sequence is present on the tRNA after in vitro transcription (see primer sequence in Materials and Methods). In the cases that this is not possible (and the extra guanine affects tRNA recognition by the enzyme), an alternative method for tRNA preparation can be used 13. For the addition of the CCA sequence at the 3′ of the tRNA, we have added the sequence TGG to the 5′ of the reverse primer (Figure 2a). Using the PCR product as template, we in vitro transcribed the tRNAs. The tRNAs were subsequently purified by phenol:chlorophorm:isoamyl-alcohol extraction, followed by ethanol precipitation and resuspended in RNAse-free water. It is important to note that at this stage, the tRNA can be stored at −80°C. Prior to the assay reaction, the tRNAs were folded by heating at 70°C for 10 minutes, followed by the addition of 10mM MgCl2 and slow cooling at RT. The aminoacylation assay performed with rIleRS and in vitro transcribed tRNAIle resulted in Pi release, which correlates with the amount of tRNAIle in a dose-dependent manner (Figure 2b). Although initial isoleucine-adenylate formation and PPi release by IleRS does not requires tRNAIle 14, its presence in the reaction is required for complete tRNA-aminoacylation. This promotes continuous amino acid activation, resulting in PPi release and formation of Ile-tRNA. Comparison of different sources of tRNAs were performed by measuring the activity of the rIleRS with in vitro transcribed tRNAIle, a mix of yeast tRNAs and a preparation of T. brucei total RNA enriched in microRNAs. The rIleRS activity was higher when in vitro transcribed tRNAIle was used than when either yeast tRNAs or microRNAs where used (Figure 2c). It is noteworthy that the use of in vitro transcribed tRNAs also avoids any possible mis-aminoacylation, which can happen when using multiple tRNAs from either total RNAs or yeast tRNA preparations.
Figure 2. Preparation of the tRNA substrate using in vitro transcription.

a) Schematic representation of tRNA preparation. The box on top of the figure shows how to design primers to amplify the tRNA gene by PCR to be used as template for in vitro transcription. The forward primer contains the T7 promoter sequence (in bold). The last guanine of the promoter sequence (in bold and larger size) will be incorporated in the tRNA after in vitro transcription. The n sequence represents the primer sequence specific to the tRNA to be amplified by PCR. For the reverse prime, the TGG sequence, which corresponds to the CCA, is shown in bold. For forward and reverse primers, the user should only substitute the n sequence with the primer sequence of the tRNA to be amplified. It should be noted that, when possible, the first guanine of the tRNA gene should be removed to avoid addition of extra nucleotides in the tRNA. The bottom of the figure shows a step-by-step diagram of the tRNA preparation. In 1, the tRNA template is produced by PCR amplification from genomic DNA; in 2, the tRNA is prepared by in vitro transcription using the PCR product as template; in 3, the tRNA is recovered from the in vitro transcription reaction by phenol:chloroform extraction and ethanol precipitation; in 4, the tRNA ressuspended in RNAse-free water is folded by heating and slow cooling in the presence of excess of MgCl2. b) Aminoacylation assay with in vitro transcribed tRNAIle. The reactions were performed with 0.8–20 μM of tRNAIle at 37°C for 45 minutes. c) Comparison of different tRNAs substrates for aminoacylation. Aminoacylation assays were performed with 4 μM tRNAIle prepared by in vitro transcription, 1 mg/ml total yeast tRNA and 0.4 mg/ml T. brucei microRNAs at 37°C for 30 minutes. A reaction performed without enzyme and with tRNAIle is shown as a negative control. Similar results were obtained when yeast tRNAs or T. brucei microRNAs were used without enzyme (not shown). Data points on (b) and (c) are presented as means of triplicate measures ± SD.
Assay validation and enzymology studies
To further validate the assay, we performed aminoacylation reactions using rIleRS and its cognate in vitro transcribed tRNAIle. Firstly, we performed a time-course experiment with different concentrations of enzyme to determine the aminoacylation rate over time. Since the assay is performed as an end-point reaction, we used 10 mM EDTA to stop the reaction, which does not affect malachite green detection. We detected an increase in the amount of product formed over time (Figure 3a). Product formation also increased according to the enzyme concentration in a dose-dependent manner (Figure 3a). It is noteworthy that the production of PPi is equimolar to the formation of aminoacyl-tRNAs 7. Furthermore, Pi conversion by PPiase has also been shown to be linear to the aminoacylation reaction 7, thereby permitting the use of a combined aminoacylation and PPiase reaction for kinetics studies. A dose-response assay was performed to determine the minimum concentration of rIleRS required for detection of activity. In this assay, 8μg/ml of rIleRS (corresponding to 400 ng of enzyme per reaction) was sufficient for detecting activity (Figure 3b). To test the assay with other enzymes, we expressed and purified the T. brucei seryl-tRNA synthetase from E. coli. A dose-response assay was performed using the corresponding in vitro transcribed tRNAs, and an increase in product formation was detected in a dose-dependent manner (Figure 3b). Similarly, product formation increased in a dose-dependent manner when using the T. brucei methionyl-tRNA synthetase purified from T. brucei procyclic stage using a Tandem Affinity Purification (TAP)-tag (Figure 3b). It is noteworthy that the enzyme concentrations used for these assays (65.5 – 655 nM) were less than the concentrations usually used in other methods (between 1 – 20 μM) 5, 7. We then evaluated whether this assay is suitable for high throughput screening by calculating the Z′-factor 12. The Z′-factor is a statistical coefficient that reflects the assay dynamic range and data variation, and is used to judge whether an assay is applicable for high-throughput screening 12. We determined the Z′ - factor by measuring reactions with and without rIleRS in a 96 well plate. The mean of reactions with rIleRS was 2,124 (± 174.4) pmol, whereas the mean without rIleRS was 338 (± 87.7) pmol (Figure 3c). The Z′ - factor was 0.56, which - according to Zang et al. 12 - is classified as a suitable (“excellent”) assay for high throughput screening. During the aminoacylation reaction the IleRS enzyme forms an Ile-AMP intermediate that interacts with the enzyme with high binding affinity (10−9 M) 14, 15. We searched the NCI/DTP database for molecules similar (≥80%) to the Ile-AMP structure to identify putative IleRS inhibitors. A similar approach has been successfully used for identification of inhibitors against bacterial IleRS 15. Using this approach we identified the compound NSC616354 (obtained from NCI) and tested it against the recombinant T. brucei IleRS. The NSC616354 inhibited the rIleRS activity in a dose-dependent manner and with IC50 of 0.6 μM (Figure 3d). These results indicate that this assay is suitable for compound screening and enzyme inhibition analysis. To investigate the applicability of this assay to enzymology studies, we performed enzyme kinetics with rIleRS with varying concentrations of L-isoleucine (from 0.1 mM to 50 mM) and enzyme velocities were calculated at the linear phase of the reactions. The results showed that the enzyme reaction is dependent on L-isoleucine concentration (Figure 3e). Velocities were slow at limiting concentrations of L-isoleucine (lower than 1 mM); however, as L-isoleucine concentration increased, the reaction velocity also increased until it reached its maximum. At saturating concentrations of L-isoleucine, product formation depended on the enzyme concentration (or enzyme active sites) rather than L-isoleucine availability. This result confirms that Pi production is proportional to L-isoleucine consumption. Using this experiment we calculated the Michaelis-Menten constant (Km), Vmax and kcat of rIleRS (Figure 3e and f). The results showed kinetic parameters in a similar range reported to other organisms, i.e. Km of 3.97 × 10⁻⁵ mol/L (39.7 μM) for T. brucei rIleRS, whereas for IleRS of other microorganisms it varied between 10 – 100μM 14; although differences could also be related to the microorganism specific biology. To further compare our assay, we performed a similar experiment at same conditions using the assay published by Lloyd et al. 1995 7. A higher Km (3.44 × 10⁻⁴ mol/L, 344 μM) was obtained using their assay (Figure 3e and f). The high Km obtained by the Lloyd et al. 1995 7 assay could be a result of the low signal to noise ratio of this assay. This can be observed by analyzing reaction velocities, which indicates an apparent low levels of product formed over time compared to our assay. Since both reactions were performed at the same conditions, it is unlikely that the velocities are different. However, this apparent difference could have resulted either because MESG catalysis by the purine nucleoside phosphorylase enzyme is not linear with the aminoacylation reaction or because the assay sensitivity is low resulting in absorbance values very close to the background noise.
Figure 3. Assay validation and enzymology studies.
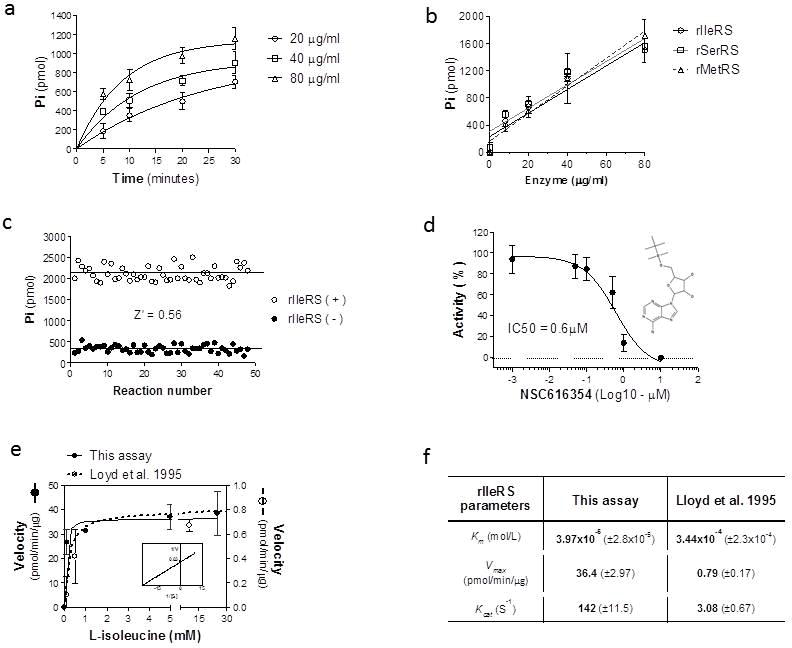
a) Time-course activity of rIleRS. Reactions were performed with 20, 40 and 80μg/ml of rIleRS and incubated at 37°C for 5, 10, 20 and 30 minutes. Reactions without enzyme were used as negative controls (background). The background values were subtracted from the data shown. b) Formation of Pi in the aminoacylation assay is dependent on enzyme concentration. Assays were performed with 8–80 μg/ml of rIleRS, rSerRS and rMetRS at 37°C for 30 minutes. Linear regression fit was performed with GraphPad Prism. c) Analysis of assay Z′-factor. Reactions were performed in a 96 well plate without or with rIleRS (80μg/ml) and incubated for 30 minutes at 37°C. The Z′ - factor was calculated as described by Zang et al. 12. d) Dose-inhibition assay of rIleRS activity with NSC616354 inhibitor. Assays were performed with 80μg/ml of rIleRS. Concentrations of 0.001 to 10 μM of NSC616354 were added to the reactions and incubated for 20 minutes at 37°C. Results are expressed as percentages of rIleRS activity, where the mean of the reactions without inhibitor was set to 100%. IC50 values were calculated using a nonlinear regression with GraphPad Prism (v5). The insert shows the chemical structure of the NSC616354 compound. e) Enzymology analysis of rIleRS. Assays were performed with L-isoleucine (0.1 mM to 50 mM) and 40 μg/ml rIleRS using this method and the previously published method by Lloyd et al. (1995) 7. Velocities were calculated at the linear phase of the reaction and plotted against amino acid concentration. The Michaelis-Menten constant (Km), Vmax and kcat were calculated using GraphPad Prism. The insert shows the Lineweaver-Burke plot of rIleRS activity calculated by this method. f) Comparison of the Km, Vmax and kcat of rIleRS in relation to L-isoleucine by this method and the Lloyd et al. (1995) 7 method. Data on (a) are presented as means of three experiments in duplicate ± SD. Data on (b), (d) and (e) are the means of three experiments ± SD.
We have developed a convenient and accurate spectrophotometric assay for measuring aminoacyl-tRNA synthetase activity. The assay was used to quantitatively measure enzyme activity and it is suitable for high throughput screening and enzymology studies. We also demonstrated in detail how to readily and reliably prepare the tRNA substrate, thereby facilitating the application of the assay to other aminoacyl-tRNA synthetases. The assay is very sensitive, detecting picomoles of product and its performance (Z′ - factor of 0.56) is suitable for high throughput screening. The assay has a low cost and since it is absorbance-based it does not require a sophisticated high throughput screening platform for its use. The assay can also be adapted to 384-well plate formats for higher throughput screening and will facilitate the identification of aminoacyl-tRNA synthetase inhibitors for drug development.
Acknowledgments
We are very grateful to Dr. Lindsay Carpp for revision of the manuscript.
Funding
This work was supported by National Institutes of Health [R01 AI078962 (to K.S)]. I.C. was awarded a National Institutes of Health fellowship administered by University of Washington [5T32AI007509-12].
References
- 1.Ibba M, Soll D. Aminoacyl-tRNA synthesis. Annu Rev Biochem. 2000;69:617–50. doi: 10.1146/annurev.biochem.69.1.617. [DOI] [PubMed] [Google Scholar]
- 2.Espanol Y, Thut D, Schneider A, Ribas de Pouplana L. A mechanism for functional segregation of mitochondrial and cytosolic genetic codes. Proc Natl Acad Sci U S A. 2009;106(46):19420–5. doi: 10.1073/pnas.0909937106. [DOI] [PMC free article] [PubMed] [Google Scholar]
- 3.Istvan ES, Dharia NV, Bopp SE, Gluzman I, Winzeler EA, Goldberg DE. Validation of isoleucine utilization targets in Plasmodium falciparum. Proc Natl Acad Sci U S A. 2011;108(4):1627–32. doi: 10.1073/pnas.1011560108. [DOI] [PMC free article] [PubMed] [Google Scholar]
- 4.Gonzalez-y-Merchand JA, Colston MJ, Cox RA. Effects of growth conditions on expression of mycobacterial murA and tyrS genes and contributions of their transcripts to precursor rRNA synthesis. J Bacteriol. 1999;181(15):4617–27. doi: 10.1128/jb.181.15.4617-4627.1999. [DOI] [PMC free article] [PubMed] [Google Scholar]
- 5.Francklyn CS, First EA, Perona JJ, Hou YM. Methods for kinetic and thermodynamic analysis of aminoacyl-tRNA synthetases. Methods. 2008;44(2):100–18. doi: 10.1016/j.ymeth.2007.09.007. [DOI] [PMC free article] [PubMed] [Google Scholar]
- 6.Ledoux S, Uhlenbeck OC. [3′-32P]-labeling tRNA with nucleotidyltransferase for assaying aminoacylation and peptide bond formation. Methods. 2008;44(2):74–80. doi: 10.1016/j.ymeth.2007.08.001. [DOI] [PMC free article] [PubMed] [Google Scholar]
- 7.Lloyd AJ, Thomann HU, Ibba M, Soll D. A broadly applicable continuous spectrophotometric assay for measuring aminoacyl-tRNA synthetase activity. Nucleic Acids Res. 1995;23(15):2886–92. doi: 10.1093/nar/23.15.2886. [DOI] [PMC free article] [PubMed] [Google Scholar]
- 8.Wu MX, Hill KA. A continuous spectrophotometric assay for the aminoacylation of transfer RNA by alanyl-transfer RNA synthetase. Anal Biochem. 1993;211(2):320–3. doi: 10.1006/abio.1993.1276. [DOI] [PubMed] [Google Scholar]
- 9.Hol W Pubchem. [accessed on September 5th, 2012]; http://pubchem.ncbi.nlm.nih.gov/assay. Luminescence-based biochemical high throughput confirmation assay for inhibitors of Trypanosoma brucei methionyl tRNA synthetase (MetRS)
- 10.Dermyer M, Wise SC, Braden T, Holler TP. Simultaneous screening of multiple bacterial tRNA synthetases using an Escherichia coli S30-based transcription and translation assay. Assay Drug Dev Technol. 2007;5(4):515–21. doi: 10.1089/adt.2007.061. [DOI] [PubMed] [Google Scholar]
- 11.Carnes J, Schnaufer A, McDermott SM, Domingo G, Proff R, Steinberg AG, Kurtz I, Stuart K. Mutational analysis of Trypanosoma brucei editosome proteins KREPB4 and KREPB5 reveals domains critical for function. Rna. 2012 doi: 10.1261/rna.035048.112. [DOI] [PMC free article] [PubMed] [Google Scholar]
- 12.Zhang JH, Chung TD, Oldenburg KR. A Simple Statistical Parameter for Use in Evaluation and Validation of High Throughput Screening Assays. J Biomol Screen. 1999;4(2):67–73. doi: 10.1177/108705719900400206. [DOI] [PubMed] [Google Scholar]
- 13.Fechter P, Rudinger J, Giege R, Theobald-Dietrich A. Ribozyme processed tRNA transcripts with unfriendly internal promoter for T7 RNA polymerase: production and activity. FEBS Lett. 1998;436(1):99–103. doi: 10.1016/s0014-5793(98)01096-5. [DOI] [PubMed] [Google Scholar]
- 14.Nakama T, Nureki O, Yokoyama S. Structural basis for the recognition of isoleucyl-adenylate and an antibiotic, mupirocin, by isoleucyl-tRNA synthetase. J Biol Chem. 2001;276(50):47387–93. doi: 10.1074/jbc.M109089200. [DOI] [PubMed] [Google Scholar]
- 15.Schimmel P, Tao J, Hill J. Aminoacyl tRNA synthetases as targets for new anti-infectives. Faseb J. 1998;12(15):1599–609. [PubMed] [Google Scholar]