

Abstract
Drug-target kinetics has recently emerged as an especially important facet of the drug discovery process. In particular, prolonged drug-target residence times may confer enhanced efficacy and selectivity in the open in vivo system. However, the lack of accurate kinetic and structural data for series of congeneric compounds hinders the rational design of inhibitors with decreased off-rates. Therefore, we chose the Staphylococcus aureus enoyl-ACP reductase (saFabI) - an important target for the development of new anti-staphylococcal drugs - as a model system to rationalize and optimize the drug-target residence time on a structural basis. Using our new, efficient and widely applicable mechanistically informed kinetic approach, we obtained a full characterization of saFabI inhibition by a series of 20 diphenyl ethers complemented by a collection of 9 saFabI-inhibitor crystal structures. We identified a strong correlation between the affinities of the investigated saFabI diphenyl ether inhibitors and their corresponding residence times, which can be rationalized on a structural basis. Due to its favorable interactions with the enzyme, the residence time of our most potent compound exceeds 10 hours. In addition, we found that affinity and residence time in this system can be significantly enhanced by modifications predictable by a careful consideration of catalysis. Our study provides a blueprint for investigating and prolonging drug-target kinetics and may aid in the rational design of long-residence-time inhibitors targeting the essential saFabI enzyme.
Keywords: residence time, fatty acid biosynthesis, Staphylococcus aureus FabI, enoyl-ACP reductase, enzyme kinetics, crystallography, structure based drug design
Introduction
When developing lead compounds against a validated drug target, the traditional drug discovery paradigm has focused primarily on optimizing drug-target thermodynamics and in vivo pharmacokinetics (1). However, there has been a recent realization that efficacy and selectivity may also be driven by drug-target kinetics, an overlooked dimension in the conventional SAR profile (1-3). In particular, drug-target residence time, which is defined as the reciprocal of the dissociation rate constant, has been shown to be a promising early stage indicator of in vivo drug activity. In agreement with this proposal, 26 % of the drugs approved by the FDA between 2001 and 2004 exhibit time-dependent inhibition of their targets (1, 2).
In a recent study, the residence time of inhibitors targeting the Francisella tularensis enoyl-ACP reductase (ftFabI) was strongly correlated with survival rate in a tularemia mouse model of infection (4). Understanding the molecular interactions that modulate the rate of dissociation from the FabI enzyme would, therefore, greatly aid in the design of new and effective antibiotics, which are urgently needed.
Staphylococcus aureus is a particularly dangerous pathogen in settings such as hospitals because it is carried by healthy people, mostly in the anterior nares, and is readily transferred to immunocompromised patients (5, 6). The evolution of antibiotic-resistant strains is, hence, of particularly grave concern since it can very rapidly lead to uncontrolled nosocomial outbreaks (7). Unfortunately, methicillin-resistant strains (MRSA) are widespread, and the severity of this problem has been further compounded by the development of resistance against vancomycin, the “drug of last resort” (8-10). Thus, there is an urgent need for new drugs against orthogonal targets to combat these constantly adapting pathogens.
The type II fatty acid biosynthesis pathway (FAS II), which is involved in the endogenous production of lipids to be incorporated into the bacterial cell membrane, is a promising source for new drug targets (Figure 1). There has been a recent controversy regarding the essentiality of this pathway for septic infections caused by Gram-positive bacteria, such as S. aureus, given the lipid-rich environment of human serum (11). However, several studies have emerged in support of FAS II as a valid drug target in S. aureus by demonstrating in vivo efficacy in animal models of infection and revealing heterogeneity in the incorporation and composition of fatty acids among Gram-positive bacteria (12-14). Among the FAS II enzymes, FabI, which catalyzes the final step in the catalytic cycle, has garnered the most attention as an antibacterial target (15). This was spurred by the discoveries that diazaborines, triclosan and isoniazid, the latter a front-line anti-tuberculosis prodrug, all target this enoyl-ACP reductase (15-19). In fact, three separate S. aureus FabI (saFabI) inhibitors are currently in clinical trials (20-23).
Figure 1.

The bacterial fatty acid biosynthesis pathway in S. aureus. FabI is the enoyl-ACP reductase in the pathway.
Here, we aim to rationally improve the residence time of saFabI inhibitors by analyzing a series of enzyme-product-drug ternary complex inhibitors using X-ray crystallography and a simple, widely applicable mechanistic approach for kinetics-informed drug discovery efforts. We identified a strong correlation between the affinities of the investigated saFabI diphenyl ether inhibitors and their corresponding residence times, which could be rationalized on a structural basis. The mechanistic insights garnered through a consideration of both catalysis and inhibition may prove significant in the rational improvement of small molecules targeting saFabI.
Experimental Procedures
Compound synthesis
Synthesis of PT51, PT55, PT52, PT103, PT53, PT01, PT02, PT03, PT04, PT05 and PT13 were described previously (24-26). PT68, PT89, PT162, PT446, PT447, PT448 and PT119 were synthesized from their corresponding A-rings with 2-fluoro-benzonitrile in the presence of K2CO3/dimethylformamide at 170 °C. Similarly, PT104 was synthesized from 1-fluoro-2-methoxy-4-nitro-benzene and phenol at 120 °C. Finally, all the compounds were demethylated using BBr3. Triclosan was purchased from EMD Millipore Chemicals.
Expression and purification of saFabI
SaFabI was expressed and purified as described previously (14). Briefly, we expressed the safabi gene in Escherichia coli BL21 (DE3), lysed the cells and isolated the saFabI enzyme via Ni2+ affinity chromatography. Finally, size exclusion chromatography yielded > 95% pure protein in 20 mM trisodium citrate pH 5.6, 280 mM NaCl, 280 mM potassium glutamate and 1 mM EDTA.
Crystallization, data collection and structure determination
As described previously, saFabI was concentrated to 15 mg/ml for co-crystallization experiments (14). Prior to crystallization, saFabI was incubated for 2 hours at 4 °C with a 10-fold molar excess of NADP+ and a 20-fold molar excess of the respective diphenyl ether inhibitor. In vapor diffusion experiments, diffraction-quality crystals of space group P1 were obtained using a precipitant solution composed of 0.1 M Na/K-phosphate pH 6.5 and 35 - 47% 2-methyl-2,4-pentanediol (MPD). In order to obtain saFabI-NADP+-PT55 crystals, the protein had to be incubated with the ligands in 25 mM Tris pH 8.0 and 200 mM NaCl at 20 °C prior to concentrating the enzyme from 1 to 15 mg/ml. After directly flash-freezing the crystals in liquid nitrogen, diffraction data were collected to a resolution ranging from 2.15 to 2.50 Å at the MX beamline 14.1 at BESSY II (27) (λ = 0.918 Å, T = 100 K) utilizing a MarMosaic 225 detector (PT02, PT04, PT13, PT55, PT68, PT70 and PT119), beamlines ID14-1 (λ = 0.933 Å, T = 100 K) with an ADSC Quantum Q210 detector (PT03) and ID29 (λ = 0.976 Å, T = 100 K) equipped with a Pilatus 6M detector (PT53) at the ESRF as well as on a Rigaku MicroMax-007 HF X-ray generator (λ = 1.542 Å, T = 100 K) using a R-Axis HTC detector (PT53). Data processing was performed with Imosflm (28) and Scala (29) (PT02, PT04, PT13, PT55, PT68, PT70 and PT119) or the XDS package (30) (PT03, PT53), respectively. The structures were solved by molecular replacement with Phaser (31) using our previously published saFabI structure as search model (PDB-code: 4ALK) (14). Maximum likelihood refinement with Refmac 5 (32) (including TLS refinement (33)) was alternated with model building in Coot (34) to obtain the final structures including NADP+ and inhibitors, which were unambiguously identified in the resulting electron density maps. Data collection and refinement statistics are given in Supplementary Table 1. Structure analysis was performed as described previously (14) and Figures were prepared with PyMOL (35). The model coordinates and structure factors for the saFabI-NADP+-inhibitor ternary complexes have been deposited in the Protein Data Bank with the codes 4BNF (inhibitor PT02), 4BNG (PT03), 4BNH (PT04), 4BNI (PT13), 4BNJ (PT53), 4BNK (PT55), 4BNL (PT68), 4BNM (PT70), and 4BNN (PT119)
Thermal shift assay
ThermoFluor experiments were carried out in 96-well plates (Concord) using the CFX96 Real-Time PCR Detection System and C1000 Thermal Cycler (Bio-Rad). Samples contained 7.4 μM saFabI, 2.5 mM NADP+ or NADPH, 25 μM inhibitor (2% DMSO) and 5× Sypro Orange (Sigma) in 20 μL final volume of 50 mM potassium phosphate pH 7.5, 150 mM NaCl, 1 M potassium glutamate and 8% glycerol. The plates were sealed with Microseal ‘B’ Film (Bio-Rad) and heated from 25 to 90 °C in increments of 0.2 °C/10 s. Data were processed by the Bio-Rad CFX Manager.
Progress curve kinetics
Kinetic experiments were performed on a Cary 100 spectrophotometer (Varian) at 20 °C. Reaction velocities were measured by monitoring the oxidation of NADPH to NADP+ at 340 nm (ε = 6220 M-1 cm-1). The reaction mixture for forward progress curve experiments has been described previously (14) . In the absence of inhibitor, the time window of progress curve linearity was generally limited by substrate consumption rather than enzyme stability (Supplementary Figure 1). The resulting progress curves were analyzed via the Morrison & Walsh integrated rate equation (Equation 1) (36),
| (Eq 1) |
where At and A0 are the absorbance at time t and time 0, vi and vs are the initial and steady state velocities and kobs is the pseudo-first order rate constant for the approach to steady-state. Kiapp values, which correspond to the steady-state inhibition IC50, were determined by plotting the fractional steady-state velocities as a function of inhibition concentration and fitting to the isotherm equation (Equation 2),
| (Eq 2) |
where vu is the control, uninhibited reaction velocity. To calculate k-1, which corresponds to the dissociation rate (koff) of the inhibitor, from each progress curve, we used Equation 3.
| (Eq 3) |
We can also determine k-1 by fitting the kobs values from each progress curve to Equation 4.
| (Eq 4) |
The commonly used jump dilution assay (1, 36, 37) was used to monitor the recovery of enzyme activity following ternary complex formation. 10 μM saFabI, 15 μM inhibitor and 500 μM NADP+ were preincubated overnight at room temperature followed by 1:200 dilution into reaction buffer (50 mM potassium phosphate pH 7.5, 150 mM NaCl, 1 M potassium glutamate, 8% glycerol) containing 1.5 mM crotonyl-CoA (Sigma; Advent Bio) and 350 μM NADPH. The resulting progress curve was fitted to Eq 1. All curve fitting was performed using KaleidaGraph Version 4.1.
Kinetic modeling
A set of ordinary differential equations were constructed based on the kinetic mechanism depicted in Figure 2 and numerically solved using Wolfram Mathematica 8 (38). The rationale behind the chosen kinetic parameters is provided in Supplementary Table 2.
Figure 2.

Mechanistic model for slow-binding kinetics. Three possible mechanisms (A, B and C) of slow-binding inhibition are depicted. In addition, the detailed kinetic mechanism for inhibition of saFabI by diphenyl ethers is shown below.
32P dissociation kinetics
A mixture of 15 μM saFabI R40Q/K41N/S44L, 20 μM NAD+, 32P-NAD+ (800 Ci/mmol) and 200 μM inhibitor in reaction buffer was preincubated at room temperature overnight. Following gel filtration to remove excess free ligand, 500 μL of the mixture was rapidly diluted into 60 mL reaction buffer to initiate dissociation of the ternary complex. 600 μL aliquots of the diluted mixture were withdrawn at various time points, followed by immediate loading onto an ultrafiltration spin column (Sartorious, 10 kDa) and centrifugation at 13,400 rpm for 90 seconds. The amount of 32P in the flow through was quantified by a scintillation counter. Data was fit to Equation 5,
| (Eq 5) |
where C(t) and C(0) are the radioactive counts (cpm) at time t and time 0, Cmax is the maximum radioactive count and koff is the inhibitor dissociation rate.
Results
Diphenyl ethers bind to the E-NADP+ complex generated via catalysis
Triclosan and its diphenyl ether analogues are slow-binding inhibitors of the FabI enzyme from a number of organisms, including S. aureus and F. tularensis (4, 39, 40). Although we have previously used the Morrison and Walsh equations to analyze the slow-binding inhibition of ftFabI, we are cognizant that the integrated equations used to analyze progress curve data for slow-binding inhibitors were originally developed for a simple model in which a single-substrate reaction is competitively inhibited by a substrate analog (4, 36). To confirm that the Morrison and Walsh integrated equations can be used to analyze the more complex inhibition of FabI, it was first necessary to elucidate a more precise mechanism of inhibition by diphenyl ethers.
FabI catalyzes an ordered Bi Bi reaction, and diphenyl ethers bind uncompetitively with respect to the product NAD(P)+ (39, 40). To determine the primary origin of the E-NADP+ complex relevant for inhibitor binding, progress curves were obtained for a slow-binding inhibitor (PT53) in the presence of 400 and 2000 μM NADP+. These curves were essentially identical (Supplementary Figure 2B), suggesting that the product of the catalytic cycle rather than binding of NADP+ to the free enzyme was the dominant source of E-NADP+ under the assay conditions. The significance of the E-NADP+ complex generated via catalysis for saFabI inhibition has been hinted at in a recent publication (41), and is consistent with the very weak NADP+ product inhibition of the free enzyme (Supplementary Figure 2A). Additionally, the onset and degree of inhibition increased when using substrates with higher kcat (data not shown), consistent with a higher steady-state concentration of E-NADP+ generated via catalysis.
Previous studies proposed that diphenyl ethers bind preferentially to the E-NAD(P)+ complex but still exhibit potent binding to the E-NAD(P)H complex (4, 25, 40, 42, 43). However, thermal shift assays revealed exclusive binding of the diphenyl ethers to the saFabI E-NADP+ complex (Figure 3). Mechanistic models operating under the assumption that diphenyl ethers bind to the E-NAD(P)H complex are, therefore, erroneous. Instead, the most accurate model is depicted in Figure 2, which was initially proposed for the inhibition of saFabI by triclosan (39). Kinetic rate constants were rationally derived for each step of the model on the basis of broad experimental data. By numerically solving the system of differential equations, a set of progress curves was generated for a hypothetical inhibitor with predetermined k1 and k-1. Analysis of this theoretical set of curves by the Morrison and Walsh equations resulted in a reliable estimate of k-1 (Supplementary Table 3). This validated the direct use of these equations to analyze the more complex case of FabI inhibition despite its derivation from a simple mechanistic scheme. Surprisingly, accurate estimates of k-1 can be obtained at inhibitor concentrations lower than the enzyme concentration without even accounting for tight-binding inhibition. This is due to the fact that the steady-state population of E-NADP+ at the given reaction velocity is much lower than the concentration of free enzyme.
Figure 3.

Diphenyl ethers bind preferably to the E-NADP+ binary complex. Representative thermal shift curves of saFabI bound to NADPH, NADP+ and/or inhibitor (PT119). The measurement variability is approximately ± 0.2 °C.
Diphenyl ethers bind to saFabI via an induced-fit mechanism
Progress curves corresponding to inhibition of saFabI by diphenyl ethers exhibited curvature characteristic of slow-binding kinetics (Figure 4). Slow-binding inhibition generally encompasses one of three kinetic mechanisms (Figure 2; top) (2, 36, 44). The most basic mechanism involves a one-step process with slow inhibitor association accounting for slow formation of the EI complex (Figure 2; Mechanism A). A two-step process, which is most often encountered for slow-binding inhibitors, involves rapid formation of EI followed by a slow induced-fit conformational change to the more potent EI* (Figure 2; Mechanism B). Alternatively, a two-step process may entail a slow conformational change to an enzyme form that rapidly binds inhibitor (Figure 2; Mechanism C). To elucidate the mechanism of slow-binding inhibition, kobs was plotted as a function of inhibitor concentration (Figure 4C). The increasing linear plot unambiguously rules out the possibility of a conformational selection mechanism (Mechanism C) (45). Typically, this is characteristic of a single-step slow-binding mechanism of inhibition, whereas the two-step induced-fit mechanism is generally characterized by a hyperbolic relationship. However, the one-step mechanism is kinetically indistinguishable from a special case of the two-step mechanism where EI* is much lower in free energy than EI. In this situation, initial inhibition is not detected at low inhibitor concentrations that still affect the steady-state velocity. In a recent report, we structurally characterized the extensive rearrangements that build the active site upon ligand binding (14). Based on these results, binding of the diphenyl ether inhibitors may induce a directional structural change in the enzyme (special case of Mechanism B). Since the results are analyzed in accordance with Mechanism A (Figure 2), k1 and k-1 would, in the special case of Mechanism B, represent the respective overall apparent association and dissociation rate constants between E + I and EI*.
Figure 4.

Progress curve analysis of saFabI inhibition by diphenyl ether analogues. (A) Representative example of progress curves generated with varying concentrations of PT52 (•). Theoretical curves (—) have been superimposed on the experimental data. These curves were generated using the kinetic parameters in Table 1 and Equation 1. R2 (goodness of fit between theoretical curves and experimental data) = 0.99, 0.95, 0.97 and 0.93 for 250, 500, 750 and 1000 nM PT52, respectively. (B, C) These plots display the corresponding fractional steady-state velocity (vs/v0) and pseudo-first order rate constant (kobs) as a function of inhibitor concentration. Theoretical curves (—) have been superimposed on the experimental data. These curves were generated using the kinetic parameters in Table 1 and Equation 2 or 4. R2 (goodness of fit between theoretical curves and experimental data) = 0.93 and 0.90 for the IC50 and kobs plots, respectively.
Diphenyl ether residence time strongly correlates with affinity
A detailed understanding of the mechanism and interactions that modulate drug-target residence time is particularly important for future drug discovery programs. However, the rational design of inhibitors with decreased off-rates is still very challenging. This task is further hampered by the lack of accurate kinetic data for large compound series (2). Using a mechanistically informed kinetic approach, we analyzed a series of 20 saFabI inhibitors (Table 1). The kinetic barrier to dissociation can be increased by either stabilizing the ground state enzyme-inhibitor complex or destabilizing the transition state (Figure 5A) (2). Interestingly, the dissociation rate displays a strong linear correlation to Ki in a double logarithmic plot, suggesting that the energetics involved in residence time differentiation are related to stabilization of the final enzyme-inhibitor complex (Figure 5B). In addition, the association rate is very similar across the diphenyl ether series, indicating a similar barrier to the transition state. Importantly, this highlights the fact that the following structural rationale for binding affinity trends also applies to residence time.
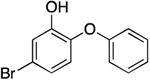
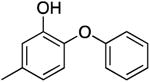
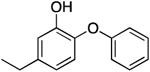
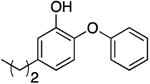
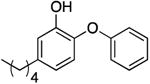
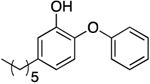
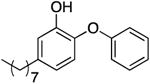
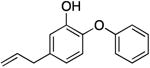
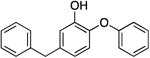
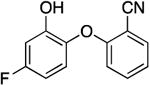
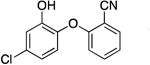
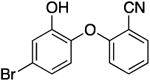
Table 1. Kinetic and thermodynamic parameters for inhibitors of saFabI a.
| Name | Structure | Kiapp (nM) | Ki (nM) | k1 (× 1010 M-1 hr-1)h | k-1(hr-1) | tR(min) i |
|---|---|---|---|---|---|---|
| PT51 |
|
24515.0 ± 1359.8 | 18.86 ± 1.05 | ≥ 0.30 | rapid e | ≤ 1 |
| PT55 |
|
1851.8 ± 127.4 | 1.42 ± 0.10 | 0.68 ± 0.23 | 9.67 ± 3.14 b | 6.2 b |
| 25.36 ± 2.45 c | 2.4 c | |||||
| PT104 |
|
1933.4 ± 345.2 | 1.49 ± 0.27 | 0.61 ± 0.46 | 9.03 ± 6.58 b | 6.6 b |
| PT52 |
|
161.2 ± 8.4 | 0.12 ± 0.01 | 1.37 ± 0.27 | 1.70 ± 0.30 b | 35.3 b |
| 2.33 ± 0.03 c | 25.8 c | |||||
| 2.13 ± 0.41 d | 28.2 d | |||||
| PT103 |
|
77.7 ± 9.4 | 0.06 ± 0.01 | 1.30 ± 0.25 | 0.78 ± 0.08 b | 76.9 b |
| 0.73 ± 0.09 d | 82.2 d | |||||
| PT53 |
|
493.7 ± 40.2 | 0.38 ± 0.03 | 0.91 ± 0.11 | 3.46 ± 0.29 b | 17.3 b |
| 4.53 ± 0.08 c | 13.2 c | |||||
| PT01 |
|
120.8 ± 10.1 | 0.09 ± 0.01 | 1.01 ± 0.19 | 0.94 ± 0.14 b | 63.8 b |
| 0.72 ± 0.08 d | 83.3 d | |||||
| PT02g |
|
0.07 | 1.33 | 0.99 b | 60.9 b | |
| 0.57 ± 0.09 d | 105.3 d | |||||
| PT03 g |
|
0.04 f | 0.58 | 0.20 b | 300.0 b | |
| 0.32 ± 0.17 d | 187.5 d | |||||
| PT04 g |
|
0.01 f | 1.30 | 0.13 ± 0.04 d | 461.5 d | |
| PT05 g |
|
0.82 | 0.25 | 2.03 b | 29.6 b | |
| 3.74 ± 0.06 c | 16.0 c | |||||
| PT68 |
|
145.2 ± 9.1 | 0.11 ± 0.01 | 0.79 ± 0.10 | 0.87 ± 0.07 b | 68.7 b |
| PT89 |
|
123.2 ± 7.9 | 0.10 ± 0.01 | 0.68 ± 0.09 | 0.64 ± 0.06 b | 93.5 b |
| PT446 |
|
1311.3 ± 246.6 | 1.01 ± 0.19 | 0.30 ± 0.16 | 2.99 ± 1.50 b | 20.1 b |
| PT447 |
|
72.0 ± 7.4 | 0.06 ± 0.01 | 0.80 ± 0.14 | 0.44 ± 0.02 b | 136.4 b |
| 0.47 ± 0.08 d | 127.7 d | |||||
| PT443 g |
|
0.05 | 0.62 | 0.28 b | 210.9 b | |
| PT119 |
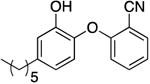
|
0.01 f | 0.80 | No recovery c | 750d | |
| 0.08 ± 0.01 d | ||||||
| PT13 g |
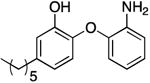
|
0.12 | 0.73 | 0.88 b | 68.5 b | |
| TCL |
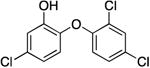
|
69.2 ± 5.5 | 0.05 ± 0.01 | 0.81 ± 0.22 | 0.43 ± 0.08 b | 139.5 b |
| PT162 g |
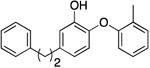
|
0.5 | 0.57 | 2.66 b | 22.6 b |
Fitting errors are reported for each value in the Table, unless otherwise specified.
Mean value calculated from individual progress curves. Errors reflect the standard deviation from the mean.
Determined by fitting the jump dilution curve to Eq 1.
Determined by fitting the 32P-NAD-based dissociation curve to Eq 5.
Defined as ≥ 60 hr-1.
Affinity was calculated using the k-1 value obtained from the 32P-NAD dissociation assay since the dissociation rate was too slow and/or inhibition was too potent. The k1 value was obtained from forward progress curve analysis.
Values estimated from a single progress curve at a single inhibitor concentration.
Errors are propagated from Ki and k-1.
Residence time tR = 1/k-1
Figure 5.

Dissociation kinetics drive changes in thermodynamic affinity. (A) Energy diagram corresponding to Mechanism A in Figure 2. Residence time (tR = 1/k-1) can be prolonged by either stabilizing EI or destabilizing the transition state (TS). (B) A double logarithmic plot depicts a strong correlation between thermodynamic affinity and dissociation kinetics (black) and a weak correlation between association and dissociation kinetics (blue). On each axis, logarithmic values are adjusted such that their mean is equal to zero.
Hydrophobic 5-substituents enhance residence time and affinity
To obtain a detailed understanding of the kinetic and thermodynamic SAR profile, we solved the structures of saFabI in complex with the oxidized cofactor NADP+ and 9 diphenyl ethers differing in their substitution pattern (Figure 6, Table 1). All investigated inhibitors bind to the predominantly hydrophobic active site pocket and share a common binding pose stabilized by a π-π-stacking interaction with the NADP+ nicotinamide ring (interaction distance of 3.4 ± 0.1 Å) and a central hydrogen bond network between Tyr157, the diphenyl ether hydroxyl group and the 2′-OH of the NADP+ nicotinamide ribose (2.6 ± 0.1 Å or 2.5 ± 0.1 Å, respectively) (Figure 6). Substituents at the 5-position of the diphenyl ether A-ring bind to an elongated and very lipophilic binding channel mainly composed of Tyr147, Pro192, Val201, Phe204 and Ile207 (Figure 7A, B). Accordingly, we observed clear steric and hydrophobic contributions to binding at the 5-position of the A-ring (Table 1).
Figure 6.

Diphenyl ether binding to the binary saFabI-NADP+ complex. Nine diphenyl ether inhibitors are depicted within the saFabI binding pocket (in different colors as defined next to the molecules). All ternary complex structures were superimposed for this purpose. Distances between protein, inhibitor and cofactor atoms are given as mean values (the standard deviations are defined in the main text). All amino acids within a radius of 6 Å of PT04 except the substrate binding loop residues (194-204) are shown in a light blue surface representation. The substrate binding loop, which is in a similarly closed state for all nine structures, is displayed in gray. Main discrepancies between the depicted saFabI binding pocket of the PT04 structure and the remaining structures are discussed in Figure 7.
Figure 7.

Structural changes to saFabI caused by the binding of different 5-alkyldiphenyl ethers. (A) 5-Methyl-2-phenoxyphenol (PT53) is shown as a stick model within its binding pocket. This view shows an intersection through one of the respective saFabI monomers in surface representation. Thus, all parts of the molecule which are in front of an imaginary clipping plane are not visible. (B) The corresponding intersection for the 5-hexyl-2-phenoxyphenol (PT04) structure reveals a binding pocket enlarged around the 5-substituent. (C) Ile207 and the inhibitors of the superimposed PT53 and PT04 structures are shown. Meshes represent selected parts of the NCS-averaged isomorphous difference map at 5 σ. Additional experimental electron density for each structure is indicated by the associated color and clearly reveals a conformational change of Ile207. (D) The same map uncovers supplementary movements of Tyr147 and Val201. In addition, the binding of PT04 leads to a reduced occupancy of three water molecules, which are still bound between Tyr147 and Gly202 in the case of PT53. (E) Ile207 and 5-alkyl-2-phenoxyphenols with different alkyl chain lengths are shown. This view was generated via superposition of single monomers of the respective structures (the PT01 structure (PDB-code: 4ALK) was published previously (14)) and indicates a successive opening movement of Ile207. The color code is defined next to the molecules.
PT51, PT55 and PT104 comprise a subset of diphenyl ethers lacking hydrophobic bulk at this position. These compounds are noticeably the least potent of the diphenyl ethers tested. Consistently, a similar trend was recently observed for E. coli FabI (ecFabI) (41). Such inhibitors were previously characterized as rapid-binding, rather than slow-binding, inhibitors of ftFabI (4). However, similar to slow-onset inhibitors like PT52 (PDB-entry: 4ALJ) (14), the binding of PT55 to saFabI resulted in the closure of the substrate binding loop, which is believed to be responsible for slow-binding inhibition (15). In accordance, PT55 and PT104 exhibited clear slow-binding inhibition of saFabI. Slow-binding kinetics may be more difficult to detect with less potent compounds since higher inhibitor concentrations are required to observe inhibition. This may explain why slow-binding inhibition could not be observed for PT51 and may have been missed in the case of ftFabI (4).
Among compounds with hydrophobic bulk, a steric effect is very prominent. The stabilization conferred by substituting chlorine (PT52; PT447) with bromine (PT103; PT443) provides one such example. Additionally, residence time and affinity increased with aliphatic chain length up to six carbons. Upon elongation of the 5-substituent from methyl (PT53) to ethyl (PT01, PDB-entry: 4ALK), propyl (PT02), pentyl (PT03) and hexyl (PT04), the alkyl chain progressively extends into the aforementioned hydrophobic channel thereby explaining the observed koff and Ki trends (Figure 7A, B, E). Beyond this length, however, the alkyl chain is expected to reach the more polar protein surface, rationalizing the decrease in affinity and residence time with PT05. Further striking differences were found between the PT53 and PT04 structures as indicated by an isomorphous difference map. Whereas Ile207 adopts a closed state in the PT53 structure, a conformational change in this gatekeeper residue enables the longer 5-alkyl chains (e.g. the 5-hexyl group of PT04) to bind (Ile207-Cδ1 shifts by 3.4 ± 0.4 Å) (Figure 7C, E). The stepwise opening of the hydrophobic channel upon elongation of the alkyl chain is accompanied by its widening via movements of residues Tyr147 and Val201 (Tyr147-OH shifts by 0.5 ± 0.1 Å and Val201-Cγ1 by 0.9 ± 0.1 Å) (Figure 7D). A comparable mechanism was observed for the Mycobacterium tuberculosis homolog InhA during the binding of 5-octyl-2-phenoxyphenol, which induced a shift of Leu218 (corresponding to Ile207 in saFabI) (26). In contrast, ftFabI has a methionine at this position, which might explain the preference of the enzyme for PT02 (4, 14). The finding that this part of the saFabI binding pocket is flexible will be important for future inhibitor design efforts.
Diphenyl ethers likely bind in a deprotonated form to saFabI
Electrostatics of the A-ring 5-position contribute significantly to saFabI binding. Affinity and residence time increase with more electron-withdrawing substituents in the two series PT51, PT55, PT104 and PT53, PT52. The respective pKa values for the phenolic hydroxyl group are listed in Supplementary Table 4. We can probe the theoretical contribution of electrostatics to thermodynamic binding if we assume that only the deprotonated oxyanion species can bind to the enzyme. This kinetic simulation resembles the scheme in Figure 2 but also includes a rapid equilibrium inhibitor deprotonation step preceding binding to the E-NADP+ binary complex. The equilibrium distribution depends on inhibitor pKa and buffer pH. Among similarly sized substituents, apparent affinity differences can be almost entirely predicted by pKa using this theoretical approximation (Supplementary Table 4), suggesting that the inhibitor is bound in a deprotonated state. The slight disparities from experimental values may be rationalized by other factors, such as differences in sterics. This is a theoretical analysis to rationalize the observed magnitude of electrostatic stabilization. In reality, the similar association rate constants among the various compounds suggest that the protonated species can also bind to the enzyme, followed by subsequent deprotonation. The resulting oxyanion species might contribute to the high affinity binding of these inhibitors to saFabI due to the formation of a strong charge-assisted hydrogen bonding network and an electrostatic interaction between the negatively charged phenolic oxygen and the neighboring positive charges of the catalytic triad residue Lys164 and the oxidized cofactor NADP+ (Figure 6). The latter charge-assisted π-π stacking interaction between the inhibitor phenolate ring and the planar oxidized nicotinamide ring of the cofactor might also explain why diphenyl ethers specifically target E-NADP+ despite its lower steady-state abundance relative to E-NADPH. Based on our kinetic parameters (Supplementary Table 2), the E-NADPH complex is present at more than 300-fold higher concentrations compared to E-NADP+ under our assay conditions (Supplementary Table 3). However, further studies are required to unequivocally demonstrate that diphenyl ethers are bound to saFabI in their anionic form and to elucidate when deprotonation might occur.
Small and slightly polar 2′-substituents contribute to binding
We also obtained interesting SAR at the B-ring ortho position of the diphenyl ether analogs (Table 1). The introduction of a 2′-cyano group enhances affinity and residence time up to 2- and 3-fold, respectively. A methyl substituent (PT70, Figure 8B) also increased affinity (data not shown), while PT13 with an amino substituent displayed decreased affinity (Figure 8A). All investigated 2′-substituents bind to a narrow, elongated and slightly polar side pocket created by Ala95, Ser197 and the pyrophosphate moiety of NADP+ (Figure 8). However, only the linear CN group of PT119 reaches the bottom of this cavity with its polar tip, rendering it ideally suited to fully occupy this space (Figure 8D). In contrast, the steric fit is worse for H, CH3, Cl (triclosan, PDB-code: 4ALI), and NH2. In particular, the amino substituent is 12-fold less potent as its polar hydrogens have to be desolvated upon binding and cannot engage in geometrically favorable hydrogen bond interactions with surrounding protein residues (Figure 8A). Due to the clearly limited space in this region of the saFabI binding pocket, we advocate the usage of small B-ring ortho substituents in future drug design studies.
Figure 8.

Binding modes of different 2′-substituted saFabI diphenyl ether inhibitors. (A-C) Ala95, Ser197 and NADP+ are depicted in stick representation (gray) along with the B-ring ortho-substituted inhibitors PT13, PT70 and PT119 (colored according to Figure 6). Distances are given as mean values (standard deviation is 0.1 Å in all cases) (D) The 2′-cyano group (shown as space filling model) of PT119 fills the saFabI side pocket created by Ala95, Ser197 and NADP+ (shown as gray surface) with a good steric fit.
Alternative methods confirm the drug-target dissociation rates
Direct dissociation methods were used to further validate the forward progress curve-based kinetic characterization of diphenyl ethers. In the jump dilution assay, saFabI was pre-incubated overnight with inhibitor in the presence of NADP+ prior to dilution into buffer containing substrate. For less potent inhibitors, dilution allows for full recovery of enzyme activity (Figure 9A; see PT55 and PT52). Thus, for these inhibitors, it was found that the kobs values obtained using jump dilution analysis were in good agreement with k-1 values obtained via forward progress curve experiments (Table 1). Unfortunately, compound rebinding complicated the use of jump dilution assays to quantify dissociation of more potent inhibitors, resulting in only partial recovery of enzyme activity. Since the mechanism of inhibition precluded the use of saturating concentrations of substrate to compete against rebinding, kobs for these jump dilution curves overestimated the true k-1. Long-residence-time inhibitors also required a time window extending beyond the feasible assay limits. Nevertheless, given the kinetic parameters derived from progress curve analysis and the radioactivity-based method described below, we can predict the partially recovered jump dilution curve with great accuracy (Figure 9A; see PT447).
Figure 9.

Direct measurements of inhibitor dissociation. (A) Experimental jump dilution progress curves (•) are shown for the pre-formed saFabI-NADP+-PT55, saFabI-NADP+-PT52 and saFabI-NADP+-PT447 ternary complexes. Theoretical curves (—) have been superimposed on the experimental data. These curves were generated using the kinetic parameters in Table 1 and Equation 1. R2 (goodness of fit between theoretical curves and experimental data) = 0.98, 0.94 and 0.97 for PT55, PT52 and PT447, respectively. Unlike PT447, there is near recovery to the uninhibited reaction velocity for the less potent compounds PT55 and PT52. (B) Release of P32-NAD+ from the pre-formed ternary complex using the saFabI R40Q/K41N/S44L triple mutant is plotted as a function of time. The lines represent the best fits of the points to Equation 5 (R2 = 0.97 and 0.98 for PT52 and PT447, respectively). Fitted koff values are listed in Table 1.
To enable accurate characterization of long residence time inhibitors, we also developed a 32P-NAD+-based assay of inhibitor dissociation (Figure 9B). This was previously used to study dissociation of diphenyl ethers from the FabI homolog in M. tuberculosis, InhA (46). Since wild-type saFabI prefers binding to NADP+, we used the R40Q/K41N/S44L triple mutant. We showed previously that this mutant behaves exactly as the wild-type enzyme except for an exclusive preference for NAD(H) (4, 14). For all examined inhibitors, we observed good agreement between the k-1 values obtained via the different methods. This direct dissociation method is strongly preferred for the characterization of long-residence-time inhibitors which have very slow off rates (Table 1). For instance, PT119 had a residence time exceeding 700 minutes that could only be accurately measured using this radioactivity-based direct dissociation technique. For this particular inhibitor, progress curve analysis provided a poor estimate of k-1.
Discussion
In the quest for new effective therapeutics against increasingly resistant pathogens, it is crucial to understand the precise mechanisms of both pharmacologic and physiologic protein-ligand interactions. An improved molecular understanding of drug-target kinetics can be particularly valuable. Therefore, we chose saFabI - an important target for the development of new anti-staphylococcal drugs (47) - as a model system to rationalize and optimize the drug-target residence time on a structural basis.
A new, multifaceted approach was utilized to obtain a full kinetic characterization of saFabI inhibition by a series of diphenyl ethers. Using a precise, predictive mechanistic model, we can unravel the key kinetic parameters k1, k-1 and Ki for any given inhibitor from only a single progress curve at a single inhibitor concentration. All of this information is contained in the uninhibited and steady state velocity and pseudo-first order rate constant. The amount of time and substrate required for progress curve analysis has traditionally been limiting given the need for multiple progress curves to characterize a single inhibitor. We have, therefore, developed an extremely efficient and information-rich kinetic assay for future drug discovery efforts. The kinetic information attained via forward progress curve analysis was further validated by direct dissociation methods allowing for the accurate characterization of high affinity and long-residence-time saFabI inhibitors.
We found that dissociation rates and thermodynamic affinity are strongly correlated in a double logarithmic plot (Figure 5B). Very recently, a comparable correlation between Ki and koff has been demonstrated for the amino-nucleoside-based inhibitors of the human protein methyltransferase DOT1L (48). Interestingly, Maschera and coworkers identified a similar relationship for saquinavir binding to wild-type HIV-protease and three different resistance-conferring mutants (1, 49). Thus, nature may select for mutations that promote faster inhibitor dissociation as a primary resistance mechanism. The logarithmic values of k-1 and Ki are proportional to the dissociation energy barrier of the ligand ΔG-1 and its free energy of binding ΔGi. The energy barrier of dissociation, and hence the residence time, can be increased by either destabilizing the transition state or stabilizing the ground state of the final enzyme-inhibitor complex (2).
Rational optimization of the residence time is usually difficult as the transition state structure is not readily available (2). For the saFabI system, an exact knowledge of this transient structure is not essential. Based on the observed correlation between koff and Ki, considerations of the saFabI-NADP+-inhibitor complex ground state will be sufficient for the rational improvement of both affinity and residence time. We obtained a wealth of structural information explaining the observed residence time and affinity trends. For example, the addition of bulky hydrophobic diphenyl ether 5-substituents or small slightly polar 2′-substituents (e.g. 2′-cyano) lead to a reduced dissociation rate due to a good steric fit within the protein active site (Figures 7 and 8). On the other hand, significant variations in the association rate constants were not observed. Further exploration of diverse A-ring and/or B-ring substituents may provide insight on how to modulate the transition state barrier.
In addition, our data suggest that affinity and residence time in this system can be significantly enhanced by modifications predictable by a careful consideration of catalysis. Utilizing our parameter estimations (Supplementary Table 2), diphenyl ethers have affinities in the low picomolar to low nanomolar range. This is consistent with the expected affinity of transition-state analogues (50). Certainly, the deprotonated diphenyl ether resembles an enolate intermediate (Figure 10). This may explain its preference for binding together with the oxidized product NADP+. One can, therefore, imagine an enolate-like, late transition state as the rate-limiting barrier in catalysis. In such a scenario, the delocalized system of the diphenyl ether imitates the breaking and forming of substrate bonds on the way to the enolate. In addition, the acidity of the phenol induces a partial negative charge at the hydroxyl oxygen similar to the transition state (Figure 10). As further evidence, the relationship between inhibitor affinity and aliphatic chain length at the A-ring 5-position perfectly reflects the relationship between catalytic activity and substrate chain length (Figure 10). Interestingly, the least potent inhibitor of our series, PT51, corresponds to a non-natural substrate smaller than the initial crotonyl-ACP substrate. In this context, the observed opening of a hydrophobic channel for long-chain 5-alkyldiphenyl ethers suggests that the gatekeeper residue Ile207 might also play a critical role for binding of substrates with chain lengths exceeding six carbon atoms (Figure 7). Based on our knowledge of catalysis, we can also predictably increase potency by stabilizing the oxyanion via electron-withdrawing substituents on the A-ring.
Figure 10.

Diphenyl ethers as transition state analogues of saFabI. The plot depicts the relationship between fatty acyl-CoA kcat (black; values obtained from our previous work (14)) and inhibitor affinity, plotted as the reciprocal of Ki (blue), as a function of the carbon chain length. An inhibitor with n carbons at the A-ring 5-position is equivalent to a substrate with n+3 carbon chain length, as depicted on the right. Substrates shorter than 4 carbons in length are catalytically inactive.
Since the diphenyl ethers primarily bind to the E-NADP+ binary complex generated via catalysis, we can predict the evolution of unique kinetic mechanisms of resistance involving mutations away from the inhibitor binding site that accelerate product release. In the case of saFabI, selection experiments have resulted in mutations that do, indeed, lie near the NADP+ binding pocket, particularly I193S (21, 40). We believe that this mutation decreases diphenyl ether inhibition by primarily increasing the rate of NADP+ dissociation. However, these mutations are likely to come at a cost since the interactions involved in product binding are also important for binding the reduced cofactor. Accordingly, this mutant was also shown to drastically increase the Km of the NADPH cofactor (40).
From a thermodynamic perspective, it would seem that there is a disadvantage to having a drug that binds to the enzyme-product complex since enzymes are designed to bind substrates only long enough for catalysis to occur and then release product quickly to allow for additional rounds of catalysis. For this and similar cases of enzyme-product-drug ternary complex inhibition, the focus must be on slowing the dissociation rate of the ternary complex. In the case of saFabI, tighter binding of diphenyl ether transition state analogues corresponds to longer residence times because of minimal perturbations in the kinetic barrier to association. If long residence times correlate with prolonged cellular effects, optimization of residence time may be the key parameter to unlocking in vivo efficacy for these series of metabolically labile compounds (51). In this regard, our rigorously determined SAR will facilitate further optimization of promising drug candidates with high activity against S. aureus. The ultimate hope is that our multipronged strategy will be applied to diverse, complex enzyme systems to achieve a thorough understanding of the interplay between structure, catalysis and the kinetics and thermodynamics of inhibition. We believe it holds great potential to streamline and facilitate the pursuit of rationality in the early stages of the drug discovery process.
Supplementary Material
Acknowledgments
This work was supported in part by the Deutsche Forschungsgemeinschaft (grants SFB630 to C.K. and C.A.S. and Forschungszentrum FZ82 to C.K.) and by the National Institutes of Health (grants GM102864, AI044639 and AI070383 to P.J.T.). A.C. was supported by the Chemical Biology Training Program (NIH grant T32GM092714) and by the Medical Scientist Training Program (NIH grant T32GM008444). J.S. was supported by a grant of the German Excellence Initiative to the Graduate School of Life Sciences, University of Wuerzburg. We thank the staff at the beamline 14.1 (BESSY II) operated by the Helmholtz-Zentrum Berlin and at the ESRF beamlines ID 14-1 and ID 29 for technical support.
Funding Sources: NIH grants GM102864, AI044639, AI070383, T32GM092714 and T32GM008444 Deutsche Forschungsgemeinschaft grants SFB630 and Forschungszentrum FZ82
Abbreviations
- ACP
acyl carrier protein
- CoA
coenzyme A
- FabI
enoyl ACP reductase
- FAS II
type 2 fatty acid biosynthesis
- NAD+
nicotinamide adenine dinucleotide
- NADH
nicotinamide adenine dinucleotide, reduced form
- NADP+
nicotinamide adenine dinucleotide phosphate
- NADPH
nicotinamide adenine dinucleotide phosphate, reduced form
- TCL
triclosan
- tR
residence time
- SAR
structure activity relationship
Footnotes
Supporting Information. Supporting Information Available: 4 supplementary tables and 2 supplementary figures. This material is available free of charge via the Internet at http://pubs.acs.org.
Author Contributions: The manuscript was written through contributions of all authors. All authors have given approval to the final version of the manuscript.
References
- 1.Copeland RA, Pompliano DL, Meek TD. Drug–target residence time and its implications for lead optimization. Nat Rev Drug Discov. 2006;5:730–739. doi: 10.1038/nrd2082. [DOI] [PubMed] [Google Scholar]
- 2.Lu H, Tonge PJ. Drug-target residence time: critical information for lead optimization. Curr Opin Chem Biol. 2010;14:467–474. doi: 10.1016/j.cbpa.2010.06.176. [DOI] [PMC free article] [PubMed] [Google Scholar]
- 3.Zhang R, Monsma F. The importance of drug-target residence time. Curr Opin Drug Disc. 2009;12:488–496. [PubMed] [Google Scholar]
- 4.Lu H, England K, am Ende C, Truglio JJ, Luckner S, Reddy BG, Marlenee NL, Knudson SE, Knudson DL, Bowen RA, Kisker C, Slayden RA, Tonge PJ. Slow-onset inhibition of the FabI enoyl reductase from francisella tularensis: residence time and in vivo activity. ACS Chem Biol. 2009;4:221–231. doi: 10.1021/cb800306y. [DOI] [PMC free article] [PubMed] [Google Scholar]
- 5.Archer GL. Staphylococcus aureus: a well-armed pathogen. Clin Infect Dis. 1998;26:1179–1181. doi: 10.1086/520289. [DOI] [PubMed] [Google Scholar]
- 6.Kluytmans J, van Belkum A, Verbrugh H. Nasal carriage of Staphylococcus aureus: epidemiology, underlying mechanisms, and associated risks. Clin Microbiol Rev. 1997;10:505–520. doi: 10.1128/cmr.10.3.505. [DOI] [PMC free article] [PubMed] [Google Scholar]
- 7.Chambers HF, Deleo FR. Waves of resistance: Staphylococcus aureus in the antibiotic era. Nat Rev Microbiol. 2009;7:629–641. doi: 10.1038/nrmicro2200. [DOI] [PMC free article] [PubMed] [Google Scholar]
- 8.Oliveira DC, Tomasz A, de Lencastre H. Secrets of success of a human pathogen: molecular evolution of pandemic clones of meticillin-resistant Staphylococcus aureus. Lancet Infect Dis. 2002;2:180–189. doi: 10.1016/s1473-3099(02)00227-x. [DOI] [PubMed] [Google Scholar]
- 9.Walsh C. Deconstructing vancomycin. Science. 1999;284:442–443. doi: 10.1126/science.284.5413.442. [DOI] [PubMed] [Google Scholar]
- 10.Weigel LM, Clewell DB, Gill SR, Clark NC, McDougal LK, Flannagan SE, Kolonay JF, Shetty J, Killgore GE, Tenover FC. Genetic analysis of a high-level vancomycin-resistant isolate of Staphylococcus aureus. Science. 2003;302:1569–1571. doi: 10.1126/science.1090956. [DOI] [PubMed] [Google Scholar]
- 11.Brinster S, Lamberet G, Staels B, Trieu-Cuot P, Gruss A, Poyart C. Type II fatty acid synthesis is not a suitable antibiotic target for Gram-positive pathogens. Nature. 2009;458:83–86. doi: 10.1038/nature07772. [DOI] [PubMed] [Google Scholar]
- 12.Balemans W, Lounis N, Gilissen R, Guillemont J, Simmen K, Andries K, Koul A. Essentiality of FASII pathway for Staphylococcus aureus. Nature. 2010;463:83–86. doi: 10.1038/nature08667. [DOI] [PubMed] [Google Scholar]
- 13.Parsons JB, Frank MW, Subramanian C, Saenkham P, Rock CO. Metabolic basis for the differential susceptibility of Gram-positive pathogens to fatty acid synthesis inhibitors. Proc Natl Acad Sci U S A. 2011;108:15378–15383. doi: 10.1073/pnas.1109208108. [DOI] [PMC free article] [PubMed] [Google Scholar]
- 14.Schiebel J, Chang A, Lu H, Baxter MV, Tonge PJ, Kisker C. Staphylococcus aureus FabI: Inhibition, Substrate Recognition, and Potential Implications for In Vivo Essentiality. Structure. 2012;20:802–813. doi: 10.1016/j.str.2012.03.013. [DOI] [PMC free article] [PubMed] [Google Scholar]
- 15.Lu H, Tonge PJ. Inhibitors of FabI, an Enzyme Drug Target in the Bacterial Fatty Acid Biosynthesis Pathway. Accounts Chem Res. 2008;41:11–20. doi: 10.1021/ar700156e. [DOI] [PubMed] [Google Scholar]
- 16.Baldock C, Rafferty JB, Sedelnikova SE, Baker PJ, Stuitje AR, Slabas AR, Hawkes TR, Rice DW. A mechanism of drug action revealed by structural studies of enoyl reductase. Science. 1996;274:2107–2110. doi: 10.1126/science.274.5295.2107. [DOI] [PubMed] [Google Scholar]
- 17.Banerjee A, Dubnau E, Quemard A, Balasubramanian V, Um KS, Wilson T, Collins D, de Lisle G, Jacobs WR., Jr inhA, a gene encoding a target for isoniazid and ethionamide in Mycobacterium tuberculosis. Science. 1994;263:227–230. doi: 10.1126/science.8284673. [DOI] [PubMed] [Google Scholar]
- 18.Levy CW, Roujeinikova A, Sedelnikova S, Baker PJ, Stuitje AR, Slabas AR, Rice DW, Rafferty JB. Molecular basis of triclosan activity. Nature. 1999;398:383–384. doi: 10.1038/18803. [DOI] [PubMed] [Google Scholar]
- 19.Zhang YM, White SW, Rock CO. Inhibiting bacterial fatty acid synthesis. J Biol Chem. 2006;281:17541–17544. doi: 10.1074/jbc.R600004200. [DOI] [PubMed] [Google Scholar]
- 20.Park HS, Yoon YM, Jung SJ, Kim CM, Kim JM, Kwak JH. Antistaphylococcal activities of CG400549, a new bacterial enoyl-acyl carrier protein reductase (FabI) inhibitor. J Antimicrob Chemother. 2007;60:568–574. doi: 10.1093/jac/dkm236. [DOI] [PubMed] [Google Scholar]
- 21.Escaich S, Prouvensier L, Saccomani M, Durant L, Oxoby M, Gerusz V, Moreau F, Vongsouthi V, Maher K, Morrissey I, Soulama-Mouze C. The MUT056399 inhibitor of FabI is a new antistaphylococcal compound. Antimicrob Agents Chemother. 2011;55:4692–4697. doi: 10.1128/AAC.01248-10. [DOI] [PMC free article] [PubMed] [Google Scholar]
- 22.Karlowsky JA, Kaplan N, Hafkin B, Hoban DJ, Zhanel GG. AFN-1252, a FabI inhibitor, demonstrates a Staphylococcus-specific spectrum of activity. Antimicrob Agents Chemother. 2009;53:3544–3548. doi: 10.1128/AAC.00400-09. [DOI] [PMC free article] [PubMed] [Google Scholar]
- 23.Kaplan N, Albert M, Awrey D, Bardouniotis E, Berman J, Clarke T, Dorsey M, Hafkin B, Ramnauth J, Romanov V, Schmid MB, Thalakada R, Yethon J, Pauls HW. AFN-1252 - Mode of action, in vitro activity and in vivo efficacy of a selective anti-staphylococcal FabI inhibitor. Antimicrob Agents Chemother. 2012 doi: 10.1128/AAC.01411-12. [DOI] [PMC free article] [PubMed] [Google Scholar]
- 24.am Ende CW, Knudson SE, Liu N, Childs J, Sullivan TJ, Boyne M, Xu H, Gegina Y, Knudson DL, Johnson F, Peloquin CA, Slayden RA, Tonge PJ. Synthesis and in vitro antimycobacterial activity of B-ring modified diaryl ether InhA inhibitors. Bioorg Med Chem Lett. 2008;18:3029–3033. doi: 10.1016/j.bmcl.2008.04.038. [DOI] [PMC free article] [PubMed] [Google Scholar]
- 25.Sivaraman S, Sullivan TJ, Johnson F, Novichenok P, Cui G, Simmerling C, Tonge PJ. Inhibition of the bacterial enoyl reductase FabI by triclosan: a structure-reactivity analysis of FabI inhibition by triclosan analogues. J Med Chem. 2004;47:509–518. doi: 10.1021/jm030182i. [DOI] [PubMed] [Google Scholar]
- 26.Sullivan TJ, Truglio JJ, Boyne ME, Novichenok P, Zhang X, Stratton CF, Li HJ, Kaur T, Amin A, Johnson F, Slayden RA, Kisker C, Tonge PJ. High affinity InhA inhibitors with activity against drug-resistant strains of Mycobacterium tuberculosis. ACS Chem Biol. 2006;1:43–53. doi: 10.1021/cb0500042. [DOI] [PubMed] [Google Scholar]
- 27.Mueller U, Darowski N, Fuchs MR, Forster R, Hellmig M, Paithankar KS, Puhringer S, Steffien M, Zocher G, Weiss MS. Facilities for macromolecular crystallography at the Helmholtz-Zentrum Berlin. Journal of Synchrotron Radiation. 2012;19:442–449. doi: 10.1107/S0909049512006395. [DOI] [PMC free article] [PubMed] [Google Scholar]
- 28.Leslie AGW. Recent changes to the MOSFLM package for processing film and image plate data. Join CCP4 + ESF-EAMCB Newsletter on Protein Crystallography. 1992;26 [Google Scholar]
- 29.Evans P. Scaling and assessment of data quality. Acta Crystallogr D Biol Crystallogr. 2006;62:72–82. doi: 10.1107/S0907444905036693. [DOI] [PubMed] [Google Scholar]
- 30.Kabsch W. Automatic processing of rotation diffraction data from crystals of initially unknown symmetry and cell constants. J Appl Cryst. 1993;26:795–800. [Google Scholar]
- 31.McCoy AJ, Grosse-Kunstleve RW, Adams PD, Winn MD, Storoni LC, Read RJ. Phaser crystallographic software. Journal of applied crystallography. 2007;40:658–674. doi: 10.1107/S0021889807021206. [DOI] [PMC free article] [PubMed] [Google Scholar]
- 32.Murshudov GN, Vagin AA, Dodson EJ. Refinement of macromolecular structures by the maximum-likelihood method. Acta Crystallogr D Biol Crystallogr. 1997;53:240–255. doi: 10.1107/S0907444996012255. [DOI] [PubMed] [Google Scholar]
- 33.Painter J, Merritt EA. TLSMD web server for the generation of multi-group TLS models. Journal of applied crystallography. 2006;39:109–111. [Google Scholar]
- 34.Emsley P, Cowtan K. Coot: model-building tools for molecular graphics. Acta Crystallogr D Biol Crystallogr. 2004;60:2126–2132. doi: 10.1107/S0907444904019158. [DOI] [PubMed] [Google Scholar]
- 35.Schrodinger LLC. The PyMOL Molecular Graphics System, Version 1.3r1 2010 [Google Scholar]
- 36.Morrison JF, Walsh CT. The behavior and significance of slow-binding enzyme inhibitors. Adv Enzymol Relat Areas Mol Biol. 1988;61:201–301. doi: 10.1002/9780470123072.ch5. [DOI] [PubMed] [Google Scholar]
- 37.Copeland RA, Basavapathruni A, Moyer M, Scott MP. Impact of enzyme concentration and residence time on apparent activity recovery in jump dilution analysis. Anal Biochem. 2011;416:206–210. doi: 10.1016/j.ab.2011.05.029. [DOI] [PubMed] [Google Scholar]
- 38.Wolfram Research I. Mathematica Edition: Version 8.0. Wolfram Research, Inc.; Champaign, Illinois: 2010. [Google Scholar]
- 39.Heath RJ, Li J, Roland GE, Rock CO. Inhibition of the Staphylococcus aureus NADPH-dependent Enoyl-Acyl Carrier Protein Reductase by Triclosan and Hexachlorophene. J Biol Chem. 2000;275:4654–4659. doi: 10.1074/jbc.275.7.4654. [DOI] [PubMed] [Google Scholar]
- 40.Xu H, Sullivan TJ, Sekiguchi Ji, Kirikae T, Ojima I, Stratton CF, Mao W, Rock FL, Alley MRK, Johnson F, Walker S, Tonge PJ. Mechanism and Inhibition of saFabI, the Enoyl Reductase from Staphylococcus aureus. Biochemistry. 2008;47:4228–4236. doi: 10.1021/bi800023a. [DOI] [PMC free article] [PubMed] [Google Scholar]
- 41.Gerusz V, Denis A, Faivre F, Bonvin Y, Oxoby M, Briet S, Lefralliec G, Oliveira C, Desroy N, Raymond C, Peltier L, Moreau F, Escaich S, Vongsouthi V, Floquet S, Drocourt E, Walton A, Prouvensier L, Saccomani M, Durant L, Genevard JM, Sam-Sambo V, Soulama-Mouze C. From Triclosan toward the Clinic: Discovery of Nonbiocidal, Potent FabI Inhibitors for the Treatment of Resistant Bacteria. J Med Chem. 2012;55:9914–9928. doi: 10.1021/jm301113w. [DOI] [PubMed] [Google Scholar]
- 42.Sivaraman S, Zwahlen J, Bell AF, Hedstrom L, Tonge PJ. Structure-activity studies of the inhibition of FabI, the enoyl reductase from Escherichia coli, by triclosan: kinetic analysis of mutant FabIs. Biochemistry. 2003;42:4406–4413. doi: 10.1021/bi0300229. [DOI] [PubMed] [Google Scholar]
- 43.Marcinkeviciene J, Jiang W, Kopcho LM, Locke G, Luo Y, Copeland RA. Enoyl-ACP reductase (FabI) of Haemophilus influenzae: steady-state kinetic mechanism and inhibition by triclosan and hexachlorophene. Arch Biochem Biophys. 2001;390:101–108. doi: 10.1006/abbi.2001.2349. [DOI] [PubMed] [Google Scholar]
- 44.Copeland RA. Conformational adaptation in drug-target interactions and residence time. Future Med Chem. 2011;3:1491–1501. doi: 10.4155/fmc.11.112. [DOI] [PubMed] [Google Scholar]
- 45.Tummino PJ, Copeland RA. Residence Time of Receptor– Ligand Complexes and Its Effect on Biological Function. Biochemistry. 2008;47:8465. doi: 10.1021/bi8002023. [DOI] [PubMed] [Google Scholar]
- 46.Luckner SR, Liu N, am Ende CW, Tonge PJ, Kisker C. A slow, tight binding inhibitor of InhA, the enoyl-acyl carrier protein reductase from Mycobacterium tuberculosis. J Biol Chem. 2010;285:14330–14337. doi: 10.1074/jbc.M109.090373. [DOI] [PMC free article] [PubMed] [Google Scholar]
- 47.Gerusz V. Recent Advances in the Inhibition of Bacterial Fatty Acid Biosynthesis. Annual Reports in Medicinal Chemistry. 2010;45:295–311. [Google Scholar]
- 48.Basavapathruni A, Jin L, Daigle SR, Majer CR, Therkelsen CA, Wigle TJ, Kuntz KW, Chesworth R, Pollock RM, Scott MP, Moyer MP, Richon VM, Copeland RA, Olhava EJ. Conformational adaptation drives potent, selective and durable inhibition of the human protein methyltransferase DOT1L. Chemical biology & drug design. 2012;80:971–980. doi: 10.1111/cbdd.12050. [DOI] [PubMed] [Google Scholar]
- 49.Maschera B, Darby G, Palu G, Wright LL, Tisdale M, Myers R, Blair ED, Furfine ES. Human immunodeficiency virus. Mutations in the viral protease that confer resistance to saquinavir increase the dissociation rate constant of the protease-saquinavir complex. J Biol Chem. 1996;271:33231–33235. doi: 10.1074/jbc.271.52.33231. [DOI] [PubMed] [Google Scholar]
- 50.Schramm VL. Enzymatic transition states, transition-state analogs, dynamics, thermodynamics, and lifetimes. Annu Rev Biochem. 2011;80:703–732. doi: 10.1146/annurev-biochem-061809-100742. [DOI] [PMC free article] [PubMed] [Google Scholar]
- 51.Wang LQ, Falany CN, James MO. Triclosan as a substrate and inhibitor of 3′-phosphoadenosine 5′-phosphosulfate-sulfotransferase and UDP-glucuronosyl transferase in human liver fractions. Drug metabolism and disposition: the biological fate of chemicals. 2004;32:1162–1169. doi: 10.1124/dmd.104.000273. [DOI] [PubMed] [Google Scholar]
Associated Data
This section collects any data citations, data availability statements, or supplementary materials included in this article.