Abstract
We examined the effect on osteoclast formation of disrupting the prostaglandin G/H synthase genes PGHS-1 and-2. Prostaglandin E2 (PGE2) production was significantly reduced in marrow cultures from mice lacking PGHS-2 (PGHS-2–/–) compared with wild-type (PGHS-2+/+) cultures. Osteoclast formation, whether stimulated by 1,25-dihydroxyvitamin D3 (1,25-D) or by parathyroid hormone (PTH), was reduced by 60–70% in PGHS-2–/– cultures relative to wild-type cultures, an effect that could be reversed by providing exogenous PGE2. Cultures from heterozygous mice showed an intermediate response. PGHS inhibitors caused a similar drop in osteoclast formation in wild-type cultures. Co-culture experiments showed that supporting osteoblasts, rather than osteoclast precursors, accounted for the blunted response to 1,25-D and PTH. This lack of response appeared to result from reduced expression of RANK ligand (RANKL) in osteoblasts. We cultured spleen cells with exogenous RANKL and found that osteoclast formation was 50% lower in PGHS-2–/– than in wild-type cultures, apparently because the former cells expressed high levels of GM-CSF. Injection of PTH above the calvaria caused hypercalcemia in wild-type but not PGHS-2–/– mice. Histological examination of bone from 5-week-old PGHS-2–/– mice revealed no abnormalities. Mice lacking PGHS-1 were similar to wild-type mice in all of these parameters. These data suggest that PGHS-2 is not necessary for wild-type bone development but plays a critical role in bone resorption stimulated by 1,25-D and PTH.
Introduction
Prostaglandin G/H synthase (PGHS), also called cyclooxygenase (COX), is the rate-limiting enzyme in the conversion of arachidonic acid released from membranes to prostanoids (1). The 2 enzymes for PGHS are encoded by separate genes and are differentially expressed. PGHS-1 (COX-1) is constitutively expressed; PGHS-2 (COX-2) is an inducible primary-response or immediate early gene (2). PGHS-1 and PGHS-2 may also differentially regulate prostaglandin production by using different substrates (3–5). Under conditions of limiting substrate, PGHS-2 appears to be the primary source of prostaglandin production (6). PGHS-2 is the enzyme that is largely responsible for prostaglandin responses in osteoblasts stimulated by multiple agonists (7).
Mice in which either the PGHS-1 or PGHS-2 gene is disrupted have been engineered (8–10). PGHS-1–deficient (PGHS-1–/–) mice survive normally. PGHS-2–deficient (PGHS-2–/–) mice develop nephropathy that may limit life span. PGHS-2–/– female mice have multiple defects in reproductive processes, including ovulation (absence of corpora lutea), fertilization, implantation, and decidualization, that are not caused by a deficiency of gonadotropins or ovarian hormones (11). The effect of a deficiency in PGHS-1 or PGHS-2 on bone has not yet been examined in these mice.
Bone resorption is a highly regulated process involving interactions of osteoclastic precursors with osteoblasts or stromal cells (12–14). Prostaglandins are potent stimulators of resorption in organ culture (15). Many factors that stimulate prostaglandin production also stimulate resorption in organ culture (16–20). Stimulated osteoclast formation in marrow cultures is frequently found to be prostaglandin dependent (18, 21–31). We have examined the effects on osteoclast formation of disruption of 1 (PGHS-2+/–) or both (PGHS-2–/–) PGHS-2 alleles using different in vitro systems to separate effects on osteoclast support cells and hematopoietic osteoclast precursors. We have also examined effects of disruption of PGHS-1 alleles (PGHS-1–/–).
Methods
Materials.
PGE2 and indomethacin were purchased from Sigma (St. Louis, Missouri, USA). Parathyroid hormone (PTH; bovine 1-34) came from Bachem California (Torrance, California, USA) or Sigma. 1,25-dihydroxyvitamin D3 (1,25-D) was purchased from Biomol Research Laboratories (Plymouth Meeting, Pennsylvania, USA). NS-398 came from Cayman Chemical Co. (Ann Arbor, Michigan, USA). FCS and α-MEM were obtained from GIBCO BRL (McLean, Virginia, USA). Recombinant murine macrophage-CSF (M-CSF), murine granulocyte-macrophage CSF (GM-CSF), and polyclonal GM-CSF antibody were obtained from R&D Systems Inc. (Minneapolis, Minnesota, USA). PGE2 antibody for radioimmunoassay was purchased from Lawrence Levine (Brandeis University, Waltham, Massachusetts, USA). All other chemicals were obtained from Sigma. RANK ligand (RANKL) was kindly provided by Dirk Anderson (Immunex Corp., Seattle, Washington, USA).
Animals.
PGHS-1 and PGHS-2 knockout mice were developed by homologous recombination in embryonic stem cells (8, 10). Because female PGHS-1–/– and PGHS-2–/– females have fertility and parturition problems, PGHS-2–/– mice are produced by crossing heterozygous (+/–) mice. Because PGHS-2+/– mice in a pure C57BL/6 background produce very few PGHS-2–/– offspring, we mated +/– offspring of crosses between C57BL/6+/– and C57BL/6 × 129/sv+/+ to produce –/– mice for PGHS-1 and PGHS-2 studies. Because of genetic variability, we analyzed individual littermates from multiple litters and performed multiple experiments to confirm reproducibility. Mice were genotyped and ears were notched for identification after weaning. Mice were sacrificed at 5–8 weeks of age. All animal protocols were approved by the Animal Care and Use Committees of the University of Connecticut Health Center.
For the PTH injections, 6-week-old C57BL/6 × 129 mice were injected subcutaneously above the right hemicalvaria every 6 hours for 3 days with 0.025 mL of 10 μg of PTH (Bachem California) or vehicle (1 mM HCl with 1 mg/mL BSA). Venous blood was obtained by cavernous sinus puncture. Serum creatinine concentrations were measured by spectrophotometer using a kit from Sigma. Total serum calcium and phosphate were measured in calorimetric assays using kits from Sigma.
Genotyping of mice.
Tail DNA was extracted following a standard protocol, and was analyzed by PCR using primer sequences as described previously (8, 10). The conditions for PCR for PGHS-2 were 1 cycle of 2 minutes at 92°C; and 30 cycles of 30 seconds at 94°C, 30 seconds at 65°C, and 5 minutes at 70°C. For PGHS-1, the PCR conditions were 1 cycle of 2 minutes at 92°C; 3 cycles of 1 minute at 94°C, 1 minute at 58°C, and 10 minutes at 65°C; and 30 cycles of 30 seconds at 94°C, 30 seconds at 60°C, and 5 minutes at 65°C. Products were electrophoresed on a 1% agarose gel in 1× trisborate/EDTA buffer at 100 V.
Primary osteoblastic cells.
Calvariae were excised from 1–4 mice (5–7 weeks of age), dissected free of loose connective tissue, and washed with PBS at pH 7.4. Calvariae were digested with 0.5 mg/mL of crude collagenase P (Roche Molecular Biomedicals Inc., Indianapolis, Indiana, USA) in a solution of 1 mL trypsin/EDTA and 4 mL PBS for 10 minutes at 37°C with gentle rocking. The digestion procedure was repeated to provide 5 populations of cells (fraction 5 was digested for 20 minutes). After each digestion, released cells were removed, and the reaction was stopped with 10% FCS. Cells from populations 2–5 were pooled and then cultured to confluence in 100-mm dishes at 37°C in a humidified atmosphere of 5% CO2, in phenol red–free DMEM with 10% heat-inactivated FCS, 100 U/mL penicillin, and 50 μg/mL streptomycin. Cells were then resuspended and used in coculture experiments or replated in 6-well dishes at 5,000 cells/cm2.
Bone marrow cell cultures.
Tibiae and femurs were aseptically dissected, the bone ends were cut off with scissors, and the marrow was flushed with α-MEM. Collected marrow cells were washed with α-MEM and then plated in α-MEM containing 10% FCS at 106 cells/well in 24-well plates (Corning-Costar Corp., Cambridge, Massachusetts, USA). Cells were cultured for 7 days at 37°C in a humidified atmosphere of 5% CO2. On days 3 and 6, 0.4 mL of the 0.5 mL of medium in each well was replaced with fresh medium. Cultures were treated with 1,25-D (10 nM), PTH (10 nM), or PGE2 (1 μM), added at the beginning of the culture and at each medium change. Osteoclast-like cell (OCL) formation was measured by TRAP+ multinucleated cell formation. At the end of the culture period, cells were washed with PBS and fixed with 2.5% glutaraldehyde for 30 minutes. Cells were stained for TRAP using a leukocyte acid phosphatase A kit (Sigma). The number of TRAP+ MNC per well was counted under a microscope.
Cocultures.
Spleen cells were prepared by macerating spleen tissues with a needle. The spleen cells (106 cells/well) were cocultured with primary calvarial osteoblasts (104 cells/well) in 0.5 mL α-MEM supplemented with 10% FCS in 24-well plates. Cultures were treated with 1,25-D, PTH, or PGE2, and were maintained for 7 days following the same protocol described for bone marrow cultures, except that the media was completely changed at day 3. At the end of the culture period, the cells were stained for TRAP, and TRAP+ MNC per well were counted.
Spleen cell cultures.
Spleen cells were prepared and cultured as described above for 6 days in the presence of RANKL (10 ng/mL) and M-CSF (10 ng/mL).
Pit formation assay.
Marrow cells, cultured as described above for 7 days with 1,25-D or PGE2, were resuspended and allowed to settle onto the surface of devitalized bovine cortical bone slices (4.4 × 4.4 × 0.2 mm) for 90 minutes in PBS. Bone slices were rinsed vigorously and incubated for 24 hours at 37°C in α-MEM (with 0.7 g/L of sodium bicarbonate) and 10% FCS. After incubation, samples were fixed with 2.5% glutaraldehyde in PBS for 30 minutes, cells were stained for TRAP, and bone slices were stained with 1% toluidine blue in 1% borax. The number of resorption pits per bone slice was counted using reflective light microscopy.
RT-PCR.
Total RNA was extracted according to the method of Chomczynski and Sacchi as described previously (32). Total RNA was converted to cDNA by reverse transcriptase (Superscript II; GIBCO BRL) and random hexamer. PCR amplification was done using Taq polymerase (AmpliTaq; Perkin-Elmer Corp., Norwalk, Connecticut, USA) in a thermal cycler (Perkin-Elmer Corp.). After a hot start, temperature cycling was as follows: denaturation at 94°C for 1 minute, primer annealing at 65°C for 1 minute, and extension at 72°C for 2 minutes for 10 cycles. In subsequent cycles, the primer annealing temperature was decreased stepwise by 5°C every 5 cycles. After the last cycle, the mixture was incubated at 72°C for 7 minutes. To verify that amplification was in the linear range, we performed PCR amplification for 27–35 cycles.
PCR primers for murine GAPDH and GM-CSF were purchased from CLONTECH Laboratories Inc. (Palo Alto, California, USA). Primers for murine RANKL (5′-GGGAATTACAAAGTGCACCAG-3′ and 5′-GGTCGGGCAATTCTGAATT-3) were designed from published DNA sequences (33). Amplified products were run on a 1% agarose gel, stained with ethidium bromide, and photographed under UV illumination. Images were analyzed with either ScanAnalysis 2.56 (Biosoft, Cambridge, United Kingdom) or NIH Image 1.61.
PGE2 assay.
Medium was removed from cultured cells and PGE2 levels were measured by radioimmunoassay as described previously (34).
Statistical analysis.
Significant differences among groups within each experiment were determined by ANOVA, followed by post-hoc testing using Bonferroni’s method. When data from multiple experiments were pooled, statistical differences between wild-type and knockout genotypes were determined by Student’s t test.
Results
Phenotype of PGHS-2+/– and PGHS-2–/– mice.
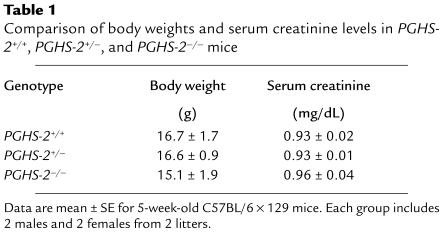
Mice used for in vitro assays were 5–7 weeks of age and appeared healthy and active. There were no significant differences in body weight or serum creatinine between groups (Table 1). Preliminary data on the histology and histomorphometry of 3 PGHS-2+/+ and 3 PGHS-2–/– mice at 5 weeks of age showed no differences in the proximal tibia (data not shown).
Table 1.
Comparison of body weights and serum creatinine levels in PGHS-2+/+, PGHS-2+/–, and PGHS-2–/– mice
Stimulated OCL formation and PGE2 production in marrow cultures.
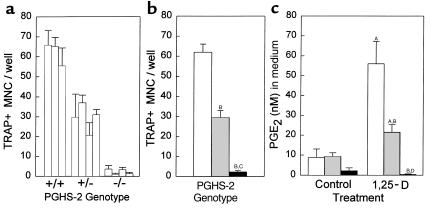
In our initial experiments, we cultured marrow individually from all mice in 2 litters born within a day of each other (Figure 1a). Marrow for each mouse was cultured in 3 replicate wells, and the average number of TRAP+ MNC per well for each mouse was then used to calculate the mean for each treatment group (Figure 1b). There was a 50% reduction in 1,25-D–stimulated (10 nM) TRAP+ MNC formation in PGHS-2+/– cultures, and a 96% reduction in PGHS-2–/– cultures compared with PGHS-2+/+ cultures. Treatment with 1,25-D increased PGE2 in the medium 6-fold in PGHS-2+/+ cultures (Figure 1c). The 1,25-D–stimulated increase in PGE2 was 62% lower in PGHS-2+/– cultures and 99% lower in PGHS-2–/– cultures than in the PGHS-2+/+ cultures. In subsequent experiments, marrow cultures pooled from several mice of the same genotype were compared.
Figure 1.
TRAP+ MNC formation and PGE2 production in 1,25-D–stimulated bone marrow cultures from PGHS-2+/+, PGHS-2+/–, and PGHS-2–/– mice. Cultures were treated for 8 days with vehicle (Control) or 1,25-D (10 nM). (a) Each bar represents the mean ± SE of 3 replicate wells for marrow cultured from 1 mouse and treated with 1,25-D. All mice were from 2 litters born within a day of each other. No TRAP+ MNC were seen in control cultures. (b) The mean (± SE) number of TRAP+ MNC for each genotype was calculated from the mean for individual mice: PGHS-2+/+ (white bar), PGHS-2+/– (gray bar), and PGHS-2–/– (black bar). (c) Medium from 1 well per mouse was taken at the end of the culture period and assayed in duplicate for PGE2. Genotypes are as in b. ASignificant difference from control group; P < 0.01. BSignificant difference from PGHS-2+/+ genotype; P < 0.01. CSignificant difference from PGHS-2+/– phenotype; P < 0.01. DSignificant difference from +/– phenotype; P < 0.05.
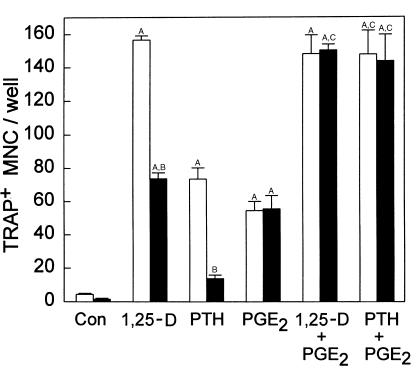
Induction of TRAP+ MNC formation by PTH (10 nM) was similarly reduced in PGHS-2–/– marrow cultures compared with PGHS-2+/+ cultures (Figure 2). In this same experiment, 1,25-D and PTH stimulated 3-fold and 2.5-fold increases, respectively, in PGE2 levels in the medium of PGHS-2+/+ cultures (P < 0.01), but did not increase levels in PGHS-2–/– cultures (data not shown).
Figure 2.
Effects of exogenous PGE2 on TRAP+ MNC formation in bone marrow cultures treated with 1,25-D and PTH. Marrow was pooled from several PGHS-2+/+ mice (white bars) or PGHS-2–/– mice (black bars) and was cultured for 7 days with vehicle (Con), 1,25-D (10 nM), or PTH (10 nM), with and without PGE2 (1 μM). Bars represent mean ± SE for TRAP+ MNC formation in 6 wells. ASignificant difference from control group; P < 0.01. BSignificant difference from comparably treated +/+ genotype; P < 0.01. CSignificant effect of addition of PGE2; P < 0.01.
In 6 separate experiments, the mean reduction (± SE) in 1,25-D–stimulated TRAP+ MNC formation per well in PGHS-2–/– cultures relative to PGHS-2+/+ cultures was 72 ± 9% (P < 0.01). In 3 separate experiments, the mean reduction in 1,25-D–stimulated TRAP+ MNC in PGHS-2+/– cultures relative to PGHS-2+/+ cultures was 51 ± 1% (P < 0.01). In 5 separate experiments, the mean reduction in PTH-stimulated TRAP+ MNC formation in PGHS-2–/– cultures relative to PGHS-2+/+ cultures was 64 ± 5% (P < 0.01).
Treatment with PGE2 (1 μM) stimulated TRAP+ MNC formation in PGHS-2+/+ marrow cultures; this stimulation was not reduced in PGHS-2–/– cultures (Figure 2). There was no reduction in PGE2-stimulated TRAP+ MNC formation in PGHS-2+/– or PGHS –/– cultures in 4 additional experiments. PGE2 (1 μM) added to 1,25-D–stimulated cultures reversed the reduction in TRAP+ MNC formation in PGHS-2–/– cultures (Figure 2). Addition of PGE2 to PTH-stimulated PGHS-2–/– cultures enhanced TRAP+ MNC formation in PGHS-2+/+ cultures and eliminated differences between the wild-type and PGH-2–deficient cultures.
Effect of PGHS-1 deficiency on stimulated OCL formation in marrow cultures.
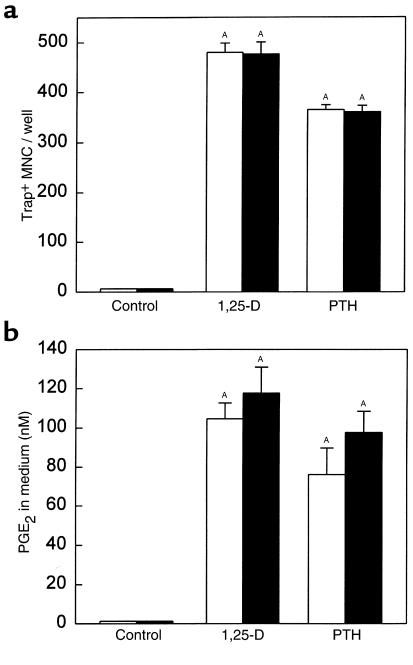
There was no reduction in 1,25-D– or PTH-stimulated TRAP+ MNC formation in marrow cultures from PGHS-1–/– mice compared with PGHS-1+/+ cultures (Figure 3a). In addition, there was no reduction in 1,25-D– or PTH-stimulated PGE2 production in PGHS-1–/– cultures (Figure 3b).
Figure 3.
Effect of PGHS-1 gene disruption on TRAP+ MNC formation and PGE2 production in marrow culture. Marrow from PGHS-1 knockout mice (black bars) or from wild-type littermates (white bars) was cultured with vehicle (Control) or 1,25-D (10 nM) for 7 days. (a) Bars represent mean ± SE for TRAP+ MNC in 4 wells. (b) Bars represent mean ± SE for medium PGE2 produced during the last 2 days of culture in 4 wells. ASignificant difference from control group; P < 0.01.
Effects of nonsteroidal anti-inflammatory drugs (NSAIDs) on stimulated OCL formation in marrow cultures.
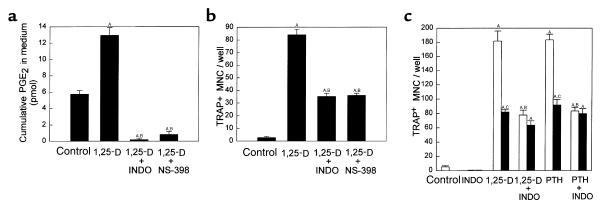
To assess further the relative roles of PGHS-2 and PGHS-1 in stimulated OCL formation in marrow cultures, we compared PGHS-2+/+ marrow cultures treated with 0.1 μM indomethacin, which inhibits both PGHS-1 and PGHS-2 activity, and cultures treated with NS-398 (0.1 μM), a selective inhibitor of PGHS-2 in osteoblastic cells (35). Both NSAIDs inhibited PGE2 production in 1,25-D–stimulated marrow cultures (Figure 4a) and decreased TRAP+ MNC formation by 60–65% (Figure 4b). We also examined the effects of indomethacin on 1,25-D– or PTH-stimulated PGHS-2+/+ and PGHS-2–/– marrow cultures to determine if the residual stimulated OCL formation in PGHS-2–/– cultures could be reduced by inhibiting PGHS-1 activity (Figure 4c). Treatment with indomethacin caused no additional reduction in OCL formation in PGHS-2–/– cultures (Figure 4c).
Figure 4.
Effect of inhibitors of PGHS-1 and PGHS-2 activity on TRAP+ MNC formation in bone marrow cultures. Marrow was cultured for 7 days with vehicle (Con), 1,25-D (10 nM), or PTH (10 nM) in the presence or absence of either 0.1 μM indomethacin (INDO; an inhibitor of both PGHS-1 and PGHS-2 activity) or 0.1 μM NS-398, a selective inhibitor of PGHS-2 activity. Bars represent mean ± SE of 4 wells. Comparison of 1,25-D–stimulated cumulative PGE2 (a) and TRAP+ MNC formation (b) in PGHS-2+/+ cultures. (c) Comparison of 1,25-D– and PTH-stimulated TRAP+ MNC formation, with and without indomethacin, in PGHS-2+/+ cultures (white bars) and PGHS-2–/– cultures (black bars). ASignificant difference from control group; P < 0.01. BSignificant effect of inhibitor; P < 0.01. CSignificant difference from +/+ genotype; P < 0.01.
Effects of PGHS-2 deficiency on pit formation.
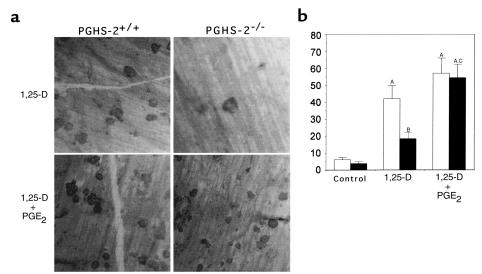
We assessed the ability of OCL formed in marrow cultures to form resorption pits on cortical bone slices (Figure 5). 1,25-D stimulated an 8-fold increase in the number of pits formed by marrow cells from PGHS-2+/+ mice. 1,25-D–stimulated pit formation was reduced by 60% in marrow cultured from PGHS-2–/– mice; this reduction was reversed by treatment with PGE2. There was no difference in pit area among groups (data not shown).
Figure 5.
Formation of resorption pits on cortical bone slices by cultured marrow cells from PGHS-2+/+ mice (white bars) and PGHS-2–/– mice (black bars). Cultures were treated with either vehicle (Control) or 1,25-D (10 nM) with and without PGE2 (1 μM). An osteoclast resorption pit was defined as having multiple overlapping resorption lacunae. (a) Photomicrograph of resorption pits on cortical bone. (b) Number of resorption pits counted on 6 bone slices (mean ± SE). ASignificant difference from control group; P < 0.01. BSignificant difference from 1,25-D–treated PGHS-2+/+ cells; P < 0.05. CSignificant effect of addition of PGE2; P < 0.01.
Stimulated OCL formation in cocultures of spleen and osteoblastic cells.
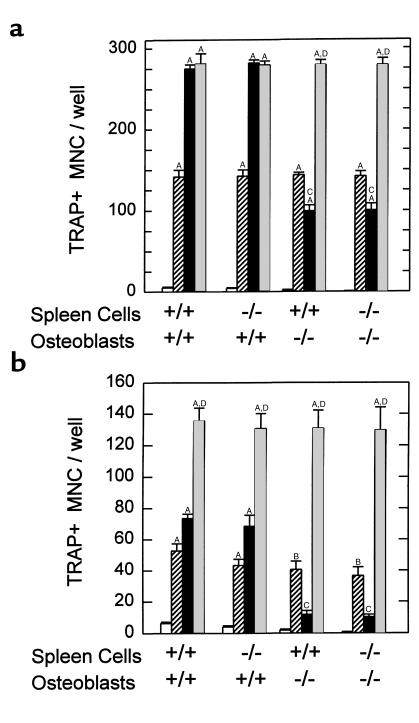
We cocultured PGHS-2+/+ and PGHS-2–/– spleen cells (as a source of osteoclastic precursors) with primary osteoblasts derived from calvariae of PGHS-2+/+ and PGHS-2–/– mice. 1,25-D– and PTH-stimulated (Figures 6a and 6b, respectively) TRAP+ MNC formation was reduced 65% and 80%, respectively, in cocultures of PGHS-2–/– osteoblasts with either PGHS-2+/+ or PGHS-2–/– spleen cells. Stimulated OCL formation was not inhibited when PGHS-2–/– spleen cells were cultured with PGHS-2+/+ osteoblasts. Addition of PGE2 reversed the inhibition of TRAP+ MNC formation in cocultures with PGHS-2–/– osteoblasts. The effect of PGE2 on TRAP+ MNC formation was additive to the effect of PTH in cocultures with PGHS-2+/+ osteoblasts. Similar results were seen in 2 more experiments with PTH, and in a second experiment with 1,25-D.
Figure 6.
TRAP+ MNC formation in cocultures of spleen cells and primary osteoblasts from PGHS-2+/+ and PGHS-2–/– mice. Osteoblasts were pooled from 4 populations from sequentially digested calvariae. Cocultures were treated with 1,25-D (10 nM) or PTH (10 nM), with or without PGE2 (1 μM) for 7 days and then stained for TRAP. Bars represent mean ± SE of quadruplicate cultures. (a) Cultures were treated with vehicle (open bars), PGE2 (striped bars), 1,25-D (black bars), or 1,25-D + PGE2 (gray bars). (b) Cultures were treated with vehicle (open bars), PGE2 (striped bars), PTH (black bars), or PTH + PGE2 (gray bars). ASignificant difference from vehicle treatment; P < 0.01. BSignificant difference from vehicle treatment; P < 0.05. CSignificant effect of PGHS-2–/– osteoblasts; P < 0.01. DSignificant difference from treatment with either agent alone; P < 0.01.
Injection of PTH over the calvaria.
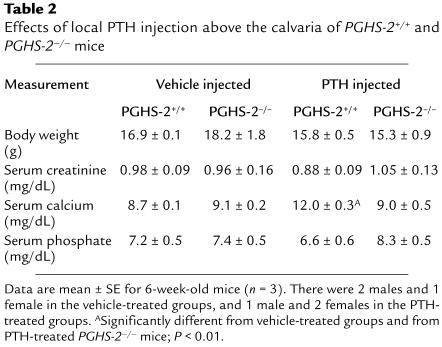
To determine if there were in vivo consequences of the differences in OCL formation seen in vitro, we examined the ability of PTH injected subcutaneously above the calvaria to raise serum calcium levels in PGHS-2+/+ and PGHS-2–/– mice. Following an established model (36, 37), 6-week-old mice (3 in each group) were injected 4 times a day for 3 days above the right hemicalvaria with 10 μg of PTH or vehicle. Serum was obtained 2 hours after the last injection. There was no significant difference in body weight, serum creatinine, or serum phosphate among the groups (Table 2). There was no difference between serum calcium levels in PGHS-2+/+ and PGHS-2–/– mice injected with vehicle. PTH injection produced marked hypercalcemia in the PGHS-2+/+ mice but did not elevate serum calcium in the PGHS-2–/– mice (Table 2).
Table 2.
Effects of local PTH injection above the calvaria of PGHS-2+/+ and PGHS-2–/– mice
Regulation of RANKL mRNA expression in osteoblasts.
Because stimulation of RANKL expression in osteoblasts has been shown to be essential for resorption induced by 1,25-D, PTH, and PGE2 (38–41), we examined the stimulation of RANKL expression in PGHS-2+/+ and PGHS-2–/– cultures. We measured RANKL mRNA levels in 3 separate experiments by RT-PCR in primary calvarial osteoblast cultures grown to confluence and treated for 24 hours with 1,25-D and PTH. 1,25-D–stimulated RANKL mRNA levels were reduced 47 ± 2% (P < 0.01) in PGHS-2–/– cultures compared with PGHS-2+/+ cultures (data not shown). PTH-stimulated RANKL mRNA levels were reduced 56 ± 8% (P < 0.01) in PGHS-2–/– cultures compared with PGHS-2+/+ cultures (data not shown).
OCL formation in RANKL and M-CSF–treated spleen cell cultures.
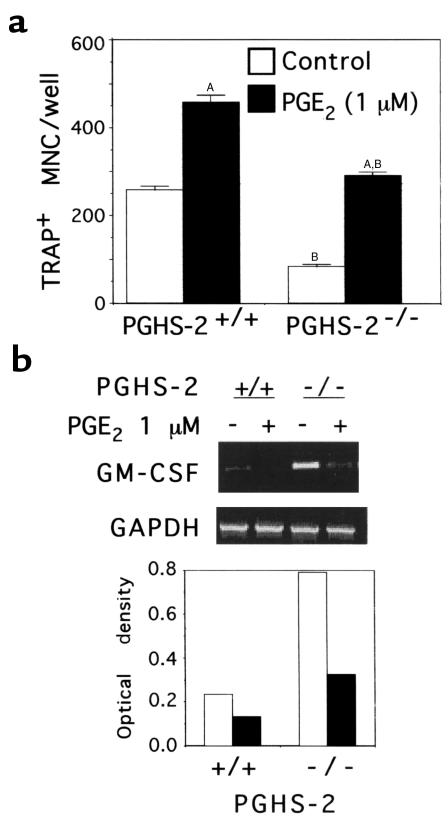
To examine the effects of PGHS-2 deficiency on differentiation of osteoclast precursors without using osteoblastic cells, we used spleen cell cultures treated with RANKL (10 ng/mL) and M-CSF (10 ng/mL) (42, 43). We were unable to detect mRNA for RANKL by RT-PCR in these spleen cell cultures, indicating that few stromal or osteoblastic cells were present (data not shown). There were 2- to 3-fold more TRAP+ MNCs in PGHS-2+/+ cultures than in PGHS-2–/– cultures (Figures 7 and 9). In contrast, we found no difference in OCL formation in spleen cell cultures from PGHS-1–/– mice compared with PGHS-1+/+ cultures (data not shown).
Figure 7.
Effect of disruption of the PGHS-2 gene on TRAP+ MNC formation and GM-CSF mRNA expression in spleen cells cultured without osteoblasts. Cultures were treated with M-CSF (10 ng/mL) and RANKL (10 ng/mL), and then with either vehicle (Control; white bars) or PGE2 (1 μM; black bars). (a) TRAP+ MNC formed after 6 days of culture. Data are expressed as mean ± SE for quadruplicate cultures. (No TRAP+ MNC were formed in cultures without RANKL and M-CSF; data not shown.) ASignificant difference from vehicle treatment; P < 0.01. BSignificant effect of PGHS-2–/– genotype; P < 0.01. (b) RT-PCR analysis of GM-CSF mRNA levels at the end of the culture period for the experiment shown in a. Ethidium bromide–stained RT-PCR products are shown in the top panel. The optical density ratios of GM-CSF mRNA to GAPDH mRNA are shown in the bottom panel.
Figure 9.
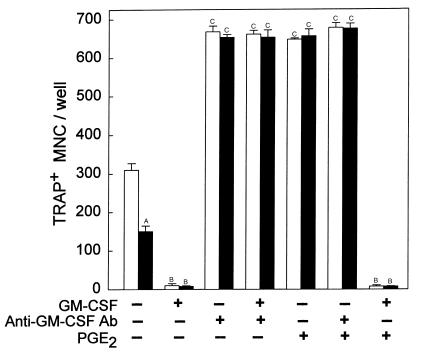
Effects of GM-CSF and a blocking antibody to GM-CSF on TRAP+ MNC formation in RANKL- and M-CSF–stimulated spleen cell cultures. Spleen cells from PGHS-2+/+ (white bars) and PGHS-2–/– (black bars) mice were cultured for 6 days with RANKL (10 ng/mL) and M-CSF (10 ng/mL). Cultures were also treated with vehicle (Control), murine GM-CSF (1 ng/mL), murine polyclonal antibody to GM-CSF (1 μg/mL), or PGE2 (1 μM). Bars represent mean ± SE for quadruplicate cultures. ASignificant effect of –/– genotype; P < 0.01. BSignificant effect of GM-CSF; P < 0.01. CSignificant effect of anti–GM-CSF antibody or PGE2; P < 0.01.
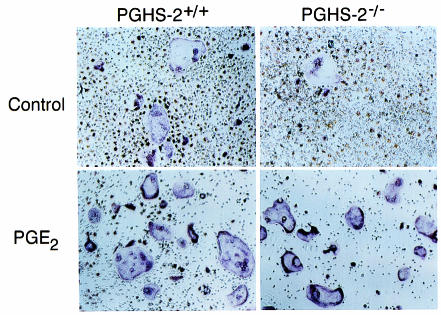
In multiple experiments, we found no TRAP+ MNC formed in the absence of RANKL and M-CSF. As reported previously (44), addition of PGE2 (1 μM) to cultures treated with RANKL and M-CSF increased TRAP+ MNC formation (Figures 7 and 8). In the experiment shown in Figure 7, treatment of PGHS-2–/– spleen cells with PGE2 did not completely reverse the deficit in TRAP+ MNC formation that was observed in PGHS-2–/– cultures compared with PGE2-treated PGHS-2+/+ cultures. In 2 similar experiments, however, there was a complete reversal of this deficit (Figure 9). PGE2 did not stimulate TRAP+ MNC formation in cultures without RANKL and M-CSF (data not shown). As seen previously (44), addition of PGE2 to spleen cell cultures decreased the total number of cells present at the end of the culture period (Figure 8).
Figure 8.
Effect of PGE2 on RANKL- and M-CSF-stimulated spleen cell cultures. RANKL-stimulated (10 ng/mL) and M-CSF–stimulated (10 ng/mL) spleen cells from PGHS-2+/+ and PGHS-2–/– mice were treated for 6 days with vehicle (Control) or PGE2 (1 μM) and then stained for TRAP.
PGE2 levels in medium were barely detectable by our radioimmunoassay for PGE2 (lower limit 0.1 nM) in both PGHS-2+/+ and PGHS-2–/– spleen cell cultures (data not shown). This observation is consistent with the absence of osteoblasts and other stromal cells in these cultures. Treatment with indomethacin (0.1 μM) to block prostaglandin production throughout the culture period did not inhibit OCL formation (data not shown).
Regulation of GM-CSF in RANKL- and M-CSF–treated spleen cell cultures.
Because GM-CSF has been shown to inhibit murine osteoclastogenesis (45, 46), we measured GM-CSF mRNA levels by RT-PCR in the spleen cell cultures. In the experiment shown in Figure 7, the GM-CSF mRNA level was increased 3.5-fold in PGHS-2–/– spleen cells compared with PGHS-2+/+ cells, and the number of TRAP+ MNC was 3.2-fold higher in PGHS-2+/+ cultures than in PGHS-2–/– cultures. In a second and similar experiment, there was a 2-fold increase in GM-CSF mRNA levels in PGHS-2–/– spleen cell cultures compared with PGHS-2+/+ cultures, and the number of TRAP+ MNC was 2-fold higher in PGHS-2+/+ cultures than in PGHS-2–/– cultures (data not shown). Addition of PGE2 (1 μM) decreased GM-CSF mRNA levels in both PGHS-2+/+ and PGHS-2–/– cultures (Figure 7).
If the decrease in TRAP+ MNC formation in PGHS-2–/– spleen cell cultures relative to PGHS-2+/+ cultures is due to increased GM-CSF production, then a blocking antibody to GM-CSF should increase TRAP+ MNC formation in PGHS-2–/– spleen cell cultures and eliminate differences between PGHS-2–/– and PGHS-2+/+ cultures. Murine GM-CSF (1 ng/mL) inhibited TRAP+ MNC formation by 90% in RANKL- and M-CSF–stimulated PGHS-2+/+ and PGHS-2–/– spleen cell cultures (Figure 9). Polyclonal antibody to murine GM-CSF at a concentration of 0.1 μg/mL blocked the GM-CSF inhibition of TRAP+ MNC formation in spleen cell culture, and at higher doses (1.0–10 μg/mL) the antibody increased TRAP+ MNC formation 2-fold, with maximal effects at 1 μg/mL (data not shown). Addition of 1.0 μg/mL anti–GM-CSF antibody to PGHS-2+/+ and PGHS-2–/– spleen cell cultures reversed the inhibitory effects of GM-CSF and enhanced OCL formation to similar levels in both PGHS-2+/+ and PGHS-2–/– cultures (Figure 9). PGE2 alone enhanced OCL formation to a level similar to that induced by the antibody in both PGHS-2+/+ and PGHS-2–/– cultures. PGE2 did not add further to the antibody effect, and could not overcome the inhibitory effect of added GM-CSF.
Discussion
Prostaglandins of the E series are potent stimulators of bone resorption in organ culture, and PGE1 and PGE2 (but not PGF2α) stimulate osteoclast formation in marrow cultures (47, 48). Agonists reported to stimulate prostaglandin-dependent OCL formation include IL-1 (18, 22, 23), TNF-α (23), PTH (24, 25), 1,25-D (26), IL-11 (27, 28), IL-6 (21), IL-17 (31), phorbol ester (29), and FGF-2 (30). Our results support the conclusion of these earlier studies that prostaglandins play an important role in the response of bone-to-bone resorbing factors, and demonstrate that the critical prostaglandins are produced by PGHS-2. The lack of effect of disrupting PGHS-1 gene expression is consistent with other studies in which stimulated PGE2 responses are associated with PGHS-2 induction (7). However, disruption of PGHS-2 or treatment with NSAIDs only partially blocked PTH- or 1,25-D–stimulated OCL formation in marrow cultures. Therefore, endogenous prostaglandins enhance, but are not required for, PTH- and 1,25-D–stimulated OCL formation. Addition of PGE2 enhanced the effect of PTH but not 1,25-D in PGHS-2+/+ cultures, suggesting that endogenous prostaglandins are sufficient to maximize 1,25-D– but not PTH-stimulated OCL formation in these cultures.
Despite the dependence of PTH- or 1,25-D–stimulated OCL formation on prostaglandin production, we have not found PTH-stimulated (49) or 1,25-D-stimulated (50) resorption in organ culture to be inhibited by indomethacin. This lack of dependence on prostaglandins is not due to lack of PGHS-2 induction or endogenous prostaglandin production (51). Perhaps stimulated resorption in organ culture reflects differentiation or activation of a pool of available osteoclastic precursors, and the prostaglandin enhancement of stimulated OCL formation in marrow culture reflects increased formation of new osteoclastic precursors.
Formation of bone-resorbing OCLs requires a contact-dependent interaction between osteoclast precursor cells and stromal or osteoblastic cells (12–14). The molecule mediating this interaction was originally cloned as (RANKL) (33), and was found to be identical to TNF-related activation-induced cytokine (TRANCE) (52). Subsequently, TRANCE/RANKL was found to be identical to osteoclast differentiating factor and to be a ligand for osteoprotegerin (a decoy receptor for RANKL) and is therefore also called ODF or OPGL (38). Induction of RANKL is essential for resorption by 1,25-D, PTH, and PGE2 (38–41). Our data suggest that PTH- and 1,25-D–stimulated RANKL mRNA expression in osteoclastic support cells is decreased 50–60% in the absence of PGHS-2 expression; this reduction could explain the majority of the decrease in stimulated OCL formation in PGHS-2–/– marrow cultures compared with PGHS-2+/+ marrow cultures.
A recent study showed that PGE2 enhances RANKL-stimulated OCL formation in spleen cell cultures, supporting a role for a direct effect of prostaglandins on hematopoietic precursors of osteoclasts (44). Our data support these observations. In addition, we showed a reduction in RANKL- and M-CSF–stimulated OCL formation in spleen cell cultures from PGHS-2–/– mice. This reduction was not reversed by indomethacin, and hence cannot be attributed to a difference in PGE2 production in spleen cell cultures. We suggest that in vivo, prostaglandins modulate the size of the pool of osteoclastic progenitors that are readily available to differentiate in response to stimulators, and that in vitro, in the absence of endogenously produced prostaglandins, these differences are maintained. However, these differences can be overcome by treatment of the spleen cell cultures with exogenous prostaglandins, or the production of prostaglandins by osteoblasts in spleen-osteoblast cocultures.
Our results in spleen cell cultures treated with RANKL and M-CSF suggest that decreased OCL formation in PGHS-2–/– spleen cell cultures relative to PGHS-2+/+ cultures is due to increased GM-CSF expression. Several previous studies have found that prostaglandins or cAMP analogues downregulate the expression of GM-CSF in marrow stromal cells and lymphocytes (53–55). However, there are conflicting reports on the effects of GM-CSF on osteoclastogenesis in marrow cultures and cocultures. GM-CSF has been found to increase OCL formation in human and primate bone marrow cultures (56, 57) and in some rodent cultures (58–60). On the other hand, there are many studies in murine marrow cultures and coculture systems showing that GM-CSF inhibits OCL formation (45, 46, 61–63), and it has been proposed that GM-CSF inhibits OCL formation by inhibiting expression of integrin αvβ5 (64). Although GM-CSF knockout mice have been found to have abnormalities in granulopoiesis, resistance to infection, and pulmonary physiology (65, 66), we found no reports of abnormal bone histology.
The association of increased GM-CSF expression with decreased OCL formation that was seen in the spleen cell cultures could not be generalized to account for the effect of PGHS-2 deficiency on OCL formation in marrow cultures and cocultures of osteoblasts and spleen cells. Addition of GM-CSF to 1,25-D–stimulated PGHS-2+/+ and PGHS-2–/– marrow cultures or to PTH-stimulated PGHS-2+/+ and PGHS-2–/– osteoblast/spleen cocultures completely inhibited OCL formation, but the blocking antibody to GM-CSF had no effect on OCL formation in the absence of exogenous GM-CSF (data not shown). In addition, we were not able to detect GM-CSF mRNA by RT-PCR in marrow cultures from PGHS-2+/+ or PGHS-2–/– mice (data not shown).
Because prostaglandins produced by PGHS-2 are critical for obtaining maximal OCL responses to 1,25-D and PTH, an in vivo role for prostaglandins in bone resorption may be most apparent during high bone turnover. Subcutaneous injection of PTH above the calvaria has been shown to increase resorption locally and to cause hypercalcemia in mice (36, 37). PGHS-2+/+ mice subjected to this protocol became hypercalcemic as expected, but PGHS-2–/– mice did not. These studies suggest that the in vivo bone resorption response to high-dose PTH is blunted in PGHS-2–/– mice. Although PGHS-2 deficiency did not result in differences in histologic phenotype or differences in serum calcium levels under conditions of unstimulated turnover, the effect of PGHS-2 deficiency on the resorption response to high-dose PTH suggests that a histologic phenotype may become evident when bone resorption is increased, such as occurs after estrogen withdrawl. Although PGHS-2–/– mice may develop renal nephropathy, PGHS-2+/– mice remain healthy with age, and have been used to demonstrate effects of reduced PGHS-2 expression in vivo on the incidence of intestinal polyposis (67). In our study, PGE2 production and OCL formation in PGHS-2+/– cultures were each intermediate between that found in PGHS-2+/+ and PGHS-2–/– cultures, suggesting that PGHS-2+/– mice will be useful for studying the effects of PGHS-2 reduction on bone metabolism in vivo.
Histological examination of bone from 5-week-old PGHS-2–/– mice revealed no skeletal abnormalities, which suggests that PGHS-2 is not necessary for normal bone development. However, the effects of PGHS-2 expression on bone cells can be replaced by exogenous prostaglandins, and maternally produced prostaglandins could play a role in fetal skeletal development.
Acknowledgments
We thank Cindy Alander and Olga Voznesensky for excellent technical help, Eric Mallico for breeding the PGHS knockout animals, B.F. Boyce and Weiguang Zhao for advice on the in vivo PTH injections, and H. Kronenberg and A.M. Flanagan for thoughtful discussions. We are grateful to Dirk Anderson for his gift of osteoclast differentiating factor. This work was supported by National Institutes of Health grants DK-48361 (to C. Pilbeam) and AM-18063 (to L. Raisz).
Footnotes
This work was presented in part at the 21st annual meeting of the American Society for Bone and Mineral Research, St. Louis, Missouri, USA. October 3, 1999.
References
- 1.Smith WL, Garavito RM, DeWitt DL. Prostaglandin endoperoxide H synthases (cyclooxygenases)-1 and -2. J Biol Chem. 1996;271:29569–29575. doi: 10.1074/jbc.271.52.33157. [DOI] [PubMed] [Google Scholar]
- 2.Kujubu DA, Fletcher BS, Varnum BC, Lim RW, Herschman HR. TIS10, a phorbol ester tumor promoter-inducible mRNA from Swiss 3T3 cells, encodes a novel prostaglandin synthase/cyclooxygenase homologue. J Biol Chem. 1991;266:12866–12872. [PubMed] [Google Scholar]
- 3.Reddy ST, Herschman HR. Transcellular prostaglandin production following mast cell activation is mediated by proximal secretory phospholipase A2 and distal prostaglandin synthase 1. J Biol Chem. 1996;271:186–191. doi: 10.1074/jbc.271.1.186. [DOI] [PubMed] [Google Scholar]
- 4.Reddy ST, Herschman HR. Prostaglandin synthase-1 and prostaglandin synthase-2 are coupled to distinct phospholipases for the generation of prostaglandin D2 in activated mast cells. J Biol Chem. 1997;272:3231–3237. doi: 10.1074/jbc.272.6.3231. [DOI] [PubMed] [Google Scholar]
- 5.Chulada PC, Langenbach R. Differential inhibition of murine prostaglandin synthase-1 and -2 by nonsteroidal anti-inflammatory drugs using exogenous and endogenous sources of arachidonic acid. J Pharmacol Exp Ther. 1997;280:606–613. [PubMed] [Google Scholar]
- 6.Swinney DC, Mak AY, Barnett J, Ramesha CS. Differential allosteric regulation of prostaglandin H synthase 1 and 2 by arachidonic acid. J Biol Chem. 1997;272:12393–12398. doi: 10.1074/jbc.272.19.12393. [DOI] [PubMed] [Google Scholar]
- 7.Pilbeam, C.C., Harrison, J.R., and Raisz, L.G. 1996. Prostaglandins and bone metabolism. In Principles of bone biology. J.P. Bilezikian, L.G. Raisz, and G.A. Rodan, editors. Academic Press. New York, NY. 715–728.
- 8.Morham SG, et al. Prostaglandin synthase 2 gene disruption causes severe renal pathology in the mouse. Cell. 1995;83:473–482. doi: 10.1016/0092-8674(95)90125-6. [DOI] [PubMed] [Google Scholar]
- 9.Dinchuk JE, et al. Renal abnormalities and an altered inflammatory response in mice lacking cyclooxygenase II. Nature. 1995;378:406–409. doi: 10.1038/378406a0. [DOI] [PubMed] [Google Scholar]
- 10.Langenbach R, et al. Prostaglandin synthase 1 gene disruption in mice reduces arachidonic acid-induced inflammation and indomethacin-induced gastric ulceration. Cell. 1995;83:483–492. doi: 10.1016/0092-8674(95)90126-4. [DOI] [PubMed] [Google Scholar]
- 11.Lim H, et al. Multiple female reproductive failures in cyclooxygenase 2-deficient mice. Cell. 1997;91:197–208. doi: 10.1016/s0092-8674(00)80402-x. [DOI] [PubMed] [Google Scholar]
- 12.Martin T, Udagawa N. Hormonal regulation of osteoclast function. Trends Endocrinol Metab. 1998;9:6–12. doi: 10.1016/s1043-2760(98)00005-8. [DOI] [PubMed] [Google Scholar]
- 13.Reddy SV, Roodman GD. Control of osteoclast differentiation. Crit Rev Eukaryot Gene Expr. 1998;8:1–17. doi: 10.1615/critreveukargeneexpr.v8.i1.10. [DOI] [PubMed] [Google Scholar]
- 14.Suda T, et al. Modulation of osteoclast differentiation and function by the new members of the tumor necrosis factor receptor and ligand families. Endocr Rev. 1999;20:345–357. doi: 10.1210/edrv.20.3.0367. [DOI] [PubMed] [Google Scholar]
- 15.Klein DC, Raisz LG. Prostaglandins: stimulation of bone resorption in tissue culture. Endocrinology. 1970;86:1436–1440. doi: 10.1210/endo-86-6-1436. [DOI] [PubMed] [Google Scholar]
- 16.Tashjian AHJ, Hohmann EL, Antoniades HN, Levine L. Platelet-derived growth factor stimulates bone resorption via a prostaglandin-mediated mechanism. Endocrinology. 1982;111:118–124. doi: 10.1210/endo-111-1-118. [DOI] [PubMed] [Google Scholar]
- 17.Sato K, et al. Stimulation of prostaglandin E2 and bone resorption by recombinant human interleukin 1α in fetal long bone. Biochem Biophys Res Commun. 1986;138:618–624. doi: 10.1016/s0006-291x(86)80541-1. [DOI] [PubMed] [Google Scholar]
- 18.Akatsu T, et al. Role of prostaglandins in interleukin-1-induced bone resorption in mice in vitro. J Bone Miner Res. 1991;6:183–189. doi: 10.1002/jbmr.5650060212. [DOI] [PubMed] [Google Scholar]
- 19.Stern PH, et al. Human transforming growth factor-alpha stimulates bone resorption in vitro. J Clin Invest. 1985;76:2016–2019. doi: 10.1172/JCI112202. [DOI] [PMC free article] [PubMed] [Google Scholar]
- 20.Tashjian AH, et al. Tumor necrosis factor-α (cachectin) stimulates bone resorption in mouse calvaria via a prostaglandin-mediated mechanism . Endocrinology. 1987;120:2029–2036. doi: 10.1210/endo-120-5-2029. [DOI] [PubMed] [Google Scholar]
- 21.Tai H, et al. Transcriptional induction of cyclooxygenase-2 in osteoblasts is involved in interleukin-6-induced osteoclast formation. Endocrinology. 1997;138:2372–2379. doi: 10.1210/endo.138.6.5192. [DOI] [PubMed] [Google Scholar]
- 22.Sato T, et al. Involvement of prostaglandin endoperoxide H synthase-2 in osteoclast-like cell formation induced by interleukin-1β. J Bone Miner Res. 1996;11:392–400. doi: 10.1002/jbmr.5650110313. [DOI] [PubMed] [Google Scholar]
- 23.Lader CS, Flanagan AM. Prostaglandin E2, interleukin 1α, and tumor necrosis factor-α increase human osteoclast formation and bone resorption in vitro. Endocrinology. 1998;139:3157–3164. doi: 10.1210/endo.139.7.6085. [DOI] [PubMed] [Google Scholar]
- 24.Inoue H, Tanaka N, Uchiyama C. Parathyroid hormone increases the number of tartrate-resistant acid phosphatase-positive cells through prostaglandin E2 synthesis in adherent cell culture of neonatal rat bones. Endocrinology. 1995;136:3648–3656. doi: 10.1210/endo.136.8.7628405. [DOI] [PubMed] [Google Scholar]
- 25.Sato T, Morita I, Murota S. Prostaglandin E2 mediates parathyroid hormone induced osteoclast formation by cyclic AMP independent mechanism. Adv Exp Med Biol. 1997;407:383–386. doi: 10.1007/978-1-4899-1813-0_57. [DOI] [PubMed] [Google Scholar]
- 26.Collins DA, Chambers TJ. Prostaglandin E2 promotes osteoclast formation in murine hematopoietic cultures through an action on hematopoietic cells. J Bone Miner Res. 1992;7:555–561. doi: 10.1002/jbmr.5650070512. [DOI] [PubMed] [Google Scholar]
- 27.Girasole G, Passeri G, Jilka RL, Manolagas SC. Interleukin-11: a new cytokine critical for osteoclast development. J Clin Invest. 1994;93:1516–1524. doi: 10.1172/JCI117130. [DOI] [PMC free article] [PubMed] [Google Scholar]
- 28.Morinaga Y, Fujita N, Ohishi K, Zhang Y, Tsuruo T. Suppression of interleukin-11-mediated bone resorption by cyclooxygenases inhibitors. J Cell Physiol. 1998;175:247–254. doi: 10.1002/(SICI)1097-4652(199806)175:3<247::AID-JCP2>3.0.CO;2-O. [DOI] [PubMed] [Google Scholar]
- 29.Amano S, et al. Phorbol myristate acetate stimulates osteoclast formation in 1α,25-dihydroxyvitamin D3-primed mouse embryonic calvarial cells by a prostaglandin-dependent mechanism. J Bone Miner Res. 1994;9:465–472. doi: 10.1002/jbmr.5650090405. [DOI] [PubMed] [Google Scholar]
- 30.Hurley MM, Lee SK, Raisz LG, Bernecker P, Lorenzo J. Basic fibroblast growth factor induces osteoclast formation in murine bone marrow cultures. Bone. 1998;22:309–316. doi: 10.1016/s8756-3282(97)00292-5. [DOI] [PubMed] [Google Scholar]
- 31.Kotake S, et al. IL-17 in synovial fluids from patients with rheumatoid arthritis is a potent stimulator of osteoclastogenesis. J Clin Invest. 1999;103:1345–1352. doi: 10.1172/JCI5703. [DOI] [PMC free article] [PubMed] [Google Scholar]
- 32.Chomczynski P, Sacchi N. Single-step method of RNA isolation by acid guanidinium thiocyanate-phenol-chloroform extraction. Anal Biochem. 1987;162:156–159. doi: 10.1006/abio.1987.9999. [DOI] [PubMed] [Google Scholar]
- 33.Anderson DM, et al. A homologue of the TNF receptor and its ligand enhance T-cell growth and dendritic-cell function. Nature. 1997;390:175–179. doi: 10.1038/36593. [DOI] [PubMed] [Google Scholar]
- 34.Raisz LG, Simmons HA. Effects of parathyroid hormone and cortisol on prostaglandin production by neonatal rat calvaria in vitro. Endocr Res. 1985;11:59–74. doi: 10.3109/07435808509035425. [DOI] [PubMed] [Google Scholar]
- 35.Pilbeam CC, Fall PM, Alander CB, Raisz LG. Differential effects of nonsteroidal anti-inflammatory drugs on constitutive and inducible prostaglandin G/H synthase in cultured bone cells. J Bone Miner Res. 1997;12:1198–1203. doi: 10.1359/jbmr.1997.12.8.1198. [DOI] [PubMed] [Google Scholar]
- 36.Yates AJ, et al. Effects of a synthetic peptide of a parathyroid hormone-related protein on calcium homeostasis, renal tubular calcium reabsorption, and bone metabolism in vivo and in vitro in rodents. J Clin Invest. 1988;81:932–938. doi: 10.1172/JCI113406. [DOI] [PMC free article] [PubMed] [Google Scholar]
- 37.Zhao W, Byrne MH, Boyce BF, Krane SM. Bone resorption induced by parathyroid hormone is strikingly diminished in collagenase-resistant mutant mice. J Clin Invest. 1999;103:517–524. doi: 10.1172/JCI5481. [DOI] [PMC free article] [PubMed] [Google Scholar]
- 38.Yasuda H, et al. Osteoclast differentiation factor is a ligand for osteoprotegerin/osteoclastogenesis-inhibitory factor and is identical to TRANCE/RANKL. Proc Natl Acad Sci USA. 1998;95:3597–3602. doi: 10.1073/pnas.95.7.3597. [DOI] [PMC free article] [PubMed] [Google Scholar]
- 39.Horwood NJ, Elliott J, Martin TJ, Gillespie MT. Osteotropic agents regulate the expression of osteoclast differentiation factor and osteoprotegerin in osteoblastic stromal cells. Endocrinology. 1998;139:4743–4746. doi: 10.1210/endo.139.11.6433. [DOI] [PubMed] [Google Scholar]
- 40.Tsukii K, et al. Osteoclast differentiation factor mediates an essential signal for bone resorption induced by 1α,25-dihydroxyvitamin D3, prostaglandin E2, or parathyroid hormone in the microenvironment of bone. Biochem Biophys Res Commun. 1998;246:337–341. doi: 10.1006/bbrc.1998.8610. [DOI] [PubMed] [Google Scholar]
- 41.Lee S-K, Lorenzo JA. Parathyroid hormone stimulates TRANCE and inhibits osteoprotegerin mRNA expression in murine bone marrow cultures: correlation with osteoclast-like cell formation. Endocrinology. 1999;140:3552–3561. doi: 10.1210/endo.140.8.6887. [DOI] [PubMed] [Google Scholar]
- 42.Lacey DL, et al. Osteoprotegerin ligand is a cytokine that regulates osteoclast differentiation and activation. Cell. 1998;93:165–176. doi: 10.1016/s0092-8674(00)81569-x. [DOI] [PubMed] [Google Scholar]
- 43.Quinn JM, Elliott J, Gillespie MT, Martin TJ. A combination of osteoclast differentiation factor and macrophage-colony stimulating factor is sufficient for both human and mouse osteoclast formation in vitro. Endocrinology. 1998;139:4424–4427. doi: 10.1210/endo.139.10.6331. [DOI] [PubMed] [Google Scholar]
- 44.Wani MR, Fuller K, Kim NS, Choi Y, Chambers T. Prostaglandin E2 cooperates with TRANCE in osteoclast induction from hemopoietic precursors: synergistic activation of differentiation, cell spreading, and fusion. Endocrinology. 1999;140:1927–1935. doi: 10.1210/endo.140.4.6647. [DOI] [PubMed] [Google Scholar]
- 45.Udagawa N, et al. Interleukin-18 (interferon-gamma-inducing factor) is produced by osteoblasts and acts via granulocyte/macrophage colony-stimulating factor and not via interferon-gamma to inhibit osteoclast formation. J Exp Med. 1997;185:1005–1012. doi: 10.1084/jem.185.6.1005. [DOI] [PMC free article] [PubMed] [Google Scholar]
- 46.Horwood NJ, et al. Interleukin 18 inhibits osteoclast formation via T cell production of granulocyte macrophage colony-stimulating factor. J Clin Invest. 1998;101:595–603. doi: 10.1172/JCI1333. [DOI] [PMC free article] [PubMed] [Google Scholar]
- 47.Collins DA, Chambers TJ. Effect of prostaglandins E1, E2, and F2 alpha on osteoclast formation in mouse bone marrow cultures. J Bone Miner Res. 1991;6:157–164. doi: 10.1002/jbmr.5650060209. [DOI] [PubMed] [Google Scholar]
- 48.Kaji H, et al. Prostaglandin E2 stimulates osteoclast-like cell formation and bone-resorbing activity via osteoblasts: role of cAMP-dependent protein kinase. J Bone Miner Res. 1996;11:62–71. doi: 10.1002/jbmr.5650110110. [DOI] [PubMed] [Google Scholar]
- 49.Kawaguchi H, et al. Interleukin-4 inhibits prostaglandin G/H synthase-2 and cytosolic phospholipase A2 induction in neonatal mouse parietal bone cultures. J Bone Miner Res. 1996;11:358–366. doi: 10.1002/jbmr.5650110309. [DOI] [PubMed] [Google Scholar]
- 50.Klein-Nulend J, Pilbeam CC, Raisz LG. Effect of 1,25-dihydroxyvitamin D3 on prostaglandin E2 production in cultured mouse parietal bones. J Bone Miner Res. 1991;6:1339–1344. doi: 10.1002/jbmr.5650061211. [DOI] [PubMed] [Google Scholar]
- 51.Kawaguchi H, et al. Regulation of the two prostaglandin G/H synthases by parathyroid hormone, interleukin-1, cortisol and prostaglandin E2 in cultured neonatal mouse calvariae. Endocrinology. 1994;135:1157–1164. doi: 10.1210/endo.135.3.8070358. [DOI] [PubMed] [Google Scholar]
- 52.Wong BR, et al. TRANCE is a novel ligand of the tumor necrosis factor receptor family that activates c-Jun N-terminal kinase in T cells. J Biol Chem. 1997;272:25190–25194. doi: 10.1074/jbc.272.40.25190. [DOI] [PubMed] [Google Scholar]
- 53.Borger P, Kauffman HF, Vijgen JL, Postma DS, Vellenga E. Activation of the cAMP-dependent signaling pathway downregulates the expression of interleukin-3 and granulocyte-macrophage colony-stimulating factor in activated human T lymphocytes. Exp Hematol. 1996;24:108–115. [PubMed] [Google Scholar]
- 54.Emond V, Fortier MA, Murphy BD, Lambert RD. Prostaglandin E2 regulates both interleukin-2 and granulocyte-macrophage colony-stimulating factor gene expression in bovine lymphocytes. Biol Reprod. 1998;58:143–151. doi: 10.1095/biolreprod58.1.143. [DOI] [PubMed] [Google Scholar]
- 55.Bug G, Aman J, Huber C, Peschel C, Derigs HG. cAMP analogues downregulate the expression of granulocyte macrophage colony-stimulating factor (GM-CSF) in human bone marrow stromal cells in vitro. Mediators Inflamm. 1998;7:195–199. doi: 10.1080/09629359891135. [DOI] [PMC free article] [PubMed] [Google Scholar]
- 56.Povolny BT, Lee MY. The role of recombinant human M-CSF, IL-3, GM-CSF and calcitriol in clonal development of osteoclast precursors in primate bone marrow. Exp Hematol. 1993;21:532–537. [PubMed] [Google Scholar]
- 57.Menaa C, et al. Annexin II increases osteoclast formation by stimulating the proliferation of osteoclast precursors in human marrow cultures. J Clin Invest. 1999;103:1605–1613. doi: 10.1172/JCI6374. [DOI] [PMC free article] [PubMed] [Google Scholar]
- 58.Horowitz MC, Coleman DL, Flood PM, Kupper TS, Jilka RL. Parathyroid hormone and lipopolysaccharide induce murine osteoblast-like cells to secrete a cytokine indistinguishable from granulocyte-macrophage colony-stimulating factor. J Clin Invest. 1989;83:149–157. doi: 10.1172/JCI113852. [DOI] [PMC free article] [PubMed] [Google Scholar]
- 59.Liggett WJ, et al. Effects of macrophage colony stimulating factor and granulocyte-macrophage colony stimulating factor on osteoclastic differentiation of hematopoietic progenitor cells. Stem Cells. 1993;11:398–411. doi: 10.1002/stem.5530110507. [DOI] [PubMed] [Google Scholar]
- 60.Hattersley G, Chambers TJ. Effects of interleukin 3 and of granulocyte-macrophage and macrophage colony stimulating factors on osteoclast differentiation from mouse hemopoietic tissue. J Cell Physiol. 1990;142:201–209. doi: 10.1002/jcp.1041420125. [DOI] [PubMed] [Google Scholar]
- 61.Takahashi N, et al. Role of colony-stimulating factors in osteoclast development. J Bone Miner Res. 1991;6:977–985. doi: 10.1002/jbmr.5650060912. [DOI] [PubMed] [Google Scholar]
- 62.Shuto T, Kukita T, Hirata M, Jimi E, Koga T. Dexamethasone stimulates osteoclast-like cell formation by inhibiting granulocyte-macrophage colony-stimulating factor production in mouse bone marrow cultures. Endocrinology. 1994;134:1121–1126. doi: 10.1210/endo.134.3.8119150. [DOI] [PubMed] [Google Scholar]
- 63.Shuto T, Jimi E, Kukita T, Hirata M, Koga T. Granulocyte-macrophage colony stimulating factor suppresses lipopolysaccharide-induced osteoclast-like cell formation in mouse bone marrow cultures. Endocrinology. 1994;134:831–837. doi: 10.1210/endo.134.2.8299579. [DOI] [PubMed] [Google Scholar]
- 64.Feng X, Teitelbaum SL, Quiroz ME, Towler DA, Ross FP. Cloning of the murine beta5 integrin subunit promoter. Identification of a novel sequence mediating granulocyte-macrophage colony-stimulating factor-dependent repression of beta5 integrin gene transcription. J Biol Chem. 1999;274:1366–1374. doi: 10.1074/jbc.274.3.1366. [DOI] [PubMed] [Google Scholar]
- 65.Stanley E, et al. Granulocyte/macrophage colony-stimulating factor-deficient mice show no major perturbation of hematopoiesis but develop a characteristic pulmonary pathology. Proc Natl Acad Sci USA. 1994;91:5592–5596. doi: 10.1073/pnas.91.12.5592. [DOI] [PMC free article] [PubMed] [Google Scholar]
- 66.Seymour JF, et al. Mice lacking both granulocyte colony-stimulating factor (CSF) and granulocyte-macrophage CSF have impaired reproductive capacity, perturbed neonatal granulopoiesis, lung disease, amyloidosis, and reduced long-term survival. Blood. 1997;90:3037–3049. [PubMed] [Google Scholar]
- 67.Oshima M, et al. Suppression of intestinal polyposis in Apc delta716 knockout mice by inhibition of cyclooxygenase 2 (COX-2) Cell. 1996;87:803–809. doi: 10.1016/s0092-8674(00)81988-1. [DOI] [PubMed] [Google Scholar]


