

Abstract
Rats generate stereotyped exploratory (5–12 Hz) vibrissa movements when navigating through their environment. Like other rhythmic behaviors, the production of whisking relies on a subcortical pattern generator. However, the relatively large vibrissae representation in motor cortex (vMCx) suggests that cortex also contributes to the control of whisker movements. The goal of this study was to examine the relationship between neuronal activity in vMCx and the kinematics of vibrissae movements. We recorded multiunit activity (MUA) and single units in the rhythmic region of vMCx while measuring vibrissa position in awake, head-restrained rats. The rats were engaged in one of two behavioral tasks where they were rewarded for either 1) producing noncontact whisking epochs that met specified criteria (epochs ≥4 Hz, whisks >5 mm) or 2) whisking to contact an object. There was significant coherence between the frequency of MUA and vibrissae movements during free-air whisking but not when animals were using their vibrissae to contact an object. Spike rate in vMCx was most frequently correlated with the amplitude of vibrissa movements; correlations with movement frequency did not exceed chance levels. These findings suggest that the specific parameter under cortical control may be the amplitude of whisker movements.
Keywords: central pattern generator, coding, movement, rat, whiskers
the aim of this study was to investigate the role of motor cortex (MCx) in the control of an ethologically important rhythmic behavior: whisking in rats. Like other rhythmic behaviors (e.g., walking, chewing, licking), whisking relies on a subcortical pattern generator (Bosman et al. 2011; Cramer et al. 2007; Hattox et al. 2002, 2003; Kleinfeld and Deschenes 2011), yet the relatively large vibrissa representation in MCx (vMCx), which projects both densely to the putative whisking central pattern generator (CPG) (Hattox et al. 2002, 2003) and sparsely to vibrissa motoneurons (Grinevich et al. 2005), suggests that cortex contributes to normal whisking behavior. The movements of the vibrissae are simple compared with the jaw or multijointed appendages, while also engaging multiple muscles acting synergistically (Brecht et al. 1997; Haidarliu et al. 2010; Hill et al. 2008; Wineski 1985).
Exploratory whisking involves successive sweeps of protractions and retractions in the range of 5–15 Hz, the amplitude and location of which are coordinated with head movements during locomotion (Towal and Hartmann 2006). Contact with objects in the environment leads to significant alterations in exploratory whisking patterns, and the rapidity of initial movement changes on object contact implicate a direct feedback loop from primary afferent neurons (Mitchinson et al. 2008; Nguyen and Kleinfeld 2005; Towal and Hartmann 2006) to facial motoneurons (Dauvergne et al. 2004). However, context-dependent variations in responses to contact suggest a capacity to override this feedback loop, particularly when the animal's attention is focused elsewhere (Mitchinson et al. 2008).
Laboratory rats can discriminate textures (Carvell and Simons 1990; Guic-Robles et al. 1989, 1992), shapes (Brecht et al. 1997), orientations (Polley et al. 2005), and distances (Krupa et al. 2001; Shuler et al. 2002). During such discriminations, several movement parameters are modulated, including amplitude (Carvell and Simons 1990, 1995; Grant et al. 2009), velocity (Carvell and Simons 1990, 1995; Grant et al. 2009), and frequency (Carvell and Simons 1995). Importantly, performance in these tasks is correlated with the whisking patterns employed (Carvell and Simons 1995; Harvey et al. 2001). Furthermore, whisking onset (Bermejo et al. 1996) and rate (Gao et al. 2003) can be brought under operant control during whisking in air. Although it is likely that alterations of whisking patterns to meet task demands involve vMCx (Bermejo et al. 1996), this hypothesis has not been directly tested, and the few experiments that have directly focused on the contributions of vMCx to whisking have yielded conflicting results.
Extracellular recordings from single vMCx neurons (Carvell et al. 1996) and recordings of local field potentials (LFPs) (Friedman et al. 2006) show that cortical activity increases just before, and in the case of single units, peaks at, whisking onset. However, unit activity has not been found to covary systematically with any parameter of movement kinematics, and the activity typically returns to baseline levels soon after movement onset (Carvell et al. 1996; Friedman et al. 2006). These findings suggest that vMCx acts indirectly via subcortical structures, perhaps by setting the whisking pattern for ensuing epochs of whisking (Cramer and Keller 2006).
However, under certain contexts vMCx may directly drive vibrissa movements: during free-air (noncontact) whisking, LFPs in vMCx can phase-lock with activity of intrinsic vibrissa muscles (Ahrens and Kleinfeld 2004; Castro-Alamancos 2006). Furthermore, stimulus-evoked movements can entrain to cortical stimuli in the range of 7–10 Hz (Berg and Kleinfeld 2003; Brecht et al. 2004), although not at higher frequencies (Cramer and Keller 2006; Haiss and Schwarz 2005). Together, these data suggest that vMCx may influence vibrissa movements through multiple pathways. However, none of these studies determined what movement parameters are under cortical influence.
The interpretation of the relatively few studies of cortical control that have been carried out in this system is further complicated by the fact that vMCx is composed of two functionally distinct subregions: a relatively large anterolateral area in which intracortical microstimulation (ICMS) evokes vibrissa and pad retractions, and a smaller posteromedial region where ICMS evokes a series of rhythmic protractions (Cramer and Keller 2006; Haiss and Schwarz 2005). However, all recording studies that we know of have treated vMCx as homogeneous.
The goal of the current study was to determine if activity in vMCx covaries with parameters of vibrissa movement. We recorded multi- and single-unit activity in the rhythmic region of vMCx while measuring vibrissa position in awake, head-restrained rats during tasks involving either whisking in air or whisker contact with an object. We specifically targeted the rhythmic region of vMCx to increase the likelihood that neural activity would be related to the rhythmic component of vibrissa movements.
METHODS
Surgical Procedures
Procedures complied with National Institutes of Health guidelines for the use and care of experimental animals and were approved by the animal use and care committees at Hunter College and the University of Maryland School of Medicine. Data were collected from seven adult female Long Evans rats (200–300 g). Animals were handled daily for a minimum of 2 wk before surgical procedures were carried out.
Under aseptic conditions animals were anesthetized with isoflurane, laid on a thermoregulated heating blanket, and placed in a stereotaxic apparatus. A scalp incision was made along the midline, the periosteum was retracted, the skull was roughened by scraping, seven stainless steel screws were inserted into the skull, and a ground wire was soldered to one of the skull screws. All screws, as well as two mounting bolts to which a restraint bar could be attached during recording sessions, were embedded in an acrylic platform (Gao et al. 2003). To make a craniotomy after completion of the behavioral training process, a small window (∼2 × 2 mm) was left in the dental cement centered on the stereotaxic coordinates (1.3 medial and 1.3 anterior to bregma) of the rhythmic whisking region of vMCx. Buprenex (0.05 mg/kg im) was administered postsurgery to reduce pain, and an antibiotic (4 ml of Sulfatrim in 480 ml of drinking water) was given 2 wk postsurgery to reduce the chance of infection.
After adaptation to head fixation and consistent performance on the operant task (see below), the animals were reanesthetized with isoflurane, an injection of dexamethasone (2 mg/kg im) was given to control brain swelling, and an ∼1.5 × 1.5-mm opening was made in the exposed skull above vMCx. The opening was filled with saline-soaked sterile cotton, and a thin layer of dental cement was placed over the cotton. Each day before recording began, animals were head-fixed and the dental cement and cotton were gently removed with a scalpel and forceps. Sterile saline was added to the opening throughout recording sessions to keep the brain moist, and saline-soaked cotton and dental cement were reapplied at the completion of each session.
Electrophysiology
Neuronal activity was recorded while rats generated vibrissa movements in one of two operant tasks (see below). Electrophysiological activity was amplified and bandpass filtered from 1 to 10 kHz and digitized to disk (Alpha-Map; Alpha Omega, Tel Aviv, Israel) at a sampling rate of 25 kHz.
With the use of a manual stereotaxic microdrive, an electrode (FHC, stainless steel, 2–4 MΩ, 250-μm shank) was inserted through the dura and slowly lowered to the deep layers of vMCx (range of depths, 1.0–2.0 mm). Data collection began after audiovisual isolation of a neuron. If isolation was lost, the electrode was moved until a new neuron was found. Care was taken not to exceed a depth of 1.9 mm. Recording sessions lasted 45–65 min.
Activity generated during body movements was eliminated from the analysis, as were periods of licking, which were monitored by connecting the metal sipper tube that delivered the reward to the rat's ground. Contact between the rat's tongue and the tube produced a junction potential that could be identified in the electrophysiological recording.
Behavioral Recordings
Movements of the C2 vibrissa in the anterior-posterior plane were recorded in head-fixed rats by using an optoelectronic monitoring system with high spatiotemporal precision (7 μm, 500 Hz). For more detailed methods see Bermejo et al. (1998). Briefly, the C2 vibrissa was enlarged, so that it could be optically differentiated from the other intact vibrissae, by attaching either a light strip of foam (<4 mg) with glue backing or by placing it within a concentric set of light polyimide tubes (Small Parts; total weight, ∼0.6 mg). The set of tubes consisted of an inner tube (diameter, 0.32 mm; length, ∼25.5 mm) set within a slightly shorter outer tube (diameter, 1.29 mm; length, ∼20 mm) and painted with an opaque black paint. Interruption of an emitted beam by the shadow of the marked vibrissa produced a voltage shift in a subset of sensors (charge-coupled devices, CCDs), the position of which changed with vibrissa movement. Position information was acquired by a microprocessor at 500 Hz. To ensure precise synchrony, the behavioral data were outputted from this microprocessor at 500 Hz and resampled by the electrophysiology equipment at a rate of 12 kHz.
Because each rat's vibrissa crosses the monitoring device at a different distance from the face (∼10 mm), a calibration technique (Bermejo et al. 1998) was used to enable micrometer measurements on the sensor to be converted to degrees of displacement of the vibrissa. Degree measurements are independent of distance between the CCD and the vibrissa shaft and so can be compared across rats and enable analyses of group data.
Vibrissa contacts were detected using an L-shaped glass rod glued to a phonograph needle (stylus for Chuo Denshi CZ-800; Radio Shack) seated within a magnetic cartridge (Chuo Denshi CZ-800; Radio Shack). The cartridge was connected to a stepper motor, used to mechanically move the device into and out of the whisking field. When the marked vibrissa touched the vertical arm of the glass rod, the needle transmuted the deflection into steep voltage transients (Hentschke et al. 2006). Transients that exceeded a minimum criterion (1.5 or 2.0 V, depending on baseline activity for the session) were taken to indicate contact.
Behavioral Training
Rats were tested under a food deprivation schedule and maintained at 85–90% of ad libitum body weight. After 14 days (longer if necessary) of postsurgery recovery and gentling, animals were adapted to head fixation by being kept in a fixation container on a tabletop for 5–15 min/day (5 days/wk) until they appeared comfortable (usually 1 wk) and accepted a treat (Nutrical). Next, animals were adapted to the behavior chamber by delivery of the reinforcer (Yoo-Hoo, a chocolate drink) on a variable interval (VI10) time schedule for 15–30 min/day until they consistently accepted the reinforcer (∼2–4 days).
Because rats use their whiskers both to explore the space around them as they move and to explore objects encountered in that space, we used two behavioral tasks to engage each of those functions. In the first task, reinforcement was contingent on patterns of whisking in air. In the second task, reinforcement was contingent on whisker movements making contact with an object. The use of contact and noncontact whisking tasks allowed us to investigate possible context-dependent differences in the relationship between vMCx and whisking. For both tasks, a flash from a house light within the testing chamber signaled trial onset; this house light did not remain on during testing.
Task 1: whisking in air.
Animals (n = 3) were reinforced for epochs of rhythmic whisking in air above a specified frequency and containing whisker movements meeting an amplitude criterion. Initially, a burst of tones (5 Hz) was paired with reinforcer delivery. Once an association between the tones and the presentation of the reward was made, as evidenced by anticipatory licking before reinforcer presentation, the occurrence of a tone became contingent on the animal producing a whisk(s) >5 mm in amplitude. Reinforcement, in turn, was contingent on the occurrence of four tones (e.g., 4 whisks, each >5 mm) within 1 s (4-Hz whisking). The result of this paradigm was the maintenance of whisking at frequencies within the range of exploratory whisking throughout the recording session. Besides reinforcement of whisking, the operant contingencies also served to reduce the probability of reinforcing other oromotor behaviors (e.g., tooth grinding and licking). Recording sessions were composed of 45–65 60-s trials.
Task 2: contact whisking.
Animals (n = 4) were reinforced for movements of the C2 vibrissa that contacted the vertical component of an L-shaped glass rod fixed in the most rostral 2 mm of the behavior-monitoring device. All vibrissae rostral to C2 were trimmed to a length that precluded them from contacting the rod (7–9 mm). The glass rod was mounted on a movable arm, which swung the rod into position at the start of each trial and out of reach at its end. All trials were 60-s long, and each daily recording session consisted of 50–65 trials. All contacts ≥3 s from the previous contact were rewarded.
At the start of each animal's training, the contact rod was placed near the resting position of the marked vibrissa (C2). After the rats had learned the association between contact and reward, as evidenced by the occurrence of licks immediately after contact and an increase in the number of contacts made, the rod position was moved to progressively more rostral positions to increase the amplitude of whisks.
Analyses
Behavioral and neurophysiological data were imported into Neuroexplorer (Nex Technologies, Littleton, MA). For both tasks, data on whisker movements were selected for analysis by identifying epochs that lasted for ≥1 s, were preceded by ≥500 ms of nonwhisking, and did not contain contacts, although they might have led up to a contact. Individual whisking epochs meeting selection criteria were isolated in Neuroexplorer by placing a time stamp at the start and end of each epoch. These time stamps were then used as interval filters on both the raw behavior and neural signals. For animals whisking in air (task 1), neural activity in the 500 ms preceding movement was also isolated to investigate the relationship between this premovement activity and the ensuing whisking epoch.
Once epochs within trials were isolated, all trials from the same electrode location within a recording session were merged into a single file and exported to a Plexon Offline Sorter (Dallas, TX) for sorting of multiunit and, when possible, isolation of single-unit activity. Multi- and single-unit spike times and behavioral data were then exported to Matlab (The MathWorks, Natick, MA) for further analysis.
The movement records were decimated to 500 Hz before all analyses. To capture changes in whisking over time and to enable trial averaging, we used a 1-s sliding window (500- ms overlap) to segment each whisking epoch. For each segment we calculated the spectral power (multitapered power spectrum, PSD) of the movement and spike records and the coherence between these two measures (for all analyses: tapers = [2 3], pad = 2). The dominant frequency (between 2 and 20 Hz) for whisking and spiking was taken as the location of the peak in the respective PSD.
Coherence between whisking frequency within segments and the corresponding spike frequency, as well as trial-averaged coherence levels, was computed using the multitaper coherencypt algorithm in Chronux (http://bit.ly/mQdcVZ). This function is called with two time series as arguments: the continuous movement data and the corresponding spikes, which are stored as event times. It returns the magnitude of the coherency, the cross-spectrum, and individual spectra from which the coherence is computed and computes confidence intervals on the magnitude of the coherency. The confidence limit for coherence was estimated using the equation
where N is the number of segments, NK is the degrees of freedom, and P = 0.05 and 0.01 represent the 95% and 99% confidence limits, respectively (Jarvis 2001). For N = 1 epoch, K = 3, and P = 0.05, for instance, the coherence between two unrelated signals is 0.88, whereas coherence at P = 0.01 is 0.95.
For all sessions containing five or more whisking segments, both whisking frequency and segment amplitude were correlated with firing rate using Spearman's ρ. The movement record was detrended before this correlation analysis by subtracting the best-fit line for each whisking segment, which corrected for differences in set point caused by the location of the pad. The area under the curve (deg × s) was taken as a measure of whisking amplitude.
To determine whether occurrences of statistical significance (i.e., number of units whose spike rates were significantly correlated with movement frequency or amplitude) were greater than expected by chance, neural and movement data were temporally dissociated by randomly shuffling the position of the spike data relative to the movement data. That is, for each analysis, each segment of spike times was analyzed with reference to a segment of the movement record that occurred at a different point in time from the spikes. Comparisons were made between the proportion of significant sessions/segments for the shuffled and unshuffled data using either Fisher's exact probability test (when n ≤ 50) or the z-test for comparing two proportions (when n > 50).
Comparisons between proportions of significant sessions/segments for task 1 and task 2 animals were also made for all analyses. When no differences by task were found, data were combined and analyzed as a group. When differences between groups were found, results for each group are reported separately.
Because vMCx activity increases before the onset of a whisking epoch (Carvell et al. 1996; Friedman et al. 2006), we also calculated correlations (Spearman's ρ) between the firing rate after the first significant increase in spike activity during the 250 ms before whisking onset, and whisking frequency and amplitude during the first 1 s of movement. Baseline activity was taken as the mean number of spikes per 10-ms bins during the −500 to −250 ms before whisking, that is, when no vibrissa movements were detected. The point of increased spike activity was defined as the first bin in the 250 ms just before whisking that contained spike activity greater than 2 standard deviations (SD) above the calculated baseline.
Identification of Recording Sites
The locations of recording sites within vMCx were verified through cortical microstimulation after all recording sessions for each animal were complete. The animals were either anesthetized with ketamine (100 mg/kg) and xylazine (8 mg/kg; n = 4), or head-fixed in the awake state (n = 3), and vibrissae movements were evoked by intracortical microstimulation (200-μs-long pulses delivered at 50 Hz for 1 s; ≤100 μA). Six of the seven animals were stimulated at the same coordinates used during recording. In the seventh animal, the recording locations could not be precisely identified, so stimulation was made at sample sites throughout the craniotomy. Stimulation in the majority of sites across animals resulted in movements characterized by a strong rhythmic component, as described previously by Haiss and Schwarz (2005) and Cramer and Keller (2006). These results confirm that the electrodes were implanted in the “rhythmic whisking” region of vMCx (Haiss and Schwarz 2005; Sanderson et al. 1984). Stimulation at a few sites evoked a single retraction, with no rhythmic component. Recordings made from this “retraction region” were excluded from analyses.
At the completion of stimulation sessions, rats were deeply anesthetized (pentobarbital 60 mg/kg) and perfused with 4% buffered paraformaldehyde. Brains of six of the seven animals were removed, sectioned in the coronal plane, and Nissl stained to confirm the location of the electrode tracks in MCx. The seventh rat died before the perfusion process could be completed.
RESULTS
Our goal was to examine the relationship between neuronal activity in vMCx and the kinematics of vibrissae movements, and to determine whether that relationship varies with behavioral context. Our analyses included recordings from 32 well-isolated single units (from 4 animals, all performing a contact task, task 2) and multiunit activity (MUA) recordings from 53 recording locations (7 animals, performing either task 1 or task 2). All cells were classified as regular spiking units (RSU) (Kwegyir-Afful and Keller 2004) and were located 1.0–2.0 mm below the pia surface (median = 1.5 mm, 1st quartile = 1.2 mm, 3rd quartile = 1.6 mm). Neural activity was correlated with simultaneously recorded epochs of voluntary whisking, each lasting at least 1 s. Before analyses, epochs longer than 1 s were parsed into 1-s-long segments using a sliding window with a 500-ms overlap (see methods). In all, we analyzed multiple units from 1,249 whisking segments (475 epochs) and single units from 700 segments (263 epochs).
Whisking Frequency
We calculated the power spectral density (PSD) of the movement record for each whisking segment and defined the whisking frequency as the spectrum's peak. Figure 1, A and B, illustrates typical epochs of whisking for each task (top) and the PSDs for those epochs (bottom). Also shown are the raw neural records for the same time periods (middle). Whisking frequencies within selected segments ranged from 2 to 10 Hz (median = 5.1 Hz, Fig. 1C), which are within the typical range of frequencies for exploratory whisking (Hill et al. 2008; Jin et al. 2004).
Fig. 1.
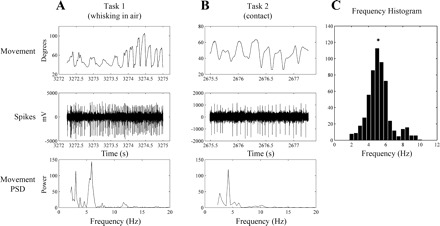
A and B: movement traces (top) are shown with corresponding raw neural recordings (middle). Power spectral density (PSD) for both movement epochs (bottom) show peak frequencies between 7 and 9 Hz. C: frequency histogram for all segments analyzed (median = 5.13, indicated by asterisk).
Relationship Between Premovement Neural Activity and Whisking
We (Friedman et al. 2006) and others (Carvell et al. 1996) have previously shown that vMCx activity increases before the onset of a whisking epoch. As an illustration, Fig. 2A shows raster plots (top) of spike activity and the spike histogram (bottom) from 0.5 s before movement onset to 1 s after movement onset for all epochs (Fig. 2B) from a single recording site. To determine whether this premovement activity covaries with whisking frequency or amplitude, we computed correlations (Spearman's rank correlation coefficient, ρ, which makes no assumption of linearity) between these variables (calculated over the first 1 s of movement for each epoch) and premovement neuronal firing rates for MUAs that showed a significant increase in activity before movement. Significant increases in firing rate were identified as the first 10-ms peristimulus time histogram bin in the 250-ms period before movement whose response magnitude was at least 2 SD above spontaneous activity levels. Spontaneous activity, furthermore, was defined as the mean firing rate during the 500- to 250-ms period preceding movement onset. We used the integral of the movement trace as a measure of the amplitude of individual whisks. This analysis was performed on all whisking epochs (n = 200) from 27 recording sites and MUAs recorded from task 1 (whisking in air) animals.
Fig. 2.

A: raster plot (top) of all epochs from a single recording site and spike histogram (bottom) from 0.5 s before movement onset (premovement) to 1.0 s postmovement. Baseline activity was calculated from firing during −0.5 to −0.25 s, whereas firing increases were taken as the first significant rise above baseline between −0.25 and 0.0 s, relative to movement onset. Movement onset = 0 s. Activity increased just before movement onset and ramped up further at onset. B: individual movement epochs corresponding to the raster in A.
Timing of changes in premovement neuronal firing.
A significant increase in MUA was found in 100 of the 200 (50%) whisking epochs and in 24 of the 27 (88.9%) MUA recording locations. Onset latencies ranged from 5.42 to 249.4 ms before whisking onset (median = −159.2 ms, mean = −149.85 ms). MUA recording locations that had five or more whisking epochs associated with a significant increase in premovement firing rates (n = 6 locations) were further analyzed to determine whether there were significant correlations between this premovement activity and postmovement whisking frequency or amplitude.
Frequency.
Correlations between premovement firing rates and whisking frequencies were calculated for the six MUA recording sites that had five or more whisking epochs associated with a significant increase in neural activity before movement onset. Correlation values ranged from −0.34 to 0.42 (median = −0.03), and their significance values were all >0.05. This finding suggests that premovement cortical activity is not systematically correlated with ensuing whisking frequency.
Amplitude.
As with the frequency analysis reported above, correlations between premovement firing rates and whisking amplitudes were calculated for the six MUA recording sites that had five or more whisking epochs associated with a significant increase in neural activity before movement onset. Correlation values for these sites ranged from −0.10 to 0.55 (median = −0.05), and their significance values were all >0.05. As with frequency, this finding suggests that premovement cortical activity is not systematically correlated with whisking amplitude.
Coherence Between Whisker Movements and vMCx Activity
Having established that premovement cortical activity does not consistently correlate with subsequent whisking kinematics, we asked whether cortical activity correlates with ongoing whisking. We investigated the relationship between cortical activity and whisking in the time-frequency domain by computing, for each segment, the spectral coherence between the movement frequency and the single unit/MUA firing rate (see methods for details). This analysis enabled us to determine which frequencies were displayed both by the tracked whisker and the single unit/MUA as well as the power of the relationship between the two.
The confidence limits for significant coherence during a single whisking epoch were determined to be 0.88 for P = 0.05 and 0.95 for P = 0.01 (see methods). An example of this analysis is illustrated in Fig. 3, where the movement record is shown in A and B and the movement and MUA PSDs are shown in C and D, respectively. Coherence values over the range of 2–20 Hz are plotted in E. The horizontal line marks the 95% confidence limit for coherence, and the asterisk marks the central whisking frequency for the segment illustrated. In this example, movement and MUA were coherent at the whisking frequency. Because this analysis identifies similarities in dynamics between the movement traces and the spike time stamps, the analysis reveals peaks in coherence even at bandwidths in which the power is low in the movement traces. In the example shown in Fig. 3, there appears an additional minor, albeit significant, peak at around 14 Hz. The significance of this minor peak is not clear, and in the vast majority of our analyses, significant coherence occurred only in bandwidths corresponding to whisking.
Fig. 3.

Example of coherence between movement and multiunit activity (MUA) in vibrissae representation in motor cortex (vMCx) during 1 s of movement. A: the full whisking epoch from which the 1-s segment (B) was extracted. C and D: whisker and MUA frequency power spectra, respectively. E: coherence between movement and MUA, over the range of 2–20 Hz. Horizontal line represents the 95% confidence level; asterisk indicates central whisking frequency for the segment.
MUAs.
The results from our two behavioral tasks were significantly different (P < 0.001) and so we report them separately. Movement records and MUA were coherent at the whisking frequency in 86 of 496 (17.3%) segments from task 1 (whisking in air) animals but in only 42 of 746 (5.6%) segments from task 2 (contact whisking) animals (Fig. 4). To determine whether the occurrence of coherent segments is greater than what would be predicted by chance, we repeated the analysis after shuffling the data, dissociating neural and movement activity (see methods). The proportion of coherent segments was significantly different from the shuffled data for task 1 (17.3% vs. 9.5%, P = 0.0001) but not task 2 animals (Fig. 4).
Fig. 4.

Comparison of proportion of coherent segments, for each task, before and after data were shuffled. The proportion of coherent segments was significantly different from the shuffled data for MUAs in task 1 only. *P ≤ 0.05.
Single units.
Movement and single-unit activity were coherent at the whisking frequency in 41 of 700 (5.9%) whisking segments, all of which were from task 2 animals. Similar to the MUA analysis for these animals, when the data were shuffled and reanalyzed, the proportion of coherent segments in the unshuffled data was not significantly different from the proportion in the shuffled data (5.9% vs. 4.9%, P = 0.203, Fig. 4).
Trial-Averaged Coherence Between Whisker Movements and vMCx Activity
We reported above significant coherence between neural activity and movement records in a proportion of the recordings. Such significant coherence indicates that these two signals covary and have a consistent phase relationship. However, this segment-by-segment analysis does not determine if that phase relationship is consistent over time, across segments. To test whether phase-locking was consistent across segments, we computed the trial-averaged coherence for each recording site (see methods). If the phase relationship between spiking and whisking varied across segments, averaging would diminish the level of coherence between these two variables. Conversely, if the phase relationships were consistent, averaging could enhance the coherence between these variables. Trial-averaged coherence between vibrissa movements and cortical activity within a session was considered significant if the magnitude of the coherence exceeded the significance limit at the peak whisking frequency, computed from the average movement PSD. Figure 5 shows two examples of trial-averaged coherence, as well as the individual movement traces and associated spike times used in the averaging. In these cases, the magnitude of the coherence was significant (P < 0.05) at the peak average movement frequency.
Fig. 5.

Two examples of recording sessions where coherence between spiking and vibrissae movements was significant after trial averaging. Trial-averaged spectral coherence values are plotted as a function of frequency (A and B, boxed). Horizontal lines mark the 95% confidence level. The peak movement frequencies after averaging across movement segments are indicated by asterisks. Individual movement traces, and their associated spike times, are also shown.
MUAs.
As with the trial-by-trial coherence analysis, the results from our two behavioral tasks were significantly different, and so we report them separately. Fifteen of 27 (55.6%) MUA recording sites for task 1 animals and 6 of 26 (23.1%) recording sites for task 2 animals were coherent (95% confidence limit) after trial averaging. To assess whether coherence is higher than what would be predicted by chance, we shuffled and reanalyzed the data. The proportion of coherent trial-averaged sessions was significantly different from that of the shuffled data for both task 1 (55.6% vs. 14.8%, P = 0.0018) and task 2 (23.1% vs. 3.9%, P = 0.0496) animals (Fig. 6A). The increase in the number of coherent trials after averaging (e.g., to 55.6% from 17.3% from task 1 trials) suggests that the neuronal signals and movement records have a significant and consistent phase relationship.
Fig. 6.

Comparisons of data before and after shuffling. Shuffling was done to determine whether the relationships were significantly different from what might occur by chance. A: the proportion of coherent trial-averaged sessions before shuffling was significantly different from that after shuffling for MUAs in both task 1 and task 2. B: the proportion of recording sites at which whisking frequency and MUA/single-unit firing rate were significantly correlated was not significantly different from chance for either MUAs or single units. C: the percentage of recording sites at which whisking amplitude and MUA/single-unit firing rate were significantly correlated was significantly different from chance for both MUAs and single units. *P ≤ 0.05.
Single units.
After trial averaging, movement and single-unit activity, all from task 2 (contact) animals, were coherent at the peak average whisking frequency in 12 of 32 (37.5%) sessions. When the data were shuffled and reanalyzed, the proportion of coherent trial-averaged sessions in the unshuffled data was not significantly different from the proportion in the shuffled data (37.5% vs. 18.8%, P = 0.0818, Fig. 6A).
Relationship Between Whisking Frequency and Neural Activity
To determine whether vMCx activity modulates frequency during whisking, we correlated whisking frequencies with concurrent neuronal activity. To capture changes in whisking frequency that might be reflected in changing cortical activity, we parsed whisking epochs into 1-s segments (see methods) and calculated the frequency for each segment. Next, we calculated Spearman's ρ to quantify the relationship between firing rates and the center whisking frequencies for all segments from a recording location. Because no difference between the two behavioral contexts was found, data from both tasks were grouped together for analysis.
MUAs.
Six of 46 (13%) MUAs revealed a significant correlation (P < 0.05) between whisking frequency and MUA firing rate during the 1-s segments extracted from each recording session. To determine whether this proportion of correlated recording locations is significantly different from what can occur by chance, we recalculated the ρ values after shuffling all segment data for each recording site. The correlation between firing rate and movement frequency, after shuffling, was significant for 2 of the 46 (4.3%) MUA recordings. This proportion is not significantly different from that computed from the unshuffled data, although it approaches significance (Fisher's exact probability test, P = 0.0694, Fig. 6B). We are therefore unable to reject the null hypothesis that the proportion of MUAs with a significant correlation between firing rate and movement frequency is equal to what might occur by chance.
Although the proportion of MUAs whose activity correlated with frequency could have occurred by chance, we conducted a multivariate regression analysis to determine whether there was a difference between movement frequencies, movement amplitudes, or MUA firing rates during movement among data from correlated and uncorrelated MUAs. There was no difference between the movement frequencies (P = 0.6877) or amplitudes (P = 0.1617) of segments at correlated (mean frequency = 5.09 Hz, mean amplitude = 5,257.53°/s) or uncorrelated recording locations (mean frequency = 5.05 Hz, mean amplitude = 4,989.92°/s). This analysis did reveal significantly higher firing rates in correlated recording sites (mean = 133.84 spikes/s) compared with those from uncorrelated recording sites (mean = 63.29 spikes/s) (P < 0.0001). See Table 1 for comparison of results.
Table 1.
Comparison of whisking segment frequency, segment magnitude, and firing rate means between MUAs and single units correlated with whisking frequency and those showing no significant correlation
| Frequency, Hz | Amplitude, °/s | Firing Rate, Hz | |
|---|---|---|---|
| MUAs | |||
| Correlated | 5.09615 | 5257.534 | 133.8364 |
| Uncorrelated | 5.051063 | 4989.924 | 63.28842 |
| P value | 0.6877 | 0.1617 | <0.0001 |
| Spikes | |||
| Correlated | 4.630488 | 4415.996 | 13.03352 |
| Uncorrelated | 5.083154 | 4728.8 | 9.328904 |
| P value | 0.0003 | 0.0604 | <0.0001 |
MUA, multiunit activity.
Finally, we also investigated whether there was overlap between the recording sites that had a significant correlation between MUA firing rate and whisking frequency and those that displayed significant coherence, in terms of both individual segments and after trial averaging. Five of the 6 (83.3%) correlated recording sites had significant trial-averaged coherence, whereas only 24 of the 214 (11.2%) individual segments that were part of positively correlated sessions were themselves significantly coherent.
Single units.
We conducted the same analysis to determine whether there was a significant correlation between movement frequency and firing rate of single units. Twenty-eight units met the criteria for the correlation analysis (i.e., were recorded from during at least 5 whisking segments). Although there was a significant correlation between firing rate and whisking frequency for segments recorded from 7 of the 28 (25%) units isolated, this number was not significantly different from what occurred after data were shuffled and reanalyzed (25% vs. 7.1%, Fisher's exact probability test, P = 0.071, Fig. 6B). Thus these findings do not support the hypothesis that firing rates of vMCx neurons reliably encode whisking frequency.
As above, we conducted a multivariate regression analysis to determine whether there was a difference between movement frequencies, movement amplitudes, and/or spike firing rates during movement among data from correlated and uncorrelated single-unit recording sites. There was a significant difference between the movement frequencies (P = 0.0003) and spike firing rates (P < 0.0001) at correlated (mean frequency = 4.63 Hz, mean firing rate = 13.03 spikes/s) and uncorrelated recording locations (mean frequency = 5.08 Hz, mean firing rate = 9.33 spikes/s). However, this analysis did not reveal a difference between movement amplitudes from correlated recording sites (mean = 4,416.00°/s) compared with those from uncorrelated recording sites (mean = 4,728.8°/s) (P = 0.0604). See Table 1 for comparison of results.
As we did with MUAs above, we asked whether there was overlap between the recording sites that had a significant correlation between single-unit firing rate and whisking frequency and those that displayed significant coherence, both within segments and after trial averaging. Three of the 7 correlated sessions were also coherent after trial averaging, whereas only 11 of the 179 individual segments that were part of correlated sessions were also coherent.
Relationship Between Whisking Amplitude and Neural Activity
As with whisking frequency, we determined whether there was a correlation between firing rate during whisking and movement amplitude. The amplitude of whisks within epochs varies over time such that the mean amplitude of an entire epoch might not provide a representative approximation of whisk amplitudes across time. We therefore calculated the correlation (Spearman's ρ) between firing rate and the amplitude of 1-s segments of whisking, to capture differences in whisk amplitudes within the larger epochs. As with the frequency analysis, described above, no difference was found between contexts, so data from both task groups were analyzed together.
MUAs.
Firing rate and segment amplitude were significantly correlated (P < 0.05) in 13 of 46 (28.3%) MUA sites having at least 5 whisking segments. To test whether this proportion was greater than might occur by chance, the data were shuffled and the correlation analysis was repeated. The proportion of correlated sites in the unshuffled data was significantly greater than the proportion in the shuffled data (28.3% vs. 8.7%, P = 0.0078, Fig. 6C), suggesting that there is a causal relationship between MUA and movement amplitudes.
As with frequency, we conducted a multivariate regression analysis to determine whether there was a difference between movement frequencies, movement amplitudes, and/or spike firing rates during movement among data associated with MUAs that were correlated with amplitude and those that were not correlated with amplitude. We found that there was no significant difference between the movement frequencies (P = 0.5243) and amplitudes (P = 0.2090) of segments from correlated (mean frequency = 5.01 Hz, mean amplitude = 5,174.96°/s) and uncorrelated recording locations (mean frequency = 5.07 Hz, mean amplitude = 4,979.94°/s). However, this analysis did reveal a difference (P < 0.0001) between MUA firing rates from correlated recording sites (mean = 121.11 spikes/s) compared with those from uncorrelated recording sites (mean = 57.67 spikes/s). See Table 2 for comparison of results.
Table 2.
Comparison of whisking segment frequency, segment magnitude, and firing rate means between MUAs and single units correlated with whisking amplitude and those showing no significant correlation
| Frequency, Hz | Amplitude, °/s | Firing Rate, Hz | |
|---|---|---|---|
| MUAs | |||
| Correlated | 5.013956 | 5174.959 | 121.1076 |
| Uncorrelated | 5.071918 | 4979.938 | 57.67217 |
| P value | 0.5243 | 0.209 | <0.0001 |
| Spikes | |||
| Correlated | 5.17985 | 5324.115 | 9.245833 |
| Uncorrelated | 4.890484 | 4361.207 | 10.5915 |
| P value | 0.0106 | <0.0001 | 0.023 |
We also investigated whether there was overlap between the recording sites that had a significant correlation between MUA firing rate and whisking amplitude and those that displayed significant coherence, in terms of both individual segments and after trial averaging. Nine of the 13 (69.2%) correlated recording sites had significant trial-averaged coherence, whereas only 56 of the 435 (12.9%) individual segments that were part of positively correlated sessions were themselves significantly coherent.
Single units.
Twenty-eight single units met the criteria for the correlation analysis (≥5 movement segments). Spike rates in 7 of the 28 (25%) isolated units were significantly correlated (P < 0.05) with movement amplitude within segments. When the proportion of correlated units was compared with the proportion after movement and units were dissociated through shuffling, the occurrence in the original data was significantly higher than in the shuffled data (25% vs. 3.6%, P = 0.026, Fig. 6C). In conjunction with the analysis of MUA, these results suggest that vMCx activity may be influencing the amplitude of individual vibrissa movements.
A multivariate regression analysis was conducted to determine whether there was a difference between movement frequencies, movement amplitudes, and/or spike firing rates during movement among data associated with single units that were correlated with amplitude and those that were not correlated with amplitude. We found that there was a significant difference between the movement frequencies (P = 0.0106) and amplitudes (P < 0.0001) of segments, as well as the spike firing rate (P = 0.0230), from correlated (mean frequency = 5.18 Hz, mean amplitude = 5,324.12°/s, mean firing rate = 9.25 spikes/s) and uncorrelated recording locations (mean frequency = 4.89 Hz, mean amplitude = 4,361.21°/s, mean firing rate = 10.59 spikes/s). See Table 2 for comparison of results.
As we did with MUAs above, we asked whether there was overlap between the recording sites that had a significant correlation between single-unit firing rate and whisking amplitude and those that displayed significant coherence, both within segments and after trial averaging. Four of the 7 (57.1%) correlated sessions were also coherent after trial averaging, whereas only 15 of the 240 (6.3%) individual segments that were part of correlated sessions were also coherent.
DISCUSSION
Our goal was to determine whether activity in the rhythmic region of vMCx covaries with parameters of vibrissa movement. We recorded multi- and single-unit activity in vMCx while measuring vibrissa position in awake, head-restrained rats. We focused our analyses on whisking frequency and amplitude, the two cardinal parameters that define whisking behavior. Our results indicate that variation in spike rate in this cortical region most frequently is associated with the amplitude of vibrissa movements. Although covariation between spike rate and whisking frequency was found at some recording locations, it did not exceed chance levels.
Premovement Activity
We previously reported that activity in vMCx, monitored through recording LFPs, increases 200–500 ms before whisking onset (Friedman et al. 2006). Similar prewhisking activity was recorded previously from single units in vMCx (Carvell et al. 1996). Consistent with these studies, we also found a significant increase in premovement activity before whisking onset. Just as spinal CPGs for locomotion are thought to operate independently on “priming” by supraspinal inputs (Courtine et al. 2009), we have postulated that this premovement activity “primes” the brain stem pattern generators to initiate rhythmic activity (Cramer and Keller 2006; Cramer et al. 2007). We therefore examined the data to determine whether this premovement activity encodes the kinematics of subsequent vibrissae movements. We found no significant correlations between prewhisking cortical firing rates and whisking frequency or amplitude, suggesting that this increase in activity is not coding for either of these movement parameters in the ensuing whisking epoch.
Spectral Coherence
Studies in other motor systems have shown that cortical oscillations are phase-locked to oscillations in muscle activity and that the magnitude of coherence between these oscillatory signals is modulated by behavioral context (Kilner et al. 2002). These findings suggest that the coherence between cortex and muscles is related to some parameter of motor function. By analyzing recordings of cortical LFPs in sensory and motor cortex, Ganguly and Kleinfeld (2004) demonstrated similar, task-dependent modulation of phase-locking between cortical and whisking activity. Because this coherence occurred at the same frequency bandwidth characterizing exploratory whisking, they argued that this phase-locking illustrates that vMCx can initiate the motion of the vibrissae on a cycle-by-cycle basis.
Our studies are consistent with the results of Ahrens and Kleinfeld (2004) in that they demonstrate significant and common (55.6% of recordings from task 1) trial-averaged spectral coherence between MUA and whisking. The incidence of trial-averaged coherence recorded from task 2 animals was lower (37.5%), suggesting that, as with the studies discussed above, phase-locking is task dependent. In those studies the investigators argued that the context-dependent nature of the task was reward dependent. That is, coherence was present only when animals were whisking in search of a reward. Whereas both of our tasks involved whisking behaviors reinforced by a reward, they differed in the types of movements being rewarded: in task 1, animals were rewarded for producing epochs of whisking (in air) that exceeded set amplitude and frequency criteria, whereas in task 2, animals were rewarded when they contacted an object, even if the contact was made with only a single vibrissa movement. For both tasks our analyses focused on epochs of whisking. However, we may have found coherence during task 1 because we analyzed the rewarded movements, whereas in task 2 we analyzed whisking epochs that may or may not have resulted in contact. Our analytic approach was based on the assumption that all movements in task 2 represented an attempt to make contact. However, this assumption may not be correct. In this case, coherence may occur only in the whisk that leads to contact. Because licking often began before contact was made, movement artifacts in the neural record precluded analyzing these movements. Alternatively, vMCx may be functioning to control the amplitude of whisks, as suggested by our correlation analysis (discussed further below). In this case, we would predict greater levels of coherence for task 1, which required animals to whisk at a minimum amplitude. Task 2, on the other hand, rewarded animals for emitting an individual whisk that resulted in contact, regardless of movement characteristics. This type of behavior may not have required a direct cortical role in movement control.
We also did not find significant coherence between the activity of single vMCx units and whisking. As in any single-unit study, this might reflect a selection bias: we might not have recorded from the relevant neurons. It is also possible that control of whisking parameters occurs through a “population code” involving the coactivation of a large number of vMCx neurons. This would be consistent with findings that MUA (present study) and LFPs (Ahrens and Kleinfeld 2004), both reflecting the activity of large neuronal populations, are phase-locked to whisking. Indeed, we found significantly higher firing rates among MUAs in recording sessions in which neuronal activity was correlated with whisking kinematics compared with sessions lacking such correlations. This suggests that more units might contribute to a population code during these correlated sessions.
Covariation of Cortical Activity and Whisking Frequency
Spectral coherence between vMCx and whisking activity suggests a causal relation between the two but does not directly identify the movement parameters controlled by vMCx. We focused on the two cardinal parameters of vibrissae movements: frequency and amplitude. We first asked if there was a correlation between spike counts during whisking and whisking frequency, as might be expected if vMCx was setting whisking frequency. Activity of single units and MUAs were correlated with whisking frequency only in a small percentage of our recordings. Neither of these levels of occurrence significantly exceed chance levels. This suggests that activity in vMCx, measured as firing rates, is not setting the frequency of movements in the epochs analyzed, i.e., that frequency is likely not under cortical control.
Covariation of Cortical Activity and Whisking Amplitude
We previously reported that the number of active vibrissae motor units, and their firing rate, correlates strongly with the amplitude of whisks (Cramer and Keller 2006). It may be, then, that vMCx directs motor unit recruitment and activity level during movement. We found covariation between the amplitude of whisking and spike count among single (25% of units) and multiple units (28%). These levels of occurrence were significantly greater than what occurred when the data were shuffled and reanalyzed, indicating that amplitude can be set by vMCx during active whisking.
Whisking amplitude and velocity are highly correlated (Cramer and Keller 2006; Voigts et al. 2008), so it may be that the crucial parameter is whisking velocity rather than amplitude. Work characterizing the velocity profiles of individual whisks recorded from behaving animals has shown that velocity often increases and decreases in unpredictable ways, leading to irregularly shaped whisks that at times even reverse direction in midprotraction (Towal and Hartmann 2008). These authors suggest that the rat may be controlling these changes in instantaneous velocity in real time to influence the processing of sensory information. It may be, then, that vMCx acts on the whisking rhythm generator to set the velocity rather than the amplitude of whisks and perhaps even controls the velocity profile on a whisk-by-whisk basis in certain contexts.
Strength of Relationships Between Whisking and Cortical Activity
The activity of motor cortex neurons correlates with a large number of movement parameters (Cheney and Fetz 1980; Grillner et al. 1997; Mehring et al. 2003; Rickert et al. 2005; Scott 2003; Tanji and Evarts 1976; Thach 1978), and these correlations are strongly task dependent (Fetz 2007; Thach 1978). We also found a relationship between neural activity and more than one movement parameter (amplitude and frequency), as well as differences in the strength of relationships between tasks. Although we found significant correlations between cortical activity and both amplitude/velocity and frequency, neither relationship occurred among a majority of cells. Furthermore, when data were shuffled and reanalyzed to determine whether the proportion of significant correlations was greater than could occur by chance, only the relationship with amplitude/velocity was significant.
A likely and important factor determining the occurrence of correlations is the projection target of different vMCx neurons. In the rabbit, for instance, activity in layer 5 corticofugal neurons is highly modulated with movement, but activity in corticocortical and layer 6 corticofugal neurons remains unchanged during movement (Beloozerova et al. 2003). The vMCx projects not only to the putative whisking rhythm generator but also to a number of other cortical and subcortical areas, such as the superior colliculus (Hattox et al. 2002; Miyashita and Mori 1995), as well as directly to the vibrissa motoneurons in the lateral facial motor nucleus (Grinevich et al. 2005). We did not identify the targets of our recording locations, and it is likely that they varied across penetrations. The inconsistency across our recording sites, then, likely reflects the functional differences among the various cellular networks encompassing our recording sites.
Another source of variability might relate to the target muscles indirectly controlled by different motor cortical neurons (Jackson et al. 2007). Several muscle groups can participate in the production of vibrissa movements. Anatomical findings (Dorfl 1982; Haidarliu et al. 2010; Wineski 1985) suggest that the intrinsic muscles control the pendular motion of the vibrissae, whereas the extrinsic muscles move the vibrissa pad to change the set point of the array. Behavioral work, however, has shown that both groups of muscles have a rhythmic pattern of activation and that whisking results from the synergy of the muscles working in specific phase combinations (Hill et al. 2008). On the basis of that study, Hill et al. suggest that multiple CPGs work together to coordinate the outputs of the contributing muscles, which can be combined in different ways to produce a variety of movement patterns (see also, Bosman et al. 2011; Kleinfeld and Deschenes 2011). Importantly, stimulation of different areas within vMCx can produce different types of vibrissa movements, such as retractions, rhythmic protractions, and combinations of the two (Berg and Kleinfeld 2003). However, we do not know how sites within vMCx map onto intrinsic and extrinsic muscle activation. Such a map might be critical to deciphering the relationship between specific cells and vibrissa movement.
The current study attempted to minimize some of this complexity by targeting a known cortical subregion (Haiss and Schwarz 2005). We have previously shown that stimulation of this area results in the activation of intrinsic muscles, whose EMG signal is predictive of vibrissa movements (Cramer and Keller 2006). Although this increases the likelihood that we recorded from cells associated with the intrinsic muscles, we have not tested this and so cannot rule out the possibility that this area also plays a role in extrinsic muscle activation. If whisking is the product of multiple, interacting rhythm generators, we would expect the relationship between activity in vMCx and whisking to differ depending on the targets of those cells and the role the associated muscles play in a given movement. The possibility that different areas of vMCx may be controlling different rhythm generators, combined with the diversity of possible targets of our recording sites, may explain why this region appears to have a different relationship with movement at different times.
GRANTS
The project described was supported by National Institute of Neurological Disorders and Stroke Grants R01-NS-35360 (to A. Keller), R01-NS-39107 (to H. P. Zeigler), and Individual Kirschstein-National Research Service Award NS-050042 (to W. A. Friedman).
DISCLOSURES
The content is solely the responsibility of the authors and does not necessarily represent the official views of the National Institute of Neurological Disorders and Stroke or the National Institutes of Health.
AUTHOR CONTRIBUTIONS
Author contributions: W.A.F., H.P.Z., and A.K. conception and design of research; W.A.F., H.P.Z., and A.K. performed experiments; W.A.F. and A.K. analyzed data; W.A.F. and A.K. interpreted results of experiments; W.A.F. and A.K. prepared figures; W.A.F. drafted manuscript; H.P.Z. and A.K. edited and revised manuscript; H.P.Z. and A.K. approved final version of manuscript.
NOTE ADDED IN PROOF
The following relevant manuscript was published after the present paper was accepted for publication: Hill DN, Curtis JC, Moore JD, Kleinfeld D. Primary motor cortex reports efferent control of vibrissa motion on multiple timescales. Neuron 72: 344–356, 2011.
REFERENCES
- Ahrens KF, Kleinfeld D. Current flow in vibrissa motor cortex can phase-lock with exploratory rhythmic whisking in rat. J Neurophysiol 92: 1700–1707, 2004 [DOI] [PubMed] [Google Scholar]
- Beloozerova IN, Sirota MG, Swadlow HA. Activity of different classes of neurons of the motor cortex during locomotion. J Neurosci 23: 1087–1097, 2003 [DOI] [PMC free article] [PubMed] [Google Scholar]
- Berg RW, Kleinfeld D. Vibrissa movement elicited by rhythmic electrical microstimulation to motor cortex in the aroused rat mimics exploratory whisking. J Neurophysiol 90: 2950–2963, 2003 [DOI] [PubMed] [Google Scholar]
- Bermejo R, Harvey M, Gao P, Zeigler HP. Conditioned whisking in the rat. Somatosens Mot Res 13: 225–233, 1996 [DOI] [PubMed] [Google Scholar]
- Bermejo R, Houben D, Zeigler HP. Optoelectronic monitoring of individual whisker movements in rats. J Neurosci Methods 83: 89–96, 1998 [DOI] [PubMed] [Google Scholar]
- Bosman LW, Houweling AR, Owens CB, Tanke N, Shevchouk OT, Rahmati N, Teunissen WH, Ju C, Gong W, Koekkoek SK, De Zeeuw CI. Anatomical pathways involved in generating and sensing rhythmic whisker movements. Front Integr Neurosci 5: 53, 2011 [DOI] [PMC free article] [PubMed] [Google Scholar]
- Brecht M, Preilowski B, Merzenich MM. Functional architecture of the mystacial vibrissae. Behav Brain Res 84: 81–97, 1997 [DOI] [PubMed] [Google Scholar]
- Brecht M, Schneider M, Sakmann B, Margrie TW. Whisker movements evoked by stimulation of single pyramidal cells in rat motor cortex. Nature 427: 704–710, 2004 [DOI] [PubMed] [Google Scholar]
- Carvell GE, Miller SA, Simons DJ. The relationship of vibrissal motor cortex unit activity to whisking in the awake rat. Somatosens Mot Res 13: 115–127, 1996 [DOI] [PubMed] [Google Scholar]
- Carvell G, Simons DJ. Biometric analyses of vibrissal tactile discrimination in the rat. J Neurosci 10: 2638–2648, 1990 [DOI] [PMC free article] [PubMed] [Google Scholar]
- Carvell GE, Simons DJ. Task- and subject-related differences in sensorimotor behavior during active touch. Somatosens Mot Res 12: 1–9, 1995 [DOI] [PubMed] [Google Scholar]
- Castro-Alamancos MA. Vibrissa myoclonus (rhythmic retractions) driven by resonance of excitatory networks in motor cortex. J Neurophysiol 96: 1691–1698, 2006 [DOI] [PubMed] [Google Scholar]
- Cheney PD, Fetz EE. Functional classes of primate corticomotoneuronal cells and their relation to active force. J Neurophysiol 44: 773–791, 1980 [DOI] [PubMed] [Google Scholar]
- Courtine G, Gerasimenko Y, van den Brand R, Yew A, Musienko P, Zhong H, Song B, Ao Y, Ichiyama RM, Lavrov I, Roy RR, Sofroniew MV, Edgerton VR. Transformation of nonfunctional spinal circuits into functional states after the loss of brain input. Nat Neurosci 12: 1333–1342, 2009 [DOI] [PMC free article] [PubMed] [Google Scholar]
- Cramer NP, Keller A. Cortical control of a whisking central pattern generator. J Neurophysiol 96: 209–217, 2006 [DOI] [PMC free article] [PubMed] [Google Scholar]
- Cramer NP, Li Y, Keller A. The whisking rhythm generator: a novel mammalian network for the generation of movement. J Neurophysiol 97: 2148–2158, 2007 [DOI] [PMC free article] [PubMed] [Google Scholar]
- Dauvergne C, Ndiaye A, Buisseret-Delmas C, Buisseret P, Vanderwerf F, Pinganaud G. Projections from the superior colliculus to the trigeminal system and facial nucleus in the rat. J Comp Neurol 478: 233–247, 2004 [DOI] [PubMed] [Google Scholar]
- Dorfl J. The musculature of the mystacial vibrissae of the white rat. J Anat 135: 147–154, 1982 [PMC free article] [PubMed] [Google Scholar]
- Fetz EE. Volitional control of neural activity: implications for brain-computer interfaces. J Physiol 579: 571–579, 2007 [DOI] [PMC free article] [PubMed] [Google Scholar]
- Friedman WA, Jones LM, Cramer NP, Kwegyir-Afful EE, Zeigler HP, Keller A. Anticipatory activity of motor cortex in relation to rhythmic whisking. J Neurophysiol 95: 1274–1277, 2006 [DOI] [PMC free article] [PubMed] [Google Scholar]
- Ganguly K, Kleinfeld D. Goal-directed whisking increases phase-locking between vibrissa movement and electrical activity in primary sensory cortex in rat. Proc Natl Acad Sci USA 101: 12348–12353, 2004 [DOI] [PMC free article] [PubMed] [Google Scholar]
- Gao P, Ploog BO, Zeigler HP. Whisking as a “voluntary” response: operant control of whisking parameters and effects of whisker denervation. Somatosens Mot Res 20: 179–189, 2003 [DOI] [PubMed] [Google Scholar]
- Grant RA, Mitchinson B, Fox CW, Prescott TJ. Active touch sensing in the rat: anticipatory and regulatory control of whisker movements during surface exploration. J Neurophysiol 101: 862–874, 2009 [DOI] [PMC free article] [PubMed] [Google Scholar]
- Grillner S, Georgopoulos AP, Jordan LM. Selection and initiation of motor behavior. In: Neurons, Networks, and Motor Behavior, edited by Stein PS, Grillner S, Selverston AI, Stuart DG. Cambridge, MA: MIT Press, 1997 [Google Scholar]
- Grinevich V, Brecht M, Osten P. Monosynaptic pathway from rat vibrissa motor cortex to facial motor neurons revealed by lentivirus-based axonal tracing. J Neurosci 25: 8250–8258, 2005 [DOI] [PMC free article] [PubMed] [Google Scholar]
- Guic-Robles E, Jenkins WM, Bravo H. Vibrissal roughness discrimination is barrelcortex-dependent. Behav Brain Res 48: 145–152, 1992 [DOI] [PubMed] [Google Scholar]
- Guic-Robles E, Valdivieso C, Guajardo G. Rats can learn a roughness discrimination using only their vibrissal system. Behav Brain Res 31: 285–289, 1989 [DOI] [PubMed] [Google Scholar]
- Haidarliu S, Simony E, Golomb D, Ahissar E. Muscle architecture in the mystacial pad of the rat. Anat Rec (Hoboken) 293: 1192–1206, 2010 [DOI] [PubMed] [Google Scholar]
- Haiss F, Schwarz C. Spatial segregation of different modes of movement control in the whisker representation of rat primary motor cortex. J Neurosci 25: 1579–1587, 2005 [DOI] [PMC free article] [PubMed] [Google Scholar]
- Harvey MA, Bermejo R, Zeigler HP. Discriminative whisking in the head-fixed rat: optoelectronic monitoring during tactile detection and discrimination tasks. Somatosens Mot Res 18: 211–222, 2001 [DOI] [PubMed] [Google Scholar]
- Hattox A, Li Y, Keller A. Serotonin regulates rhythmic whisking. Neuron 39: 343–352, 2003 [DOI] [PubMed] [Google Scholar]
- Hattox AM, Priest CA, Keller A. Functional circuitry involved in the regulation of whisker movements. J Comp Neurol 442: 266–276, 2002 [DOI] [PMC free article] [PubMed] [Google Scholar]
- Hentschke H, Haiss F, Schwarz C. Central signals rapidly switch tactile processing in rat barrel cortex during whisker movements. Cereb Cortex 16: 1142–1156, 2006 [DOI] [PubMed] [Google Scholar]
- Hill DN, Bermejo R, Zeigler HP, Kleinfeld D. Biomechanics of the vibrissa motor plant in rat: rhythmic whisking consists of triphasic neuromuscular activity. J Neurosci 28: 3438–3455, 2008 [DOI] [PMC free article] [PubMed] [Google Scholar]
- Jackson A, Mavoori J, Fetz EE. Correlations between the same motor cortex cells and arm muscles during a trained task, free behavior, and natural sleep in the macaque monkey. J Neurophysiol 97: 360–374, 2007 [DOI] [PubMed] [Google Scholar]
- Jarvis MR, Mitra PP. Sampling properties of the spectrum and coherency of sequences of action potentials. Neural Comput 13: 717–749, 2001 [DOI] [PubMed] [Google Scholar]
- Jin TE, Witzemann V, Brecht M. Fiber types of the intrinsic whisker muscle and whisking behavior. J Neurosci 24: 3386–3393, 2004 [DOI] [PMC free article] [PubMed] [Google Scholar]
- Kilner JM, Alonso-Alonso M, Fisher R, Lemon RN. Modulation of synchrony between single motor units during precision grip tasks in humans. J Physiol 541: 937–948, 2002 [DOI] [PMC free article] [PubMed] [Google Scholar]
- Kleinfeld D, Deschenes M. Neuronal basis for object location in the vibrissa scanning sensorimotor system. Neuron 72: 455–468, 2011 [DOI] [PMC free article] [PubMed] [Google Scholar]
- Krupa DJ, Matell MS, Brisben AJ, Oliveira LM, Nicolelis MA. Behavioral properties of the trigeminal somatosensory system in rats performing whisker-dependent tactile discriminations. J Neurosci 21: 5752–5763, 2001 [DOI] [PMC free article] [PubMed] [Google Scholar]
- Kwegyir-Afful EE, Keller A. Response properties of whisker-related neurons in rat second somatosensory cortex. J Neurophysiol 92: 2083–2092, 2004 [DOI] [PMC free article] [PubMed] [Google Scholar]
- Mehring C, Rickert J, Vaadia E, Cardosa de Oliveira S, Aertsen A, Rotter S. Inference of hand movements from local field potentials in monkey motor cortex. Nat Neurosci 6: 1253–1254, 2003 [DOI] [PubMed] [Google Scholar]
- Mitchinson B, Arabzadeh E, Diamond ME, Prescott TJ. Spike-timing in primary sensory neurons: a model of somatosensory transduction in the rat. Biol Cybern 98: 185–194, 2008 [DOI] [PubMed] [Google Scholar]
- Miyashita E, Mori S. The superior colliculus relays signals descending from the vibrissal motor cortex to the facial nerve nucleus in the rat. Neurosci Lett 195: 69–71, 1995 [DOI] [PubMed] [Google Scholar]
- Nguyen QT, Kleinfeld D. Positive feedback in a brainstem tactile sensorimotor loop. Neuron 45: 447–457, 2005 [DOI] [PubMed] [Google Scholar]
- Polley DB, Rickert JL, Frostig RD. Whisker-based discrimination of object orientation determined with a rapid training paradigm. Neurobiol Learn Mem 83: 134–142, 2005 [DOI] [PubMed] [Google Scholar]
- Rickert J, Oliveira SC, Vaadia E, Aertsen A, Rotter S, Mehring C. Encoding of movement direction in different frequency ranges of motor cortical local field potentials. J Neurosci 25: 8815–8824, 2005 [DOI] [PMC free article] [PubMed] [Google Scholar]
- Sanderson KJ, Welker W, Shambes GM. Reevaluation of motor cortex and of sensorimotor overlap in cerebral cortex of albino rats. Brain Res 292: 251–260, 1984 [DOI] [PubMed] [Google Scholar]
- Scott SH. The role of primary motor cortex in goal-directed movements: insights from neurophysiological studies on non-human primates. Curr Opin Neurobiol 13: 671–677, 2003 [DOI] [PubMed] [Google Scholar]
- Shuler MG, Krupa DJ, Nicolelis MA. Integration of bilateral whisker stimuli in rats: role of the whisker barrel cortices. Cereb Cortex 12: 86–97, 2002 [DOI] [PubMed] [Google Scholar]
- Tanji J, Evarts EV. Anticipatory activity of motor cortex neurons in relation to direction of an intended movement. J Neurophysiol 39: 1062–1068, 1976 [DOI] [PubMed] [Google Scholar]
- Thach WT. Correlation of neural discharge with pattern and force of muscular activity, joint position and direction of intended next movement in motor cortex and cerebellum. J Neurophysiol 41: 654–676, 1978 [DOI] [PubMed] [Google Scholar]
- Towal RB, Hartmann MJ. Right-left asymmetries in the whisking behavior of rats anticipate head movements. J Neurosci 26: 8838–8846, 2006 [DOI] [PMC free article] [PubMed] [Google Scholar]
- Towal RB, Hartmann MJ. Variability in velocity profiles during free-air whisking behavior of unrestrained rats. J Neurophysiol 100: 740–752, 2008 [DOI] [PubMed] [Google Scholar]
- Voigts J, Sakmann B, Celikel T. Unsupervised whisker tracking in unrestrained behaving animals. J Neurophysiol 100: 504–515, 2008 [DOI] [PubMed] [Google Scholar]
- Wineski LE. Facial morphology and vibrissal movement in the golden hamster. J Morphol 183: 199–217, 1985 [DOI] [PubMed] [Google Scholar]