Abstract
Objectives
There is currently no widely available, minimally invasive first-level examination that allows physicians to identify soft-tissue lesions that are likely to be malignant. The aim of this pilot study was to explore the potential suitability of dynamic contrast-enhanced ultrasound (DCE-US) for this purpose.
Materials and methods
23 patients were referred to the Veneto Oncological Institute for work-up of superficial soft-tissue lesions. Fourteen lesions were examined with CEUS and enhancement kinetics was analyzed. Subsequently, all lesions were surgically removed and subjected to histological analysis.
Results
The 14 lesions included in the study were histologically classified as malignant (n = 7) or benign (n = 7, including 3 schwannomas). A statistically significant difference between benign and malignant lesions was found in terms of mean times to peak enhancement intensity (p = 0.03) but not mean filling times (FT). When schwannomas were analyzed as a separate group, their mean FT was found to be significantly different from that of the other benign lesions (p = 0.001) and from that of the group comprising other benign lesions as well as malignant lesions (p < 0.005).
Conclusions
CEUS with analysis of contrast-enhancement kinetics is a relatively low-cost, minimally invasive imaging technique, which appears to be a potentially effective first-level method for identifying suspicious soft-tissue masses.
Keywords: Sarcoma, Soft tissue tumors, Ultrasonography, Contrast-enhanced ultrasound
Riassunto
Obiettivi
Allo stato dell’arte manca un esame di primo livello, facilmente disponibile e minimamente invasivo che permetta di individuare le lesioni sospette di malignità dei tessuti molli. Scopo di questo studio pilota è fornire primissime indicazioni di valore esplorativo sulle capacità dell’ecografia con mezzo di contrasto (CEUS) di identificare le lesioni sospette sulla base della cinetica contrastografica.
Materiali e metodi
23 pazienti con lesioni dei tessuti molli superficiali inviati dall’Istituto Oncologico Veneto sono stati sottoposti a CEUS e studio della cinetica ecocontrastografica; tutte le lesioni sono state sottoposte ad escissione chirurgica ed analisi istologica.
Risultati
Su 14 lesioni incluse nello studio (7 maligne, 3 schwannomi, 4 benigne), la differenza del time-to-peak medio tra quelle maligne e benigne, diversamente dal Filling-Time (FT), è risultata statisticamente significativa (p = 0.03).
Considerando gli schwannomi come gruppo a parte, si registrano differenze statisticamente significative per i valori di FT tra gli schwannomi e le altre lesioni benigne (p = 0.001) e tra le lesioni benigne e quelle maligne (p < 0.005).
Conclusioni
L’analisi della cinetica ecocontrastografica sembra poter permettere di riconoscere le lesioni sospette già con un’indagine di primo livello, relativamente poco invasiva ed economica.
Introduction
The term soft-tissue sarcoma (STS) is used to describe all malignant, non-epithelial tumors involving extra-skeletal, extra-cranial tissues, including those of the central nervous system but not those derived from the lympho-hematopoietic or histiocytic-macrophagic cells [1]. Benign mesenchymal lesions are approximately 100 times more common than STSs, which account for less than 1 % of all malignant neoplasms [2–4]. The suspicion of malignancy is based predominantly on clinical features of the lesion (presence of symptoms, diameters of > 5 cm, deep rather than superficial location, new onset, progressive enlargement) [5]. Imaging studies are indicated to confirm the presence of the mass and evaluate size and other features relevant for biopsy and surgical procedures. They can also be useful for assessing changes in the size of lesions after neoadjuvant/adjuvant therapy [6]. The radiological work-up begins with B-mode ultrasonography and standard radiography. If malignancy is suspected, magnetic resonance (MR) (or computed tomography if the latter is contraindicated) should be performed with contrast-enhancement. In some cases (one-fourth to one-third of all STSs), the lesion can be classified as benign or malignant on the basis of imaging findings (margin definition, perilesional edema, involvement of bone or neurovascular structures, characteristics and homogeneity of T1 and T2-weighted signal intensity on MR, contrast-enhancement patterns) [7, 8].
We conducted an exploratory pilot study to evaluate the potential and limitations of dynamic contrast-enhanced ultrasound (DCE-US) in the diagnosis of soft-tissue lesions. Qualitative and quantitative data obtained with the study method were correlated with findings at surgical pathology.
There are currently no validated DCE-US criteria for distinguishing benign and malignant soft-tissue masses (unlike those for lymphadenopathy [9]). Our objective was to identify at least one DCE-US parameter whose assessment would allow more accurate differentiation of soft-tissue lesions that are probably benign (and can therefore be managed with monitoring alone) from those likely to be malignant, which require additional diagnostic studies.
Materials and methods
Patient selection
Between January 2011 and May 2012, the Melanoma and Soft-tissue Sarcoma Group of the Istituto Oncologico Veneto referred 23 patients to our research group for radiological work-up of suspected soft-tissue masses. The criteria for inclusion in the study population were as follows:
age > 18 years;
findings on physical examination of a superficial soft-tissue mass, which were suspected to be malignant or whose nature could not be determined without further study;
lesion diameter < 10 cm,
no pathologic diagnosis at the time of our examination.
Nine of the 23 patients were excluded from the study population for various reasons:
5 had other tumor-like lesions (proliferative synovitis, articular ganglia, vascular lesions) instead of soft-tissue lesions;
2 had soft-tissue lesions that exceeded the predefined size cut-off;
2 were unable to remain sufficiently immobile for the duration of the examination.
The study population thus consisted of 14 patients (4 men, 10 women) with superficial soft-tissue lesions. Their ages ranged from 20 to 85 years (mean 54.2 years; median 58 years). During the study, there were no episodes of intolerance or adverse reactions to the sonographic contrast agent used.
CEUS
Prior to undergoing CEUS, all 14 patients provided written, informed consent to the examination itself and to use of the data for research purposes with appropriate safeguards of their right to privacy. Before the examination, a 20-G intravenous catheter was inserted in a peripheral vein of the antecubital fossa contralateral to the side of the body where the lesion was located. The line was kept open with a slow infusion of normal saline.
All examinations were performed by the same operator using a MyLab 25 Xvision ultrasound scanner (Esaote, Genoa, Italy) and a 5.0–7.5 MHz linear array transducer. The examinations began with B-mode scans to define the lesion and select an optimal scanning plane for the contrast-enhanced examination (i.e., one that contained no macroscopic vessels or areas of frank necrosis). At this point, a 4.8-ml bolus of SonoVue® (Bracco), which consists of a suspension of sulfur hexafluoride microbubbles at a concentration of 8 μl/ml, was rapidly injected, and the line was flushed with a 10 ml bolus of normal saline. The lesions were not evaluated with color or power Doppler imaging, because the microvasculature of the lesions cannot be visualized with these techniques.
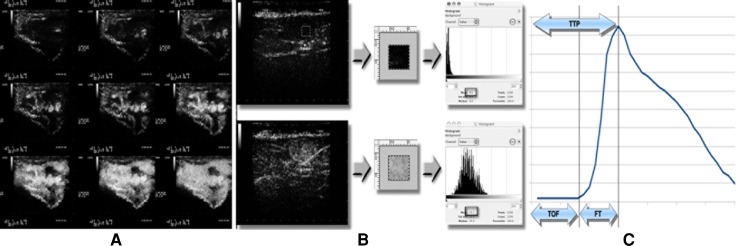
For the first 2 min after the SonoVue® injection, the transducer was maintained in a fixed position over the lesion, and the results were filmed with time codes showing the number of seconds that had passed since the beginning of the injection (Fig. 1a). Each examination included qualitative (lesion morphology, echogenicity and echo structure, relations with adjacent anatomic structures, perfusion kinetics, i.e., enhancement intensity and homogeneity) and quantitative (lesion size, temporal characteristics of perfusion kinetics) components.
Fig. 1.
Example of a CEUS examination of a soft-tissue mass. a Patient with soft-tissue metastases: representative images from various contrast-enhancement phase. b Selection of an ROI (0.25 cm × 0.25 cm) in CEUS image that is representative of the lesion. c Contrast-enhancement parameters extrapolated from the time–enhancement intensity curve
Quantitative software-assisted analysis
A series of static frames in the Joint Photographic Experts Group (JPEG) format were extracted from the audio video interleave (AVI) recording of each examination (one frame for each second of the recording).
With the aid of free, open-source image manipulation software (GIMP-GNU Image Manipulation Program), an identical square-shaped region of interest (ROI) (0.25 × 0.25 cm) was defined in each frame that contained the area of the lesion with maximal contrast-enhancement homogeneity and few or no avascular areas or large intralesional blood vessels (the latter being nonrepresentative of the parenchymal tissue being investigated).
The intensity of the contrast-enhanced ultrasound signal within the ROI was computed by measuring the mean gray level in the image analysis histogram (Fig. 1b). The result, expressed in terms of video intensity units (VIU, range 0–255), was recorded on a spread-sheet together with the time of image acquisition. For each lesion, a time–enhancement intensity curve was then plotted and the following variables were extrapolated: contrast-medium arrival time (time of flight, TOF), time to peak enhancement (TTP), and lesion filling time (FT), which was calculated according to the following formula: FT = TTP − TOF) (Fig. 1c). Software analysis of each recording required an average of 10 min.
Pathology evaluation of the lesion
Each lesion included in the study was surgically excised and submitted to the Institute of Pathology for histological assessment. On the basis of the pathology report, the lesions were classified as malignant or benign. Within the latter group, we also distinguished schwannomas from other types of benign tumors.
Statistical analysis
Mean TOF, TTP and FT values for lesion groups and subgroups were compared with Student’s T test for unpaired data with an α level of 0.05.
Results
On the basis of surgical histology, 7 of the lesions as malignant were classified as malignant and 7 as benign (including 3 schwannomas). There were no significant differences between the ages of the patients in these groups (Table 1). All 7 benign lesions presented homogeneous contrast-enhancement patterns, whereas some of the malignant lesions contained areas that were non-vascularized.
Table 1.
Characteristics of the study population
| Patient ID | Sex | Age | Histologic diagnosis of soft-tissue lesion | CEUS features of soft-tissue lesion | |
|---|---|---|---|---|---|
| Contrast-enhancement intensity | Homogeneity | ||||
| 1 | F | 85 | Metastasis (renal cell cancer) | Moderate | Yes |
| 2 | M | 80 | Sarcoma NOS | Moderate | No |
| 3 | F | 60 | Liposarcoma | Moderate | Yes |
| 4 | F | 37 | Sarcoma NOS | High | No |
| 5 | F | 20 | Synovial sarcoma | High | Yes |
| 6 | M | 33 | Fibromyxoid sarcoma | Low | No |
| 7 | F | 64 | Lymphoma | High | No |
| 8 | F | 54 | Schwannoma | Moderate | Yes |
| 9 | F | 46 | Schwannoma | Moderate | Yes |
| 10 | F | 72 | Schwannoma | Moderate | Yes |
| 11 | M | 32 | Angioleiomyoma | Moderate | Yes |
| 12 | F | 60 | Lipoma | Low | Yes |
| 13 | M | 56 | Lipoma | Low | Yes |
| 14 | F | 60 | Lipoma | Low | Yes |
NOS not otherwise specified
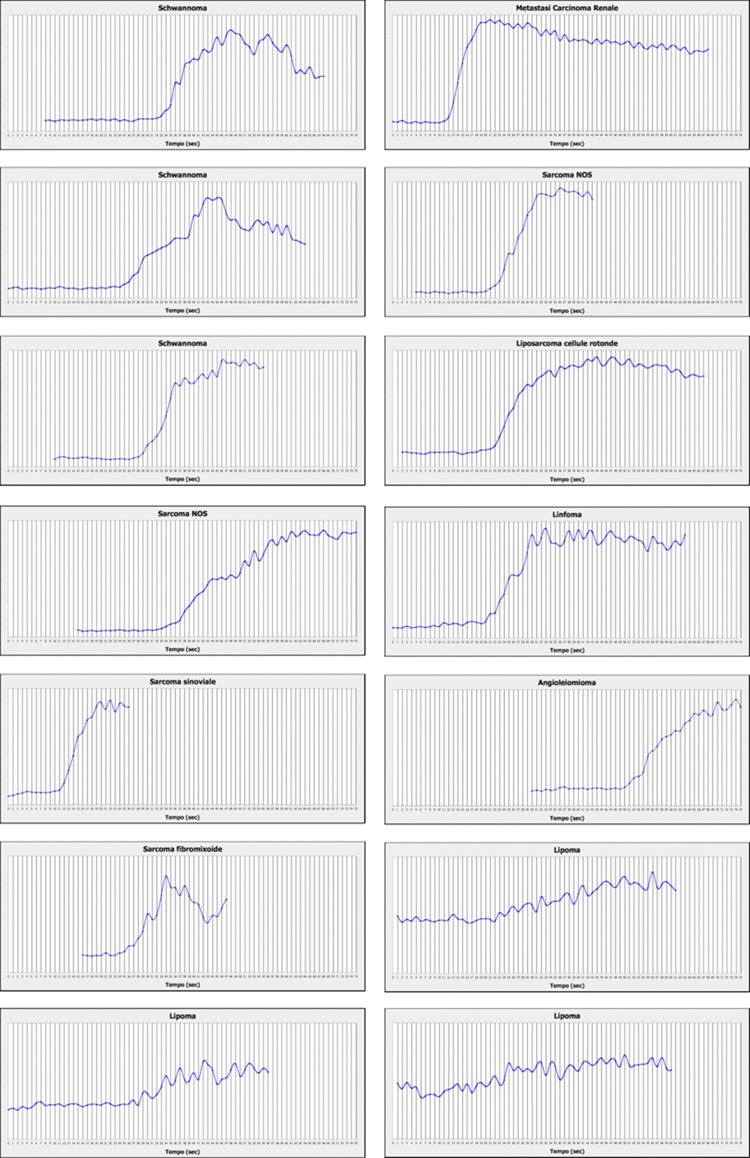
Figure 2 shows the time-enhancement intensity curves for each lesion examined. The parameters extrapolated from these curves are summarized in Table 2.
Fig. 2.
Graphs showing contrast-enhancement kinetics of the soft-tissue lesions
Table 2.
Acoustic contrast-enhancement kinetic parameters assessed
| Patient ID | Histologic diagnosis | DCE-US | ||
|---|---|---|---|---|
| TOF (s) | TTP (s) | FT (s) | ||
| A. Malignant lesions | ||||
| 1 | Metastasis (renal cell cancer) | 13 | 21 | 8 |
| 2 | Sarcoma | 22 | 32 | 10 |
| 3 | Liposarcoma | 23 | 40 | 17 |
| 4 | Sarcoma | 34 | 57 | 23 |
| 5 | Synovial sarcoma | 12 | 20 | 8 |
| 6 | Fibromyxoid sarcoma | 24 | 35 | 11 |
| 7 | Lymphoma | 21 | 33 | 12 |
| Mean | 21.3 | 34 | 12.7 | |
| Standard deviation | 7.4 | 12.5 | 5.5 | |
| B. Benign lesions | ||||
| 8 | Schwannoma | 29 | 38 | 9 |
| 9 | Schwannoma | 35 | 48 | 13 |
| 10 | Schwannoma | 26 | 42 | 16 |
| 11 | Angioleiomyoma | 50 | 75 | 25 |
| 12 | Lipoma | 23 | 50 | 27 |
| 13 | Lipoma | 27 | 45 | 18 |
| 14 | Lipoma | 24 | 50 | 26 |
| Mean | 30.6 | 49.7 | 19.1 | |
| Standard deviation | 9.4 | 12 | 7 | |
| C. Malignant lesions and schwannomas | ||||
| 1 | Metastasis (renal cell cancer) | 13 | 21 | 8 |
| 2 | Sarcoma | 22 | 32 | 10 |
| 3 | Liposarcoma | 23 | 40 | 17 |
| 4 | Sarcoma | 34 | 57 | 23 |
| 5 | Synovial sarcoma | 12 | 20 | 8 |
| 6 | Fibromyxoid sarcoma | 24 | 35 | 11 |
| 7 | Lymphoma | 21 | 33 | 12 |
| 8 | Schwannoma | 29 | 38 | 9 |
| 9 | Schwannoma | 35 | 48 | 13 |
| 10 | Schwannoma | 26 | 42 | 16 |
| Mean | 22.9 | 36.6 | 12.7 | |
| Standard deviation | 7.7 | 11.3 | 4.8 | |
| D. Separate analyses of schwannomas and other benign lesions | ||||
| 11 | Angioleiomyoma | 50 | 75 | 25 |
| 12 | Lipoma | 23 | 50 | 27 |
| 13 | Lipoma | 27 | 45 | 18 |
| 14 | Lipoma | 24 | 50 | 26 |
| Mean | 31 | 55 | 24 | |
| Standard deviation | 9.4 | 12 | 7 | |
| 8 | Schwannoma | 29 | 38 | 9 |
| 9 | Schwannoma | 35 | 48 | 13 |
| 10 | Schwannoma | 26 | 42 | 16 |
| Mean | 30 | 42.7 | 12.7 | |
| Standard deviation | 4.6 | 5 | 3.5 | |
Statistical analysis of these data revealed that:
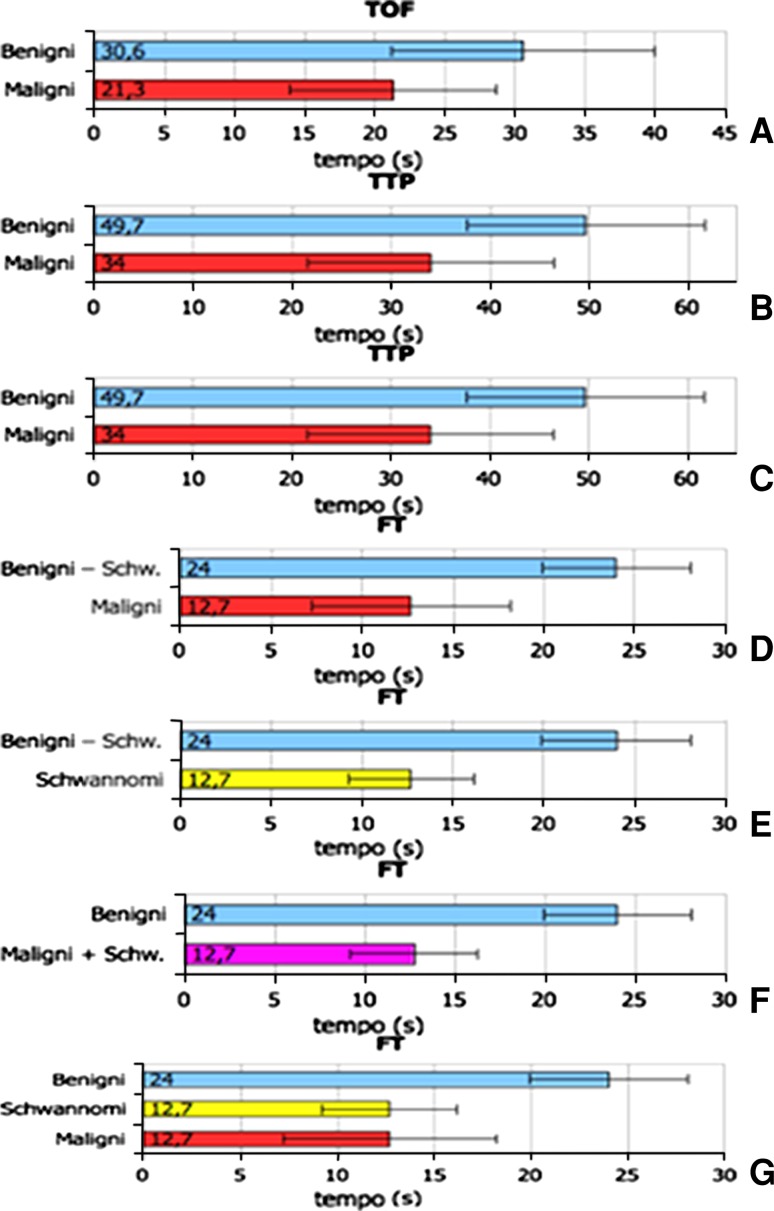
the mean TOF for the malignant tumors was shorter than that of the benign lesions [malignant vs. benign: 21.3 ± 7.4 vs. 30.6 ± 9.4 s (mean ± standard deviation)] although this difference was not statistically significant (p = 0.06) (Fig. 3a);
there was a significant difference between the mean TTPs of these two groups (malignant vs. benign: 34 ± 12.4 vs. 49.7 ± 12 s; p = 0.03) (Fig. 3b);
the mean FTs for the malignant and benign lesions (12.7 ± 5.5 vs. 19.1 ± 7 s) were not significantly different (p = 0.08) (Fig. 3c; Table 2a, b).
Fig. 3.
Intergroup comparisons of mean (SD) TOF, TTP and FT values. a Mean TOF ± SD in benign vs. malignant tumors. b Mean TTP ± SD in benign vs. malignant tumors. c Mean FT ± SD in benign vs. malignant tumors. d Mean FT ± SD in benign non-Schwann-cell tumors vs. malignant tumors. e Mean FT ± SD in benign non-Schwann-cell tumors vs. schwannomas. f Mean FT ± SD in schwannomas vs. benign non-Schwann-cell tumors vs. malignant tumors g. Mean FT ± SD in benign non-Schwann-cell tumors vs. malignant tumors + schwannomas
We then analyzed the schwannomas separately from the other benign lesions, comparing their mean TOF, TTP and FT values with those of the other two groups (Table 2b, c). This analysis revealed statistically significant differences between the mean FTs of the following groups:
malignant tumors vs. the non-schwannoma subset of benign tumors (12.7 ± 5.5 vs. 24 ± 4.1 s; p = 0.006) (Fig. 3d);
schwannomas vs. the non-schwannoma subset of benign tumors (12.7 ± 3.5 vs. 24 ± 4.1 s; p = 0.001) (Fig. 3e).
We then combined schwannomas and malignant tumors into a single group and compared it with the group of benign non-Schwann cell tumors. Once again, a significant difference was observed between the mean FT values of the two groups (malignant tumors + schwannomas vs. benign tumors: 12.7 ± 4.8 vs. 24 ± 4.1 s; p = 0.001) (Table 2d; Fig. 3f).
Discussion
Analysis of the TTP data and to a lesser extent the TOF values revealed differences in the enhancement kinetics of the benign and malignant soft-tissue lesions. The TTP of the malignant tumors was significantly shorter than that of the benign lesions, and in terms of the FT, the behavior of the schwannomas was almost identical to that of the malignant lesions (Fig. 3g). Although schwannomas are rarely malignant, surgical excision is usually required to eliminate the nerve irritation and compression they cause. The FT recorded during dynamic CEUS, thus, appears to be able to distinguish soft-tissue lesions that will probably require surgery, especially when they are characterized by inhomogeneous contrast-enhancement.
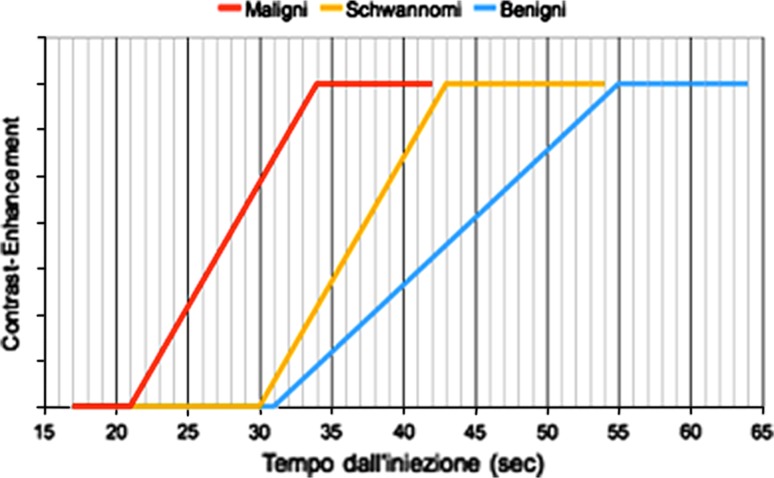
Based on the CEUS parameters we analyzed, the behaviors of the three categories of soft-tissue lesions can be summarized in the following hypothetical model:
Contrast-enhancement of malignant lesions seems to begin and plateau earlier than it does in benign lesions (including schwannomas).
Malignant lesions and schwannomas are similar in terms of the kinetics of contrast-medium accumulation within their parenchymas.
On the basis of the considerations discussed above, the enhancement kinetics summarized in the model illustrated in Fig. 4 might conceivably be used to orient the diagnosis of soft-tissue masses.
Fig. 4.
Hypothetical model of contrast-enhancement kinetics in the three groups of soft-tissue lesions
The first objective of this study was to develop a diagnostic instrument that could be used to study the lesional microcirculation and contrast-enhancement kinetics of soft-tissue tumors. To minimize operator-dependency, we examined all lesions with an identical 0.25-cm2 ROI placed over the parenchymal zone with maximal sonographic homogeneity. Blood vessels and avascular zones were avoided as non-representative.
According to Gauthier et al. [10], reliable quantitative analysis of dynamic CE-US data can be based on linear data analyzed with commercial software furnished by the manufacturer of the US system or the compression algorithm used by each scanner can be experimentally derived from repeated in vitro measurements made under controlled conditions and the inverse algorithm applied to the compressed data.
In the present study, we did not have access to the logarithmic compression algorithm or to crude data furnished by the scanner or to commercial software that would allow us to extrapolate them. We were, thus, obliged to use free software to analyze the time-intensity curves solely in terms of enhancement times since they were derived from log-compressed data.
Compared with the curves we used, analysis of curves derived from crude data would undoubtedly have yielded additional diagnostic elements of importance, including signal intensity-dependent parameters like peak-enhancement intensity and the areas under the curve for the contrast-medium wash-in and wash-out phases. Another limitation of this study involves the size and nature of the sample examined, which is not representative of soft-tissue lesions in the general population since the patients were enrolled in a level 2 health-care center.
In conclusion, our study furnishes preliminary data on the DCE-US features of soft-tissue tumors. The widespread availability of DCE-US and the safety and pharmacodynamic profiles of Sonovue make DCE-US an interesting method for the diagnosis and characterization of tumors that can be visualized sonographically.
DCE-US also offers several unequivocal advantages over other imaging methods (DCE-CT, DCE-MR), such as real-time imaging and relatively low equipment costs. In future studies, we plan to examine a larger sample of lesions and to use crude data to elaborate the contrast-enhancement kinetics curve. This will allow us to validate the findings of the present study, refine the diagnostic approach, and identify additional kinetic parameters whose assessment might increase the diagnostic accuracy of this approach.
Conflict of interest
None.
References
- 1.Della Rocca C, Ninfo V. Patologia dello scheletro e dei tessuti molli. In: Anatomia Patologica la Sistematica. UTET Edizioni Mediche- Torino II, cap. 2008;20:1159–1228. [Google Scholar]
- 2.Zahm SH, Tucker MA, Fraumeni JF., Jr . Soft tissue sarcomas. In: Schottenfeld D, Fraumeni JF Jr, editors. Cancer epidemiology and prevention. 2. New York: Oxford University Press; 1996. pp. 984–999. [Google Scholar]
- 3.Zahm SH, Fraumeni JF., Jr The epidemiology of soft tissue sarcoma. Semin Oncol. 1997;24:504–514. [PubMed] [Google Scholar]
- 4.Fletcher CDM, Unni KK, Mertens F (eds) (2002) World Health Organization. Classification of tumours. In: Pathology and genetics of tumours of soft tissue and bone. IARC Press, Lyon
- 5.Bodner G, Schocke MF, Rachbauer F, et al. Differentiation of malignant and benign musculoskeletal tumors: combined color and power Doppler US and spectral wave analysis. Radiology. 2002;223:410–416. doi: 10.1148/radiol.2232010406. [DOI] [PubMed] [Google Scholar]
- 6.Wu JS, Hochman MG. Soft-tissue tumors and tumorlike lesions: a systematic imaging approach. Radiology. 2009;253:297–316. doi: 10.1148/radiol.2532081199. [DOI] [PubMed] [Google Scholar]
- 7.Soler R, Castro JM, Rodriguez E. Value of MR findings in predicting the nature of the soft tissue lesions: benign, malignant or undetermined lesion? Comput Med Imaging Graph. 1996;20:163–169. doi: 10.1016/0895-6111(96)00049-3. [DOI] [PubMed] [Google Scholar]
- 8.Stramare R, Beltrame V, Gazzola M, Gerardi M, Scattolin G, Coran A, Faccinetto A, Rastrelli M, Riccardo Rossi C. Imaging of soft-tissue tumors. J Magn Reson Imaging. 2012 doi: 10.1002/jmri.23791. [DOI] [PubMed] [Google Scholar]
- 9.Rubaltelli L, Beltrame V, Tregnaghi A, Scagliori E, Frigo AC, Stramare R. Contrast-enhanced ultrasound for characterizing lymph nodes with focal cortical thickening in patients with cutaneous melanoma. AJR Am J Roentgenol. 2011;196(1):W8–W12. doi: 10.2214/AJR.10.4711. [DOI] [PubMed] [Google Scholar]
- 10.Gauthier TP, Averkiou MA, Leen EL. Perfusion quantification using dynamic contrast-enhanced ultrasound: the impact of dynamic range and gain on time-intensity curves. Ultrasonics. 2011;51:102–106. doi: 10.1016/j.ultras.2010.06.004. [DOI] [PubMed] [Google Scholar]


