Abstract
It is important to prevent and improve diabetes mellitus and its complications in a safe and low-cost manner. S-Allyl cysteine, an aged garlic extract with antioxidant activity, was investigated to determine whether S-allyl cysteine can improve type 2 diabetes in Otsuka Long-Evans Tokushima Fatty rats with nonalcoholic fatty liver disease. Male Otsuka Long-Evans Tokushima Fatty rats and age-matched Long-Evans Tokushima Otsuka rats were used and were divided into two groups at 29 weeks of age. S-Allyl cysteine (0.45% diet) was administered to rats for 13 weeks. Rats were killed at 43 weeks of age, and detailed analyses were performed. S-Allyl cysteine improved hemoglobinA1c, blood glucose, triglyceride, and low-density lipoprotein cholesterol levels. Furthermore, S-allyl cysteine normalized plasma insulin levels. S-Allyl cysteine activated the mRNA and protein expression of both peroxisome proliferator-activated receptor α and γ, as well as inhibiting pyruvate dehydrogenase kinase 4 in Otsuka Long-Evans Tokushima Fatty rat liver. Sterol regulatory element-binding protein 1c and forkhead box O1 proteins were normalized by S-allyl cysteine in Otsuka Long-Evans Tokushima Fatty rat liver. In conclusions, these findings support the hypothesis that S-allyl cysteine has diabetic and nonalcoholic fatty liver disease therapeutic potential as a potent regulating agent against lipogenesis and glucose metabolism.
Keywords: diabetes mellitus type 2, S-allyl cysteine, OLETF, PPAR, SREBP-1c
Introduction
In the majority of patients, nonalcoholic fatty liver disease (NAFLD) requires is associated with metabolic risk factors such as obesity, diabetes mellitus, and dyslipidemia. NAFLD is histologically further categorized into nonalcoholic fatty liver (NAFL) and nonalcoholic steatohepatitis (NASH). There is a very high prevalence of NAFLD in individuals with type 2 diabetes mellitus.(1) The incidence of type 2 diabetes mellitus has increased dramatically over the past several decades, and this trend is projected to continue into the foreseeable future. One cause of type 2 diabetes is hepatic glucose metabolism disorder typically caused by liver disorders such as liver cirrhosis and resulting in glucose metabolism disorder throughout the entire body. It has been reported that accumulation of lipids in the liver and skeletal muscle lowers insulin activity, thereby causing impaired glucose tolerance.(2) Furthermore, it is known that glucose tolerance reduces after surgery (surgical diabetes) even in patients without diabetes. Obesity and type 2 diabetes have also been established as a significant risk factor for hepatocellular carcinoma (HCC) in epidemiologic observations and experimental studies.(3,4) Therefore, it is important to control blood glucose levels at all times. Preoperative carbohydrate loading containing glutamate and antioxidants has been reported to attenuate the decline in postoperative insulin sensitivity in humans.(5) Diabetic pathological stress evokes excessive production of inflammatory, oxidative, and even fibrotic molecules. We have also reported that α-tocopherol supplementation(6) and iron depletion(7) improve diabetic complications, as hyperglycemia-derived oxygen free radicals may be mediators of diabetic complications and oxidative stress resulting from an increased generation of reactive oxygen species, which play a crucial role in their pathogenesis.
Garlic (Allium sativum) has been used historically for medicinal purposes, particularly for the treatment of diseases associated with ageing.(8) S-Allyl cysteine (SAC), an aged garlic extract prepared from natural garlic by aging for 20 months to reduce its harsh irritating taste and odor, contains potent antioxidant activity, has a greater concentration of organosulfur compounds, and is a free radical scavenger.(9,10) SAC has been shown to improve blood glucose and pancreatic oxidative stress in streptozotocin (STZ) diabetic rats, a type 1 model.(11,12) SAC and S-propyl cysteine protect STZ-induced nephropathy via nuclear factor kappa B (NFκB)-dependent anti-inflammatory effects.(13) However, it remains unclear if SAC can alleviate fatty liver in type 2 diabetes mellitus. The purpose of this study was to investigate the hepatic protection of SAC in Otsuka Long-Evans Tokushima Fatty (OLETF) rats, a type 2 model, and to evaluate the possible mechanisms of the protective effects. OLETF rats show clinically relevant phenotypes of diabetes such as hyperinsulinemia, hyperglycemia, insulin resistance, hypertriglycemia, mild obesity, and 100% penetrance of diabetes in male OLETF rats of 25 weeks of age. Over 40 weeks of age, OLETF rats gradually become hypoinsulinemia. Nonalcoholic fatty liver disease (NAFLD) in OLETF rats resembles that associated with human obesity. Hepatic steatosis is developed accompanied by a high expression of sterol regulatory element-binding protein 1c (SREBP-1c) levels, fatty acid genes, and cholesterol biosynthesis. We have thus evaluated whether SAC regulates proteins and gene expressions such as SREBP-1c and peroxisome proliferators-activated receptor (PPARs) in the liver.
Materials and Methods
Animals
Male OLETF rats (aged 4 weeks) and age-matched Long-Evans Tokushima Otsuka (LETO) rats were obtained from the Animal Center at the Tokushima Research Institute (Otsuka Pharmaceutical, Tokushima, Japan) and maintained until they reached an appropriate age for the experiment. The rats had free access to standard laboratory chow (MF; Oriental Yeast, Tokyo, Japan) and tap water and were cared for under the specifications outlined in the Guiding Principles for the Care and Use of Laboratory Animals—approved by the Authorities of the Local Committee on Experimental Animal Research in Osaka City University. At 29 weeks, the LETO (n = 6) and OLETF (n = 6) rats were fed control chow and divided into 4 groups [control: n = 6 (LETO), SAC diet: n = 5 (LETO-SAC), n = 6 (OLETF), SAC diet: n = 5 (OLETF-SAC)] after checking the body weight of all rats. SAC (Wako Pure Chem. Ind. Ltd., Osaka, Japan) was given via a 0.45% dietary mixture (Oriental Yeast) from 29 weeks of age. Animals were killed at 43 weeks of age under anesthesia with urethane (5 g/kg, i.p.). Blood was collected with heparinized syringes, and tissues were dissected out and frozen in liquid nitrogen. Plasma samples were obtained by centrifugation at 12,000 g for 5 min. A small piece of tissue was removed for morphometric, immunohistochemical, or biochemical analysis.
Biochemical measurements
Blood glucose levels were measured immediately after sampling with a glucose test meter (Glutest Ace; Sanwa Kagaku Kenkyusyo, Nagoya, Japan). Total cholesterol and triglyceride levels were determined with commercially available kits (Wako Pure Chem. Ind. Ltd.). Plasma insulin levels were determined using a supersensitive rat insulin ELISA kit (Morinaga Institute of Biological Science, Yokohama, Japan). Lipid peroxidation is used as an indicator of oxidative stress in plasma and tissues. Malonaldehyde (MDA) and 4-hydroxyalkenals have been measured as an indicator of lipid peroxidation by using LPO-586 (Oxis International Inc., Beverly Hills, CA).
Immunoblot analysis for SREBP-1, PPAR-α, PPAR-γ, PDK4, and FoxO1
The tissues (100 mg) were homogenized and sonicated in 0.3 ml of 10 mM Tris-HCl (pH 7.4) containing 150 mM NaCl, 1% NP-40, 1% sodium deoxycholate, 0.1% sodium dodecyl sulfate (SDS), 5 mM ethylenediaminetetraacetic acid (EDTA), 25 mM β-glycerophosphate, 1 mM Na3VO4, 50 mM NaF, 0.2 mM tosyl phenylalanyl chloromethyl ketone (TPCK), 0.1 mM N-α-tosyl-l-lysine chloromethyl ketone (TLCK), and a protease inhibitor cocktail tablet (Roche Diagnostics, Mannheim, Germany). Homogenates were centrifuged at 12,000 g for 20 min. The supernatants were used to detect SREBP-1, pyruvate dehydrogenase kinase 4 (PDK4) (Abcam, Cambridge, UK), and FoxO1 (Cell Signaling Technology, Inc., Danvers, MA) and were separated on SDS–polyacrylamide gels and transferred to polyvinylidene fluoride membranes (Immobilon-PSQ; Millipore, Billerica, MA). Nuclear proteins of the tissues were extracted using NE-PER Nuclear and Cytoplasmic Extraction Reagents (Pierce Biotechnology Inc., Rockford, IL). Nuclear and cytosol proteins (15–20 µg) were analyzed by immunoblotting for PPAR-α and PPAR-γ (Cell Signaling Technology, Inc.) as described above.
Membranes were blocked for 30 min at room temperature in 4% Block Ace (DS Pharma Biomedical, Osaka, Japan) and then incubated with an antibody (Abcam K.K., Tokyo, Japan) at 4°C overnight. The membranes were washed in tris buffered saline-tween-20 (TBS-T) and incubated with a secondary antibody conjugated with horseradish peroxidase (Amersham Biosciences) for 1.5 h at room temperature. After washing again in TBS-T, the membranes were exposed to an enhanced chemiluminescence blotting substrate (ECL+, Amersham Biosciences). Immunobloting of PDK4 (Abcam) and FoxO1 in the cytosol (Cell Signaling Technology, Inc.) was conducted using rabbit or mouse streptavidin–biotin–peroxidase kits (Vectastain Universal Elite ABC Kit; Vector Laboratories, Burlingame, CA).
Protein bands were quantified using a luminous image analyzer (LAS-3000 imaging system; Fujifilm, Tokyo, Japan) to produce digital images, which were then analyzed with Multi Gauge ver. 3.0 (Fujifilm).
Liver histology
Tissue samples were fixed immediately in 10% buffered formalin or in Tissue-Tek OCT Compound (Sakura, Alphen aan den Rijn, The Netherlands). Some tissues were embedded in paraffin within 48 h of formalin fixation, and were cut to a thickness of 4 µm just before staining. Histological staining was performed using hematoxylin and eosin. Tissue-Tek samples were snap frozen, and were cut to a thickness of 4 µm just before Oil-red O staining.
RNA isolation, cDNA synthesis, and real-time qPCR assay
Total cellular RNA was extracted from the tissues according to the manufacturer’s protocol (Qiagen Midi, Hilden, Germany). RNA was extracted using the RNeasy midi kit from Qiagen (Valencia, CA) following the vendor’s instructions. cDNA preparation was performed using 1 µg RNA in a 20 µl reaction volume according to the instructions of the ReverTra Ace qPCR RT Kit (Toyobo, Osaka, Japan). The reaction was carried out for 1 h at 45°C, followed by reverse transcriptase inactivation for 5 min at 95°C. The PPAR-α and PPAR-γ gene expressions were detected by real-time quantitative reverse-transcription polymerase chain reaction (qRT-PCR) assays.
Quantification of mRNA from the above mentioned genes was achieved using the ABI PRISM 7700 Sequence Detection System (PE Applied Biosystems, Foster City, CA). RT-PCR was based on the TaqMan fluorogenic detection system (PE Applied Biosystems) using a fluorogenic oligonucleotide probe designed to hybridize the specific target sequence. The TaqMan probes were labeled at the 5' end with the fluorescent reporter dye 6-carboxyfluorescein (FAM) (R) and at the 3' end with the quencher dye 6-carboxytetramethylrhodamine (TAMRA) (Q). The sequences for the gene-specific forward and reverse primers and the probes were designed using Primer Express 1.0 software (PE Applied Biosystems). The following primers and probe were used for the RT-PCR of PPAR-α mRNA: 5' ACTATGGAGTCCACGCATGTG 3' (forward); 5' TTGTCGTACGCCAGCTTTAGC 3' (reverse); and 5' GAAGGCTGTAAGGGCTTCTTTCGGCG 3' (probe) (GeneBank, Accession No. NM_013196). The primers for the RT-PCR of PDK4 mRNA were as follows: 5' TTCACACCTTCACCACATGC 3' (forward); 5' TTCACACCTTCACCACATGC 3'(reverse); and 5' CGTGGCCCTCATGGCATGGCATTCTTG 3' (probe) (Genbank, Accession No. NC_005103.2).
PPAR-γ (Rn0040945_m1) was measured by a commercially available TaqMan Gene Expression Assay Kit (P/N 4335626, PE Applied Biosystems).
Quantification of expression of housekeeping and target genes
To quantify the results obtained by RT-PCR for 18S rRNA, the standard curve method was used. A commercially available standard of 18S (4319413E, PE Applied Biosystems) was amplified at five different DNA template concentrations of 6.25, 12.5, 25.0, 50.0, and 100.0 ng/25 µl. The values of the copy numbers for the standards were calculated based on the relationship that 1 ng of DNA is equal to 333 genome equivalents (TaqMan PCR Reagent Kit Protocol P/N 402823). Amplification plots for each dilution of the control template were used to determine the Ct value. A standard curve was generated by plotting the Ct values against the log of the known input DNA copy numbers.
To determine the quantity of the target gene-specific transcripts present in the treated cells relative to the untreated cells, their respective Ct values were first normalized by subtracting the Ct value obtained from the 18S control (ΔCt = Ct, target − Ct, control). The concentration of gene-specific mRNA in the treated samples relative to the untreated samples was calculated by subtracting the normalized Ct values obtained for untreated samples from those obtained from treated samples (ΔΔCt = ΔCt, treated − ΔCt, LETO-control), and the relative concentration was determined as 2–ΔΔCt.
Statistical analysis
Unless otherwise stated, results are presented as means ± SEM. Statistical analysis was performed by analysis of variance (ANOVA), and results were considered significant at p<0.05.
Results
Changes in body weight
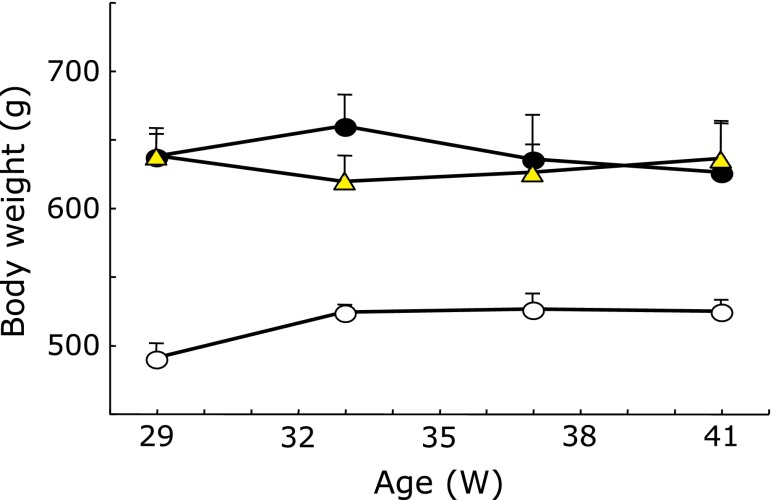
The OLETF rats were significantly heavier than the LETO rats (Fig. 1; p<0.01). SAC did not affect the body weight gain in any LETO or OLETF rat group.
Fig. 1.
Effects of S-allyl cysteine (SAC) administration on changes in body weight. Long-Evans Tokushima Otsuka (LETO) and Otsuka Long-Evans Tokushima Fatty (OLETF) rats were fed control chow and divided into 4 groups at 29 weeks after checking the body weight of all rats (control: LETO, SAC diet: LETO-SAC, OLETF, OLETF-SAC). SAC was given via a 0.45% dietary mixture from 29 weeks of age. Control: open circle; OLETF: closed circle; OLETF-SAC: triangle. LETO-SAC data are not shown because the changes were the same as that of the control group. Values are means ± SEM (n = 5–6).
Changes in blood glucose and HbA1c
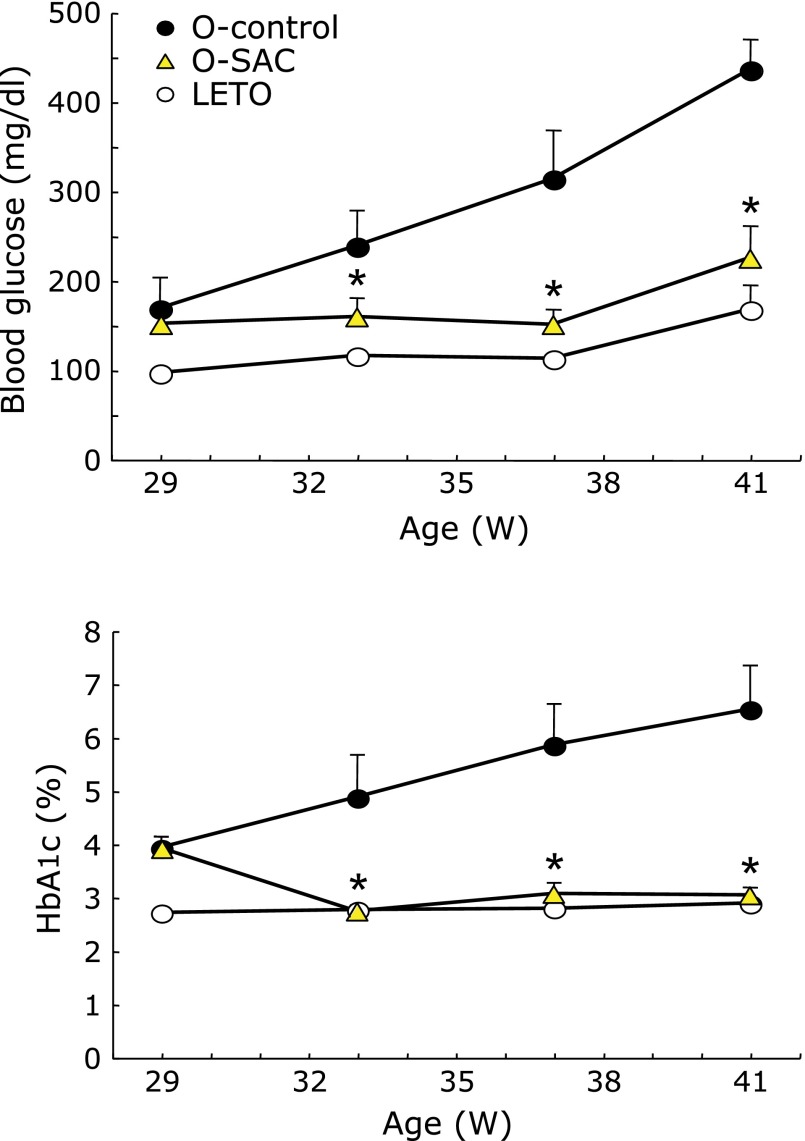
Blood glucose and HbA1c continued to increase in an age-dependent manner in the OLETF control rats (Fig. 2). SAC significantly decreased both glucose and HbA1c.
Fig. 2.
Time course of (A) blood glucose and (B) hemoglobinA1c (HbA1c). Long-Evans Tokushima Otsuka (LETO) and Otsuka Long-Evans Tokushima Fatty (OLETF) rats were fed control chow and divided into 4 groups at 29 weeks after checking the body weight of all rats (control: LETO; SAC diet: LETO-SAC, OLETF, OLETF-SAC). SAC was given via a 0.45% dietary mixture from 29 weeks of age, and blood was collected at the times indicated. Control (LETO): open circle; OLETF: closed circle; OLETF-SAC: triangle. LETO-SAC data is not shown because the changes were the same as that of the control group. Values are means ± SEM (n = 5–6). *p<0.01 as compared with OLETF.
Effects of SAC on lipid profiles and insulin in plasma
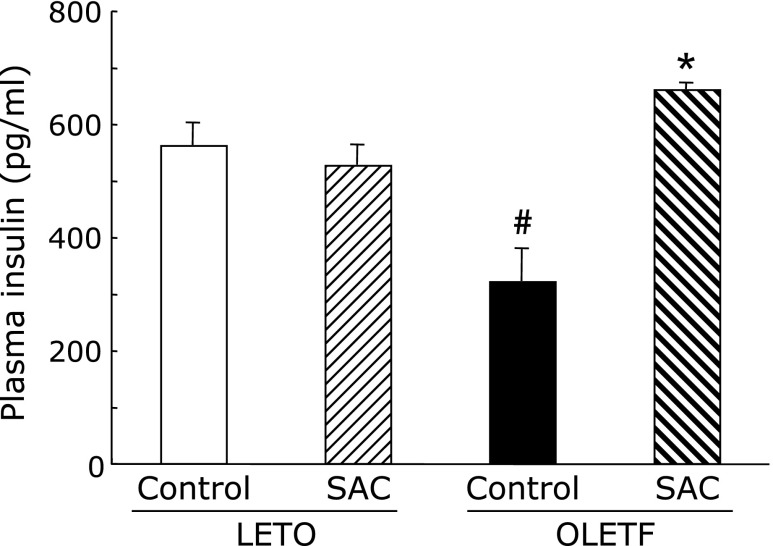
Triglyceride, total cholesterol, LDL, and insulin levels increased in OLETF rats (Table 1). All parameters were significantly greater in the control OLETF rats compared with age-matched LETO rats. SAC significantly decreased LDL and triglyceride levels but did not decrease total cholesterol levels in OLETF rats. In addition, the OLETF group had significantly lower insulin levels (Fig. 3). SAC increased the plasma insulin levels significantly in OLETF rats.
Table 1.
Effects of SAC on lipid profiles in plasma
| n | Triglyceride (mg/dl) | T-cholesterol (mg/dl) | LDL (mg/dl) | |
|---|---|---|---|---|
| LETO | 5 | 40.6 ± 11.0 | 111.8 ± 5.1 | 21.8 ± 0.6 |
| (+)SAC | 4 | 54.7 ± 14.0 | 111.5 ± 2.1 | 15.5 ± 0.7 |
| OLETF | 6 | 334.3 ± 56.1# | 170.5 ± 6.7# | 29.3 ± 1.0# |
| (+)SAC | 5 | 273.2 ± 56.7* | 153.0 ± 18.2 | 21.0 ± 2.7* |
#p<0.01 as compared with LETO rats, *p<0.05, *p<0.01 as compared with OLETF control rats.
Fig. 3.
Effects of S-allyl cysteine (SAC) administration on plasma insulin levels. Animals were treated as described in Fig. 1. Plasma was collected at 42 weeks. Values are means ± SEM (n = 5–6). #p<0.01 compared with Long-Evans Tokushima Otsuka (LETO) rats; *p<0.01 as compared with the Otsuka Long-Evans Tokushima Fatty (OLETF) control.
Effects of SAC on lipid peroxidation in plasma, liver, and pancreas
There was no obviously change of lipid peroxides levels of plasma and liver between the groups. The levels of pancreas increased in OLETF rats, and SAC significantly decreased.
Effects of SAC on fatty liver
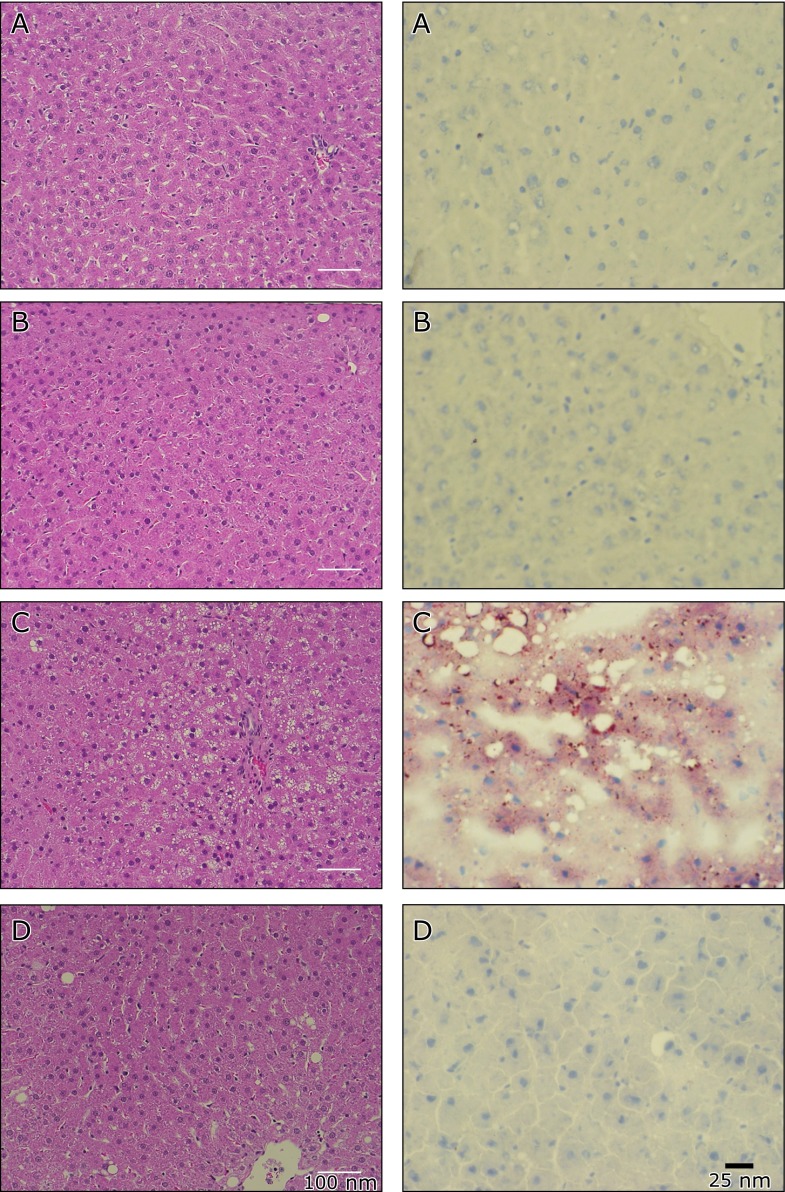
The OLETF liver was observed more extensive steatosis in HE stain (Fig. 4C in the left column). Accumulation of lipids was observed in the OLETF rats (Fig. 4C in the right column). The administration of SAC normalized these conditions (Fig. 4D).
Fig. 4.
Hematoxylin-eosin and Oil-red O-stain in the liver. Animals were treated as described in Fig. 1 in the main text. Liver sections were stained by Hematoxilin-eosin (left column). Representative figures of (A) LETO, (B) LETO-SAC, (C) OLETF, and (D) OLETF-SAC. Oil-red O-stained liver (right column), representative figures are shown for (A) LETO, (B) LETO-SAC, (C) OLETF, and (D) OLETF-SAC.
Effects of SAC on SREBP-1 proteins
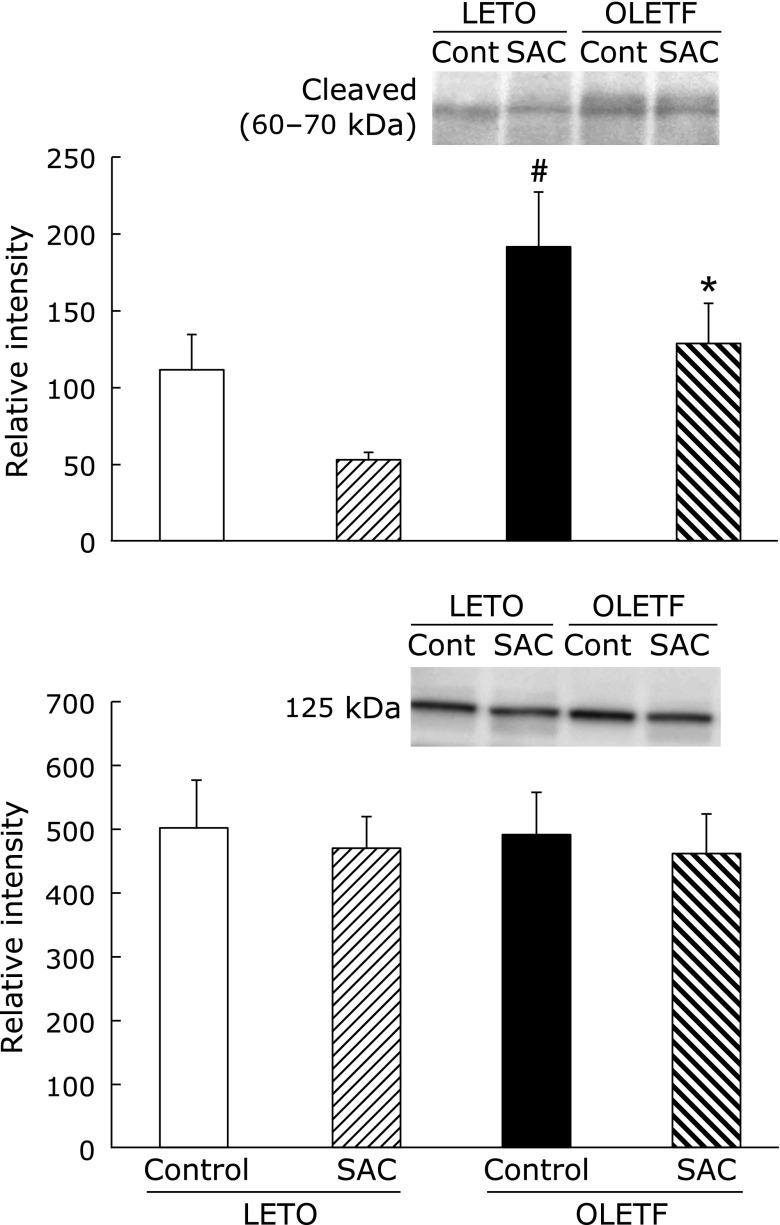
SREBP-1 is responsible for regulating the genes required for de novo lipogenesis. The 125 kDa SREBP-1 precursor protein is anchored in the membranes of the endoplasmic reticulum (ER) and cleaved to activating proteins (60–70 kDa). SREBP-1 increased in OLETF rat liver. SAC normalized the expression of SREBP-1 protein (Fig. 5).
Fig. 5.
Effects of S-allyl cysteine (SAC) on SREBP-1 proteins. Animals were treated as described in Fig. 1. Whole cell lysates of the liver were resolved by SDS-PAGE. Proteins levels of sterol regulatory element-binding protein 1 (SREBP-1) (125 and 60–70 kDa) were analyzed by densitometry data. Values are presented as means ± SEM (n = 5). #p<0.05 compared with Long-Evans Tokushima Otsuka (LETO) rats; *p<0.05 compared with the control OLETF rats.
Gene expression and protein levels of PPAR-α in the liver
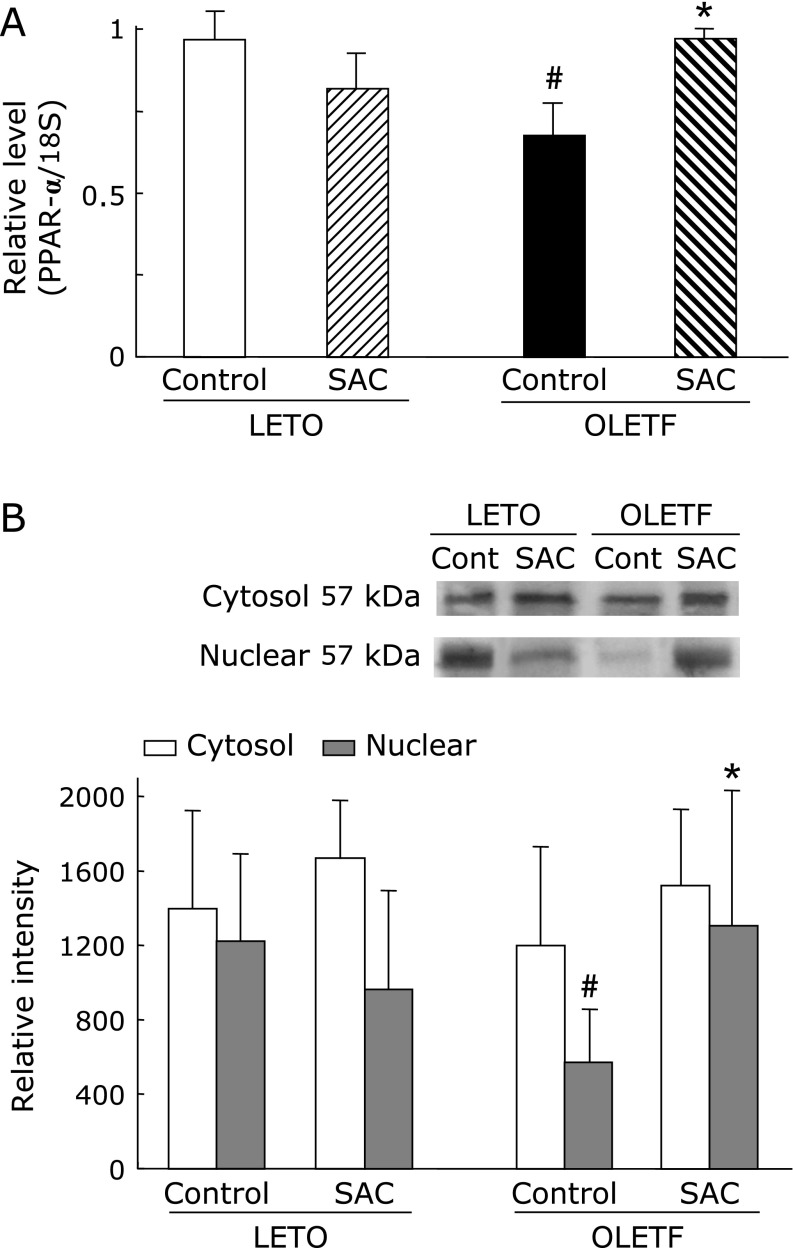
The mRNA expression and protein levels of PPAR-α were significantly lower in OLETF rat liver compared with that of LETO (Fig. 6). SAC markedly increased the expression of mRNA and PPAR-α protein.
Fig. 6.
(A) Effects of S-allyl cysteine (SAC) administration on the gene expression and protein levels of PPAR-α in the liver. Animals were treated as described in Fig. 1. Peroxisome proliferators-activated receptor (PPAR)-α mRNA expression was measured as described in Materials and Methods. Values are means ± SEM (n = 5–6). #p<0.05 as compared with the Long-Evans Tokushima Otsuka (LETO) control; *p<0.05 as compared with each control group. (B) Cytosol and nuclear proteins of the liver were resolved by SDS-PAGE. Hepatic proteins levels of PPAR-α were analyzed by densitometry data. Values are presented as mean ± SEM (n = 5). #p<0.05 compared with LETO rats; *p<0.05 compared with control Otsuka Long–Evans Tokushima Fatty (OLETF)OLETF rats.
Gene expression and protein levels of PPAR-γ in the liver
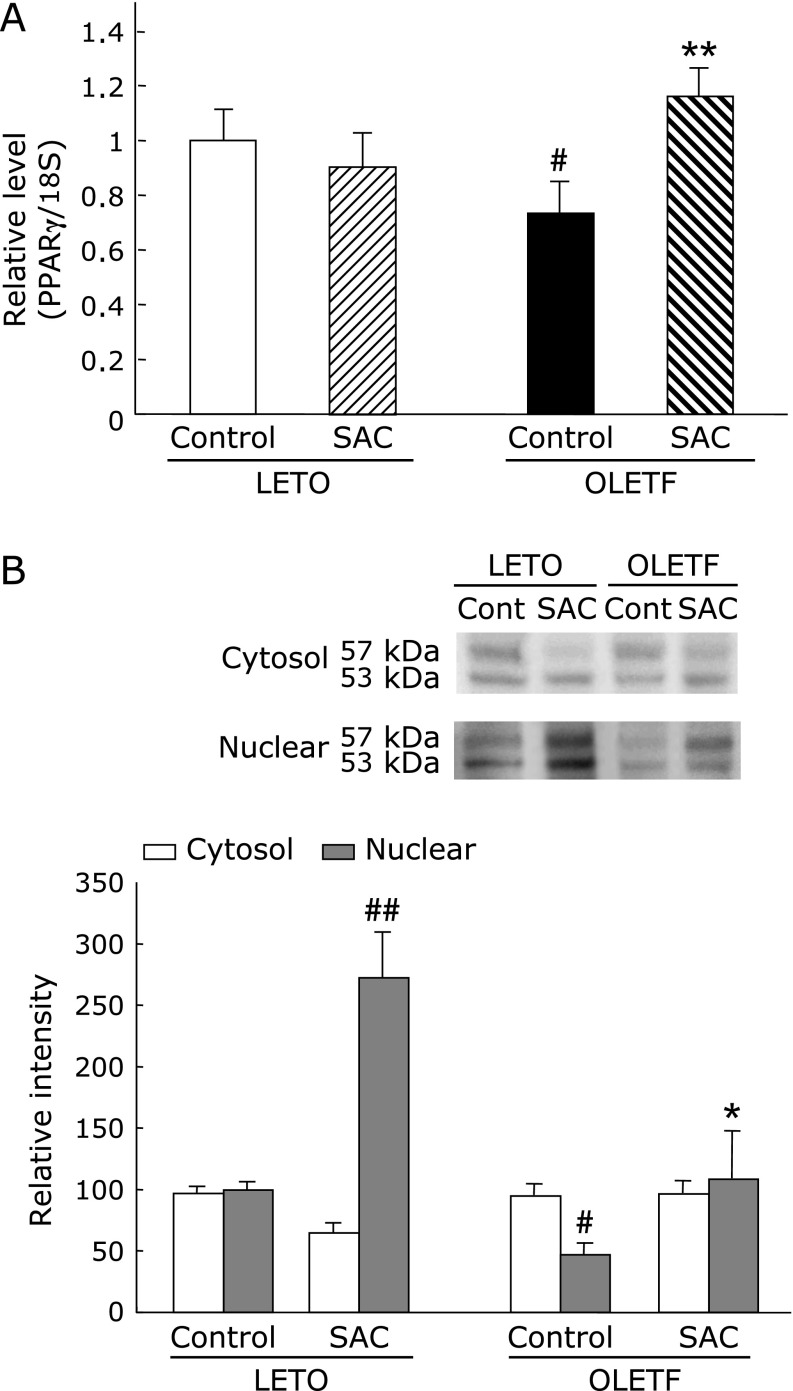
The mRNA expression and protein levels of PPAR-γ (Fig. 7) were markedly decreased in the OLETF rat hepatic tissue relative to that of LETO rats. SAC significantly elevated the levels of mRNA and PPAR-γ protein in OLETF rats.
Fig. 7.
(A) Effects of S-allyl cysteine (SAC) administration on the gene expression and protein levels of Peroxisome proliferators-activated receptor (PPAR)-γ in the liver. Animals were treated as described in Fig. 1. PPAR-γ mRNA expression was measured as described in Methods. Values are means ± SEM (n = 5–6). #p<0.05 as compared with the Long-Evans Tokushima Otsuka (LETO) control; **p<0.01 as compared with each control group. (B) Cytosol and nuclear proteins of the liver were resolved by SDS-PAGE. Hepatic proteins levels of PPAR-γ were analyzed by densitometry data presented as means ± SEM (n = 5). #p<0.05, ##p<0.01 compared with Long-Evans Tokushima Otsuka (LETO) rats; *p<0.05 compared with control Otsuka Long-Evans Tokushima Fatty (OLETF) rats.
Gene expression and protein levels of PDK4 in the liver
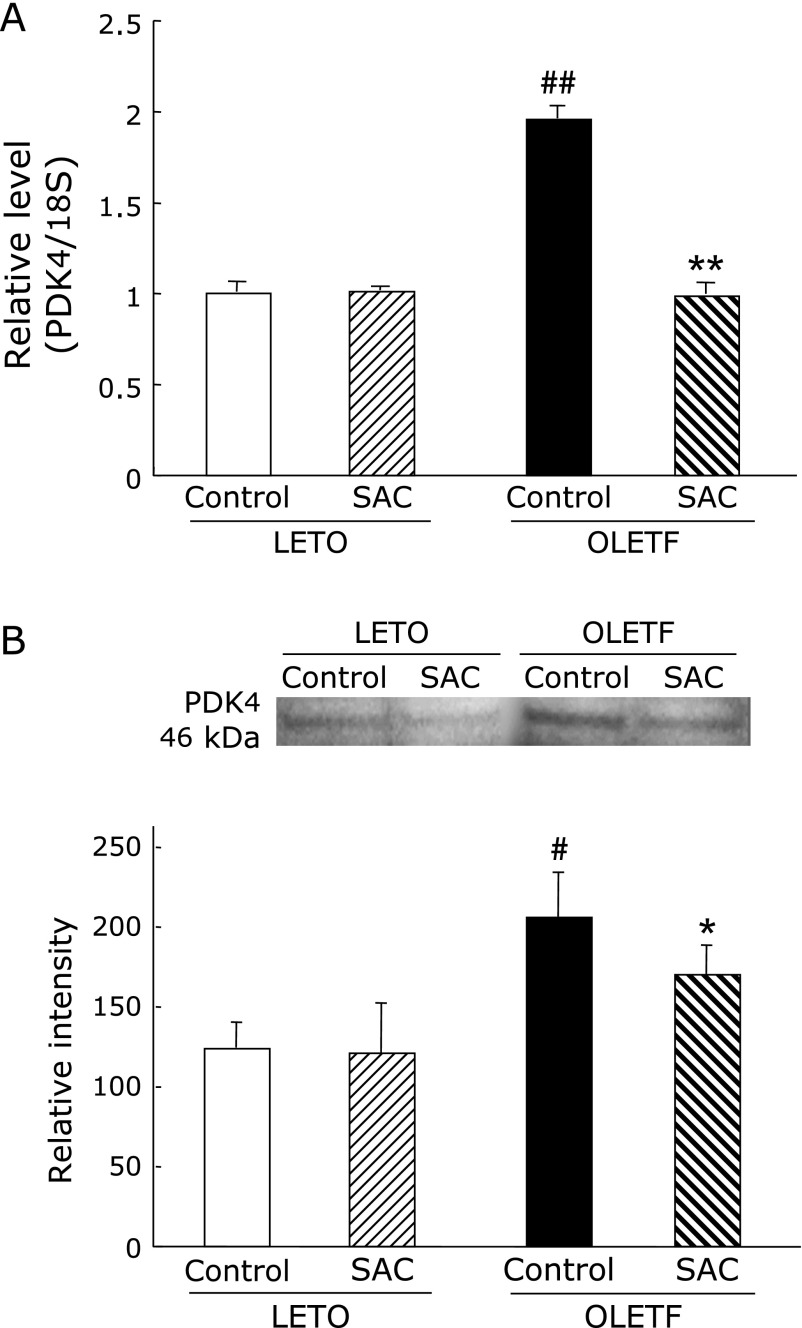
Both gene expression and protein levels of PDK4 were significantly increased in OLETF rats (Fig. 8). SAC returned these to normal levels.
Fig. 8.
Effects of S-allyl cysteine (SAC) administration on liver pyruvate dehydrogenase kinases 4 (PDK4). Animals were treated as described in Fig. 1. (A) PDK4 mRNA expression and (B) protein levels of the liver were measured as described in Materials and Methods. Values are means ± SEM (n = 5–6). #p<0.05, ##p<0.01 as compared with the Long-Evans Tokushima Otsuka (LETO) control; *p<0.05, **p<0.01 as compared with each control group.
Protein levels of FoxO1 in the liver
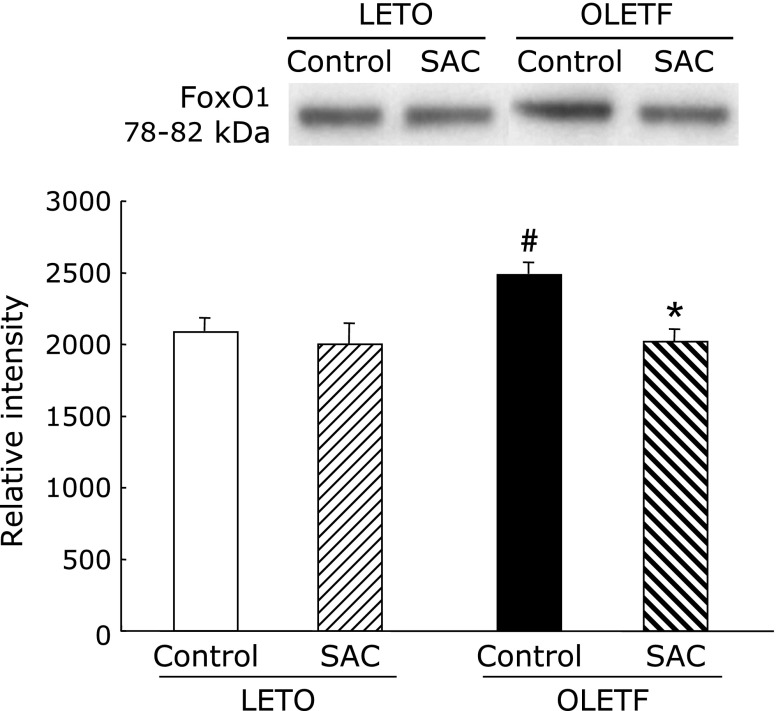
FoxO1 levels were evaluated to measure insulin resistance. FoxO1 levels were significantly increased in OLETF rats (Fig. 9). SAC returned the protein to normal levels.
Fig. 9.
Effects of S-allyl cysteine (SAC) administration on forkhead box O1 (FoxO1) proteins in the liver. Cytosol proteins of the liver were resolved by SDS-PAGE. Densitometry data are presented as means ± SEM (n = 5). #p<0.05 compared with Long-Evans Tokushima Otsuka (LETO) control; *p<0.05 compared with control Otsuka Long-Evans Tokushima Fatty (OLETF) rats.
Discussion
We have described the ability of SAC to improve diabetic symptoms and regulate SREBP-1c protein and gene expressions such as PPAR ligands, PDK4, and FoxO1 in OLETF rats. Although numerous studies have demonstrated the antioxidant properties of aged garlic extract, there are few reports about its ability to prevent type 2 diabetes mellitus or its detailed mechanisms. SAC has been reported to suppress the complications of diabetes reduction of the oxidative stress accompanied with an increase in hepatic glutathione (GSH) in STZ diabetic mice.(14,15) However, in our study, GSH levels hardly changed with the administration of SAC (LETO: 8.2 ± 0.13 µmol/g liver, OLETF: 7.6 ± 0.45 µmol/g liver) and also hepatic lipid peroxide levels hardly changed (Table 2). Therefore, the protective effects against diabetes directly might not be based on the antioxidant effect of SAC in the liver. In the pancreas, lipid peroxides increased in OLETF rats and SAC decreased up to near the levels of LETO rats. Therefore, in part, the recovery of insulin dose by SAC may be dependent on the anti-oxidative effects.
Table 2.
Effects of SAC on lipid peroxidation in plasma, liver, and pancreas
| n | Plasma (µM) | Liver (nmol/mg protein) | Pancreas (nmol/mg protein) | |
|---|---|---|---|---|
| LETO | 5 | 4.05 ± 0.30 | 0.50 ± 0.02 | 0.09 ± 0.02 |
| OLETF | 6 | 3.26 ± 0.36 | 0.43 ± 0.08 | 0.19 ± 0.03# |
| (+)SAC | 5 | 5.36 ± 0.79 | 0.36 ± 0.02 | 0.12 ± 0.00* |
Values are Mean ± SE. #p<0.05 as compared with LETO rats, *p<0.05 as compared with OLETF control rats. The values of LETO + SAC group (data not shown) did not change as compared with that of LETO group.
SAC inhibited the increase of triglyceride, total cholesterol, and LDL levels as well as an increase in plasma glucose and HbA1c in OLETF rats. Type 2 diabetes mellitus is a complex disease that is marked by the dysfunction of glucose and lipid metabolism including SREPB-1c, the PPAR family, and PDKs.(16–18) SREBP-1c and the PPAR family are transcription factors, and SAC was shown to normalize both. Down-regulation of the SREBP-1c gene expression in db/db mouse livers results in a reduced hepatic triglyceride content and serum triglyceride concentration.(16) PPARs could reduce the production of pro-inflammatory cytokines, cyclooxygenase-2 (COX2), and inducible nitric oxide synthases (iNOS) by inhibiting the transcriptional activity of NFκB.(19,20) Drugs that target only PPAR-γ receptors, PPAR-γ agonists, or thiazolidinediones are insulin sensitizers that are already licensed for the treatment of type 2 diabetes. These agents promote fatty acid uptake and glucose metabolism, which increases sensitivity to insulin in the liver and reduces blood glucose levels. However, weight gain can occur with these agents. Because dual-acting PPAR agonists also stimulate PPAR-α, which influences lipid homeostasis, they address dyslipidaemia commonly seen in patients with type 2 diabetes as well as glucose metabolism. These therapeutic benefits should also be achieved without excessive weight gain. PPAR-α deficiency leads to accumulation of hepatic triacylglycerol and elicits dysregulation of hepatic lipid and carbohydrate metabolism, emphasizing the importance of precise control of lipid oxidation for hepatic fuel homoeostasis.(21)
Enhanced PDK4 expression is also promoted by high fat diets,(17,22) diabetes,(23,24) carnitine deficiency,(25) extended exercise,(26) and hibernation.(27) However, PDK4 mRNA expression in the OLETF rat livers increased two-fold compared to the LETO rat livers, and the improvement of diabetes by iron depletion(7) did not affect the increase of the PDK4 mRNA expression (data not shown). Therefore, PDK4 regulation might not necessarily be a critical factor for the improvement of diabetic abnormalities. Furthermore, we found that the increases in the FoxO1 levels, which evaluate insulin resistance in the OLETF rat liver, were improved by SAC administration. Kim et al.(28) also suggested that selective inhibition of FoxO1 activity in the liver would improve triglyceride metabolism and ameliorate hypertriglyceridemia. In that article, the authors reviewed the role of FoxO1 in insulin action and lipid metabolism and evaluated the therapeutic potential of targeting FoxO1 for treating hypertriglyceridemia in insulin resistant subjects with obesity and type 2 diabetes.
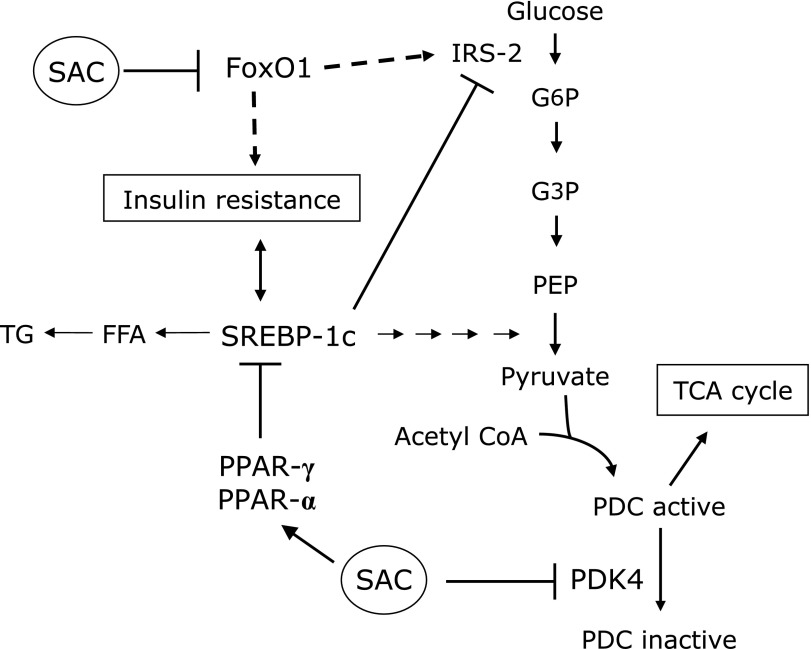
Fig. 10 shows the SAC inhibition pathway. SAC may synergistically affect many pathways such as FoxO1, PDK4, PPARs, and SREBP-1c. These results suggest that SAC has anti-diabetic therapeutic potential via the regulation of hepatic metabolism during insulin resistance and in metabolic syndrome. It has recently been reported that other sulfur compounds isolated from garlic such as thiacremonone also suppress body weight and diabetic symptoms in the livers of db/db mice.(11) Because SAC did not affect weight gain (Supplementary Fig. 1), there should be a difference in the anti-diabetic mechanisms of SAC and thiacremonone. In conclusion, SAC is a potent regulating agent against lipogenesis and glucose metabolism in diabetic liver. SAC could be safely administered long-term with few side-effects for the prevention and treatment of diabetes mellitus.
Fig. 10.
Inhibitory pathways of S-allyl cysteine (SAC) in diabetic rats. SAC may affect many pathways: SAC inhibits the increase of FoxO1 and pyruvate dehydrogenase kinases 4 (PDK4) and increases Peroxisome proliferators-activated receptors (PPARs). Therefore, metabolic pathways of lipid and glucose will be improved.
Acknowledgments
A part of the study was supported by a Grant-in-Aid for Scientific Research (C) (No. 22500767) from the Japan Society for the Promotion of Science and the Adaptable and Seamless Technology Transfer Program through Target-driven R&D from the Japan Science and Technology Agency to Y.M.
We thank Ms. Atsuko Tominaga and Kimi Yamada of Osaka City University Medical School for their excellent technical assistance.
Abbreviations
- FoxO1
forkhead box O1
- LETO
Long-Evans Tokushima Otsuka
- OLETF
Otsuka Long-Evans Tokushima Fatty
- PDC
pyruvate dehydrogenase complex
- PDK
pyruvate dehydrogenase kinase
- PPAR
peroxisome proliferators-activated receptor
- SAC
S-allyl cysteine
- SREBP-1
sterol regulatory element-binding protein 1
Conflict of Interest
No potential conflicts of interest were disclosed.
References
- 1.Vernon G, Baranova A, Younossi ZM. Systematic review: the epidemiology and natural history of non-alcoholic fatty liver disease and non-alcoholic steatohepatitis in adults. Aliment Pharmacol Ther. 2011;34:274–285. doi: 10.1111/j.1365-2036.2011.04724.x. [DOI] [PubMed] [Google Scholar]
- 2.Tamura Y, Tanaka Y, Sato F, et al. Effects of diet and exercise on muscle and liver intracellular lipid contents and insulin sensitivity in type 2 diabetic patients. J Clin Endocrinol Metab. 2005;90:3191–3196. doi: 10.1210/jc.2004-1959. [DOI] [PubMed] [Google Scholar]
- 3.Torisu Y, Ikeda K, Kobayashi M, et al. Diabetes mellitus increases the risk of hepatocarcinogenesis in patients with alcoholic cirrhosis: a preliminary report. Hepatol Res. 2007;37:517–523. doi: 10.1111/j.1872-034X.2007.00077.x. [DOI] [PubMed] [Google Scholar]
- 4.Hashimoto E, Tokushige K. Hepatocellular carcinoma in non-alcoholic steatohepatitis: growing evidence of an epidemic? Hepatol Res. 2012;42:1–14. doi: 10.1111/j.1872-034X.2011.00872.x. [DOI] [PubMed] [Google Scholar]
- 5.Awad S, Constantin-Teodosiu D, Constantin D, et al. Cellular mechanisms underlying the protective effects of preoperative feeding: a randomized study investigating muscle and liver glycogen content, mitochondrial function, gene and protein expression. Ann Surg. 2010;252:247–253. doi: 10.1097/SLA.0b013e3181e8fbe6. [DOI] [PubMed] [Google Scholar]
- 6.Minamiyama Y, Takemura S, Bito Y, et al. Supplementation of α-tocopherol improves cardiovascular risk factors via the insulin signalling pathway and reduction of mitochondrial reactive oxygen species in type II diabetic rats. Free Radic Res. 2008;42:261–271. doi: 10.1080/10715760801898820. [DOI] [PubMed] [Google Scholar]
- 7.Minamiyama Y, Takemura S, Kodai S, et al. Iron restriction improves type 2 diabetes mellitus in Otsuka Long-Evans Tokushima fatty rats. Am J Physiol Endocrinol Metab. 2010;298:E1140–E1149. doi: 10.1152/ajpendo.00620.2009. [DOI] [PubMed] [Google Scholar]
- 8.Rattan SI. Is gene therapy for aging possible? Indian J Exp Biol. 1998;36:233–236. [PubMed] [Google Scholar]
- 9.Maldonado PD, Barrera D, Rivero I, et al. Antioxidant S-allylcysteine prevents gentamicin-induced oxidative stress and renal damage. Free Radic Biol Med. 2003;35:317–324. doi: 10.1016/s0891-5849(03)00312-5. [DOI] [PubMed] [Google Scholar]
- 10.Numagami Y, Ohnishi ST. S-allylcysteine inhibits free radical production, lipid peroxidation and neuronal damage in rat brain ischemia. J Nutr. 2001;131:1100S–1105S. doi: 10.1093/jn/131.3.1100S. [DOI] [PubMed] [Google Scholar]
- 11.Saravanan G, Ponmurugan P. Beneficial effect of S-allylcysteine (SAC) on blood glucose and pancreatic antioxidant system in streptozotocin diabetic rats. Plant Foods Hum Nutr. 2010;65:374–378. doi: 10.1007/s11130-010-0192-2. [DOI] [PubMed] [Google Scholar]
- 12.Lin CC, Yin MC, Hsu CC, Lin MP. Effect of five cysteine-containing compounds on three lipogenic enzymes in Balb/cA mice consuming a high saturated fat diet. Lipids. 2004;39:843–848. doi: 10.1007/s11745-004-1305-4. [DOI] [PubMed] [Google Scholar]
- 13.Mong MC, Yin MC. Nuclear factor κB-dependent anti-inflammatory effects of s-allyl cysteine and s-propyl cysteine in kidney of diabetic mice. J Agric Food Chem. 2012;60:3158–3165. doi: 10.1021/jf3002685. [DOI] [PubMed] [Google Scholar]
- 14.Hsu CC, Yen HF, Yin MC, Tsai CM, Hsieh CH. Five cysteine-containing compounds delay diabetic deterioration in Balb/cA mice. J Nutr. 2004;134:3245–3249. doi: 10.1093/jn/134.12.3245. [DOI] [PubMed] [Google Scholar]
- 15.Saravanan G, Ponmurugan P. Ameliorative potential of S-allyl cysteine on oxidative stress in STZ induced diabetic rats. Chem Biol Interact. 2011;189:100–106. doi: 10.1016/j.cbi.2010.10.001. [DOI] [PubMed] [Google Scholar]
- 16.Li S, Ogawa W, Emi A, et al. Role of S6K1 in regulation of SREBP1c expression in the liver. Biochem Biophys Res Commun. 2011;412:197–202. doi: 10.1016/j.bbrc.2011.07.038. [DOI] [PubMed] [Google Scholar]
- 17.Holness MJ, Bulmer K, Smith ND, Sugden MC. Investigation of potential mechanisms regulating protein expression of hepatic pyruvate dehydrogenase kinase isoforms 2 and 4 by fatty acids and thyroid hormone. Biochem J. 2003;369:687–695. doi: 10.1042/BJ20021509. [DOI] [PMC free article] [PubMed] [Google Scholar]
- 18.Holness MJ, Bulmer K, Gibbons GF, Sugden MC. Up-regulation of pyruvate dehydrogenase kinase isoform 4 (PDK4) protein expression in oxidative skeletal muscle does not require the obligatory participation of peroxisome-proliferator-activated receptor α (PPARα) Biochem J. 2002;366:839–846. doi: 10.1042/BJ20020754. [DOI] [PMC free article] [PubMed] [Google Scholar]
- 19.Duan SZ, Usher MG, Mortensen RM. PPARs: the vasculature, inflammation and hypertension. Curr Opin Nephrol Hypertens. 2009;18:128–133. doi: 10.1097/MNH.0b013e328325803b. [DOI] [PubMed] [Google Scholar]
- 20.Romics L, Jr, Kodys K, Dolganiuc A, et al. Diverse regulation of NF-κB and peroxisome proliferator-activated receptors in murine nonalcoholic fatty liver. Hepatology. 2004;40:376–385. doi: 10.1002/hep.20304. [DOI] [PubMed] [Google Scholar]
- 21.Sugden MC, Bulmer K, Gibbons GF, Knight BL, Holness MJ. Peroxisome-proliferator-activated receptor-α (PPARα) deficiency leads to dysregulation of hepatic lipid and carbohydrate metabolism by fatty acids and insulin. Biochem J. 2002;364:361–368. doi: 10.1042/BJ20011699. [DOI] [PMC free article] [PubMed] [Google Scholar]
- 22.Holness MJ, Kraus A, Harris RA, Sugden MC. Targeted upregulation of pyruvate dehydrogenase kinase (PDK)-4 in slow-twitch skeletal muscle underlies the stable modification of the regulatory characteristics of PDK induced by high-fat feeding. Diabetes. 2000;49:775–781. doi: 10.2337/diabetes.49.5.775. [DOI] [PubMed] [Google Scholar]
- 23.Wu P, Blair PV, Sato J, Jaskiewicz J, Popov KM, Harris RA. Starvation increases the amount of pyruvate dehydrogenase kinase in several mammalian tissues. Arch Biochem Biophys. 2000;381:1–7. doi: 10.1006/abbi.2000.1946. [DOI] [PubMed] [Google Scholar]
- 24.Wu P, Sato J, Zhao Y, Jaskiewicz J, Popov KM, Harris RA. Starvation and diabetes increase the amount of pyruvate dehydrogenase kinase isoenzyme 4 in rat heart. Biochem J. 1998;329:197–201. doi: 10.1042/bj3290197. [DOI] [PMC free article] [PubMed] [Google Scholar]
- 25.Horiuchi M, Kobayashi K, Masuda M, Terazono H, Saheki T. Pyruvate dehydrogenase kinase 4 mRNA is increased in the hypertrophied ventricles of carnitine-deficient juvenile visceral steatosis (JVS) mice. Biofactors. 1999;10:301–309. doi: 10.1002/biof.5520100232. [DOI] [PubMed] [Google Scholar]
- 26.Pilegaard H, Neufer PD. Transcriptional regulation of pyruvate dehydrogenase kinase 4 in skeletal muscle during and after exercise. Proc Nutr Soc. 2004;63:221–226. doi: 10.1079/pns2004345. [DOI] [PubMed] [Google Scholar]
- 27.Chen J, Sun M, Liang B, Xu A, Zhang S, Wu D. Cloning and expression of PDK4, FOXO1A and DYRK1A from the hibernating greater horseshoe bat (Rhinolophus ferrumequinum) Comp Biochem Physiol B Biochem Mol Biol. 2007;146:166–171. doi: 10.1016/j.cbpb.2006.10.095. [DOI] [PubMed] [Google Scholar]
- 28.Kim DH, Zhang T, Ringquist S, Dong HH. Targeting FoxO1 for Hypertriglyceridemia. Curr Drug Targets. 2011;12:1245–1255. doi: 10.2174/138945011796150262. [DOI] [PubMed] [Google Scholar]


