

SUMMARY
The tricarboxylic acid cycle enzyme fumarate hydratase (FH) has been identified as a tumor suppressor in a subset of human renal cell carcinomas. Human FH deficient cancer cells display high fumarate concentration and ROS levels along with activation of HIF-1. The underlying mechanisms by which FH loss increases ROS and HIF-1 are not fully understood. Here, we report that glutamine dependent oxidative citric acid cycle metabolism is required to generate fumarate and increase ROS and HIF-1 levels. Accumulated fumarate directly bonds the antioxidant glutathione in vitro and in vivo to produce the novel metabolite succinated glutathione (GSF). GSF acts as an alternative substrate to glutathione reductase to decrease NADPH levels and enhance mitochondrial ROS and HIF-1 activation. Increased ROS also correlates with hyper-methylation of histones in these cells. Thus, fumarate serves as a proto-oncometabolite by binding to glutathione which results in the accumulation of ROS.
INTRODUCTION
The modification of cellular metabolism is an emerging hallmark of cancer. Proliferating cancer cells have increased metabolic demands which are supported in part by glucose and glutamine dependent metabolic pathways for growth. Glucose generates glycolytic intermediates while glutamine generates tricarboxylic acid cycle (TCA cycle) intermediates to collectively generate ATP, NADPH, nucleic acids, lipids and amino acids (Lunt and Vander Heiden, 2011, DeBerardinis and Cheng, 2010). Beyond the role of supportive adaptations for cancer growth, mutations in metabolic enzymes have also been shown to be causal for cancer development. One example is the identification of the TCA cycle enzyme fumarate hydratase (FH) as the tumor suppressor responsible for hereditary leiomyomatosis and renal cell carcinoma (HLRCC). Affected families inherit one defective copy of FH and, following a loss of heterozygosity event, can develop leiomyomas of the skin and uterus as well as aggressive renal cell carcinoma (Tomlinson et al., 2002). FH catalyzes the conversion of fumarate to malate in the TCA cycle. The loss of FH results in diminished TCA cycle function and accumulation of fumarate. Recently, the UOK262 cell line which was established from a metastasis of a patient with HLRCC was found to harbor increased fumarate levels (Yang et al., 2010). These cells are dependent on glycolysis for survival and display undetectably low mitochondrial oxygen consumption. However, despite a loss of TCA cycle function at FH, these cells are still dependent on mitochondrial glutamine consumption for growth through reductive carboxylation (Mullen et al., 2012). Whether the accumulation of fumarate is advantageous for cancer development is still unknown.
The best characterized signaling change in FH deficient human cancer cells is the induction of a pseudo-hypoxic state. Despite the presence of ample oxygen and a loss of oxygen consumption, FH deficient cells have chronic activation of hypoxia inducible factors (HIFs) (Pollard et al., 2005, Isaacs et al., 2005). HIFs are cancer associated master transcription factors which are normally regulated in an O2 dependent manner. HIFs are comprised of a heterodimer of two basic helix loop-helix/PAS proteins, the HIFα subunit and the aryl hydrocarbon nuclear trans-locator (ARNT or HIF-1β) (Semenza, 2012). Under normoxic conditions HIFα subunits are hydroxylated by the 2-oxoglutarate dependent enzyme prolyl hydroxylase domain-containing protein 2 (PHD2) which targets them for recognition by the von Hippel-Lindau (VHL) E3 ubiquitin ligase, leading to their degradation (Kaelin and Ratcliffe, 2008). With hypoxia or pseudo-hypoxia, PHD2 is inhibited and HIFα subunits accumulate, leading to heterodimerization with the constitutively expressed HIF1β and activation of transcription of hypoxic response genes by binding hypoxia response elements (HRE). Another feature associated with loss of FH is hyper-methylation of histones due to inhibition of histone demethylases which, like PHD2, are also 2-oxoglutarate dependent enzymes (Xiao, et al. 2012). The current proposed mechanism to explain increased HIFs and hyper-methylation due to the loss of FH suggests that fumarate competes with 2-oxoglutarate as a co-factor for PHD2 and histone demethylases, yielding a block in function (Hewitson et al., 2007).
Interestingly, FH deficient cells display high levels of ROS despite hyper-activation of Nuclear factor (erythroid-derived 2)-like 2 (Nrf2), the master transcription factor that regulates antioxidant genes (Sudarshan, et al., 2009, Ooi, et al., 2011, Adam, et al., 2011). Why these cells still exhibit copious amounts of ROS despite activation of Nrf2 is unknown. Cancer cells are known to display higher levels of ROS compared to normal cells leading to activation of signaling pathways such as PI3K, MAPKs and NF-KB, which are required for tumorigenesis (Cairns et al., 2011). In the present study, we investigated the mechanisms underlying the increase in ROS levels in FH deficient human cancer cells and how the high levels of ROS impinges on activation of HIF, Nrf2 and histone hyper-methylation.
Results
Stabilization of HIF1α in FH null cells is ROS dependent
The loss of FH triggers an aberrant increase in HIF1α protein levels under normoxia. Mitochondrial ROS (mito-ROS) can increase HIF1α protein levels (Chandel et al., 1998). Thus, we sought to investigate whether mito-ROS are required for HIF1α protein stabilization in FH deficient human UOK262 cancer cells. These cells display aberrantly high HIF1α protein levels and fumarate levels which are both relieved by reconstitution of a functional FLAG tagged FH to the mitochondria (Figure 1A–D). FH activity was absent in UOK262 cancer cells but abundant in other renal cancer cells including HEK293 and 786-O cells (Figure 1B and S1A). HIF1α activity is also decreased in FH reconstituted cells as shown by reduced HRE luciferase activity and decreased expression of the HIF1α target gene PDK1 (Figure S1B and Figure 1E). Using a mitochondrial targeted redox sensitive GFP (mito-roGFP) we observed that FH deficient cells have increased mito-ROS compared to FH replete cells (Figure 1F). Further, reconstitution of FH caused an overall decrease in intracellular ROS as shown by the ROS probes DCFH and Amplex Red (Figure S1, C and D). In addition, shRNA mediated knockdown of FH in HEK293 cells increased HIF1α levels and intracellular ROS (Figure S1, E and F). To determine whether mito-ROS are required for HIF1α stabilization in UOK262 cells, we utilized the mitochondrial targeted antioxidant mito-vitamin E (MVE). MVE contains the antioxidant vitamin E covalently bound to a triphenylphosphonium cation (TPP), which allows it to preferentially accumulate in the mitochondrial matrix and attenuate the release of H2O2 from the mitochondria (Smith et al., 2011). Compared to mock treatment and TPP control treatment, MVE treated cells show decreased mito-ROS by mito-roGFP (Figure 1G). The decrease in mito-ROS from MVE treated cells reduced HIF1α levels (Figure 1H). Treatment of HEK293 cells expressing FH knockdown shRNAs with the mitochondrial antioxidants mito-CP or MVE also decreased HIF1α levels (Figure S1G). Treatment with UOK262 cells with MVE also decreased HIF1α activity as shown by reduced HRE luciferase activity and decreased PDK1 expression (Figure S1H and Figure 1I). Thus, FH deficiency causes an accumulation of HIF1α by increasing mito-ROS. Treatment with MVE also decreased proliferation (Figure 1J) but not viability (Figure 1K), indicating that mito-ROS are required for growth in these cells.
Figure 1.

FH deficient cells stabilize HIF1α through high ROS signaling.
(A) Subcellular fractionation of UOK262 FH-FLAG cells and western blot for FLAG, SDHA (mitochondrial marker) and tubulin (cytosolic marker). (B) Enzymatic FH activity from mitochondrial fractions of parental UOK262 cells and UOK262 cells expressing control vector (cv) or FH-FLAG. (C) GC-MS analysis showing fumarate concentrations in cv and FH-FLAG UOK262 cells. (D) Western blot for HIF1α, FLAG, and tubulin protein in cv or FH-FLAG UOK262 cells (E) Western blot for PDK1 and tubulin protein in cv or FH-FLAG UOK262 cells (F) Relative levels of oxidized mito-roGFP in cv and FH-FLAG UOK262 cells (G) Relative levels of mito-roGFP oxidation in mock, 1 μM TPP, and 1 μM MVE treated UOK262 cells. (H) Western blot for HIF1α and tubulin protein from UOK262 cells treated with mock treatment, 1 μM TPP, and 1 μM MVE. (I) Western blot for PDK1 and tubulin protein in UOK262 cells treated with mock treatment, 1 μM TPP, and 1 μM MVE. (J) The proliferative effects of treatment with mock treatment, 1 μM TPP, and 1 μM MVE after 48 hours and 96 hours. (K) Viability of cells treated with mock treatment, 1 μM TPP, or 1 μM MVE for 48 hours or 96 hours as determined by trypan blue exclusion. In (B, C, F, G, J, and K) the values denote mean + s.e.m. n = 3 (B, C, J, and K) n = 4 (F), n = 5 (G). *P < 0.05; **P < 0.01.
Oxidative metabolism of 2-oxoglutarate to fumarate is required for HIF1α stabilization, high ROS, and proliferation of UOK262 cells
We previously showed UOK262 cells to be dependent on glutamine for proliferation. Furthermore, carbon labeling experiments demonstrated that UOK262 cells metabolize glutamine to 2-oxoglutarate which is then converted to either citrate by reductive carboxylation or to fumarate by oxidative metabolism (Mullen et al., 2012). To investigate the importance of the metabolism of 2-oxoglutarate to fumarate for the generation of ROS, HIF1α, and proliferation we used shRNA to decrease expression of 2-oxoglutarate dehydrogenase (OGDH) and succinate dehydrogenase subunit A (SDHA), the most proximal and distal enzymes in the metabolism of 2-oxoglutarate to fumarate (Figure 2A). Loss of succinate dehydrogenase subunits B, C, and D are associated with cancer and cells display basal ROS dependent HIF1α activation, whereas loss of SDHA is associated with mitochondrial encephalopathy and does not allow for ROS formation from complex II (Guzy et al., 2008). The loss of OGDH expression led to a decrease in HIF1α levels (Figure 2, B and C). Similarly, depletion of SDHA also decreased HIF1α levels (Figure 2D). Knockdown of OGDH decreased fumarate and succinate levels (Figure S2, A and B). Knockdown of SDHA decreased fumarate levels and minimally increased succinate levels (Figure S2, A and B). It is likely that the accumulation of succinate is dampened because succinyl-CoA will also accumulate which can be funneled into the heme biosynthesis pathway (Frezza, 2011). Consistent with the HIF1α levels, mito-roGFP shows that knockdown of OGDH or SDHA caused a decrease in mito-ROS compared to control vector (Figure 2E). Furthermore, knockdown of OGDH or SDHA inhibited cell growth, indicating oxidative metabolism of 2-oxoglutarate is required for proliferation (Figure 2, F and G). Treatment of UOK262 cells with 3-nitropropionic acid (NPA), an inhibitor of SDH, also inhibited HIF1α stabilization and proliferation (Figure S2, C and D). Collectively these data indicate that fumarate production is required for increased ROS, increased HIF1α, and proliferation in FH deficient human cancer cells.
Figure 2.
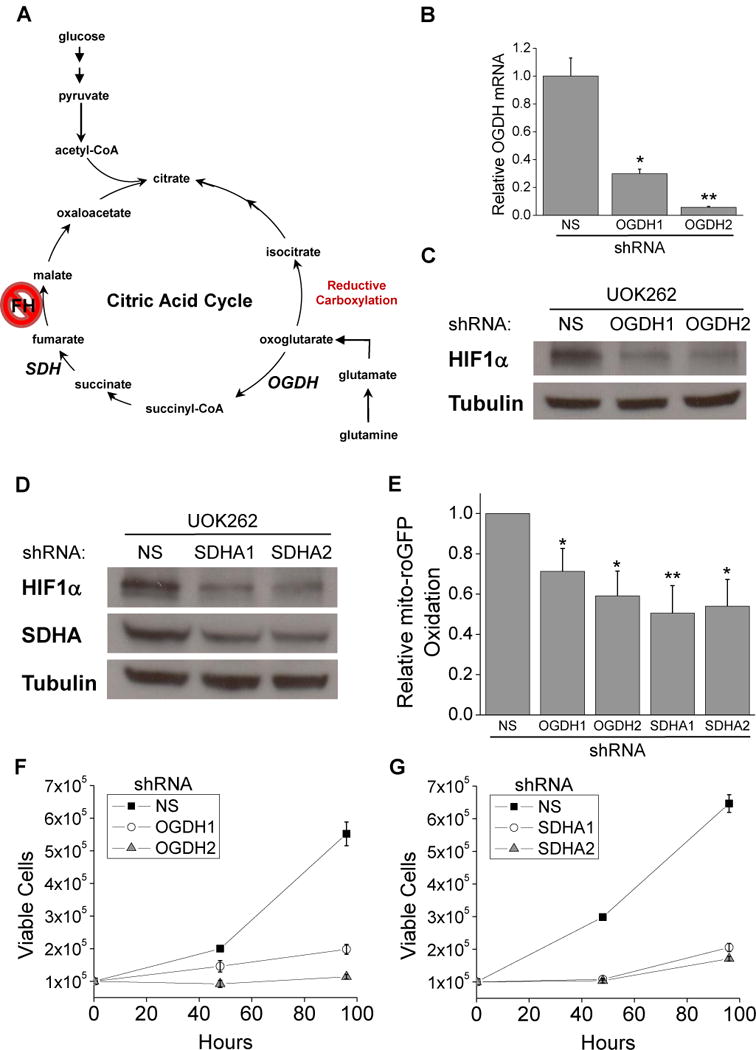
Oxidative metabolism of 2-oxoglutarate to fumarate is required for HIF1α stabilization, high ROS, and proliferation of UOK262 cells.
(A) Schematic of the TCA cycle highlighting two enzymes, OGDH and SDH, which are responsible for the first and last step of the conversion of 2-oxoglutarate to fumarate. (B) Real-time PCR analysis of OGDH expression to check the efficacy of shRNA targeting of OGDH relative to NS control. (C) Western blot for HIF1α and tubulin protein in UOK262 cells expressing NS and OGDH shRNAs. (D) Western blot for HIF1α, SDHA, and tubulin protein in UOK262 cells expressing NS and SDHA shRNAs. (E) Relative levels of oxidized mito-roGFP in UOK262 cells treated with NS, OGDH, and SDHA shRNA. The proliferative effects of OGDH knockdown (F) and SDHA knockdown (G) were measured by plating cells at 105 cells per plate and cells were counted after 48 hours and 96 hours. In (B and E–G) the values denote mean + s.e.m. n = 3 (B, F, G), n = 5 (E). *P < 0.05; **P < 0.01.
Fumarate covalently binds to glutathione in vitro and in FH null cells
Fumarate contains a carbon-carbon double bond recently shown to be susceptible to nucleophilic attack from the thiolate anion of a cysteine. In proteins, the post translational modification of cysteine residues by addition of a fumarate produces the S-(2-succinyl)-cysteine (2SC) adduct, also known as succination (Alderson et al., 2006). FH deficient cells show large amounts of 2SC modifications, the full consequences of which are not fully understood (Bardella et al., 2011). However, reactive cysteines are frequently utilized in redox reactions. Glutathione (GSH), a tripeptide composed of glycine, cysteine, and glutamate is the most abundant and essential intracellular antioxidant. When cells are under oxidative stress, the reactive cysteines from two GSH molecules oxidize to form a disulfide bridge, yielding glutathione dimers (GSSG). GSSG can then be reduced back to GSH by glutathione reductase via the conversion of NADPH to NADP+. The prevalence and importance of GSH suggested an attractive mechanism by which fumarate can cause increased ROS signaling in FH deficient cells: fumarate binds to the cysteine of glutathione to decrease antioxidant capacity and thus enhance endogenous ROS signaling. To test this hypothesis glutathione and fumaric acid were combined in a solution of phosphate buffered saline (PBS) and incubated for 3 hours at 37°C (Figure 3A). The resulting molecular species were identified by MS/MS and showed that fumaric acid could bind to glutathione via succination of the cysteine group to produce GSH+Fum (GSF) (Figure 3B). Fragmentation analysis of the GSF molecule confirmed the location of this covalent bond (Figure S3A). Importantly, succinic acid, which is identical to fumaric acid aside from the central carbon-carbon bond being a single rather than double bond, could not undergo this reaction (Figure 3B). To determine if this reaction occurred in vivo, metabolites were extracted from FH deficient or replete UOK262 cells and quantified by LC/MS/MS. The GSF species was readily detected and abundant in FH null cells whereas its abundance was reduced by nearly 75% after reconstitution of UOK262 with FH-FLAG (Figure 3C and S3B). While the difference in GSF levels between the cell lines was significant, there was a trend of increased GSSG in the FH null cells at the expense of the GSH pool (Figure 3, D and E). These changes in GSSG and GSH are unlikely to fully explain the enhanced ROS levels in these cells. However, we did observe a decrease in mitochondrial NAPDH levels in FH null cells (Figure 3F). NADPH is a crucial metabolite for maintaining antioxidant activity.
Figure 3.

Fumarate covalently bonds to glutathione in vitro and in FH null cells.
(A) Proposed reaction whereby the cysteine on glutathione undergoes a nucleophilic attack on an alkene carbon of fumarate to form GSF. (B) MS/MS analysis of a mixture of 10 mM GSH and 10 mM fumaric acid (left) or 10 mM succinic acid (right) to determine if fumaric acid binds glutathione in vitro. Succinic acid lacks the reactive alkene of fumarate and thus served as a negative control. (C–E) Quantification of LC/MS/MS analysis of glutathione species extracted from cv and FH-FLAG UOK262 cells. (F) Measurement of NADPH ratio in mitochondrial fractions from cv and FH-FLAG UOK262 cells. In (C–F) the values denote mean + s.e.m. n = 3. *P < 0.05; **P < 0.01.
GSF consumes NADPH by acting as an alternative substrate for glutathione reductase
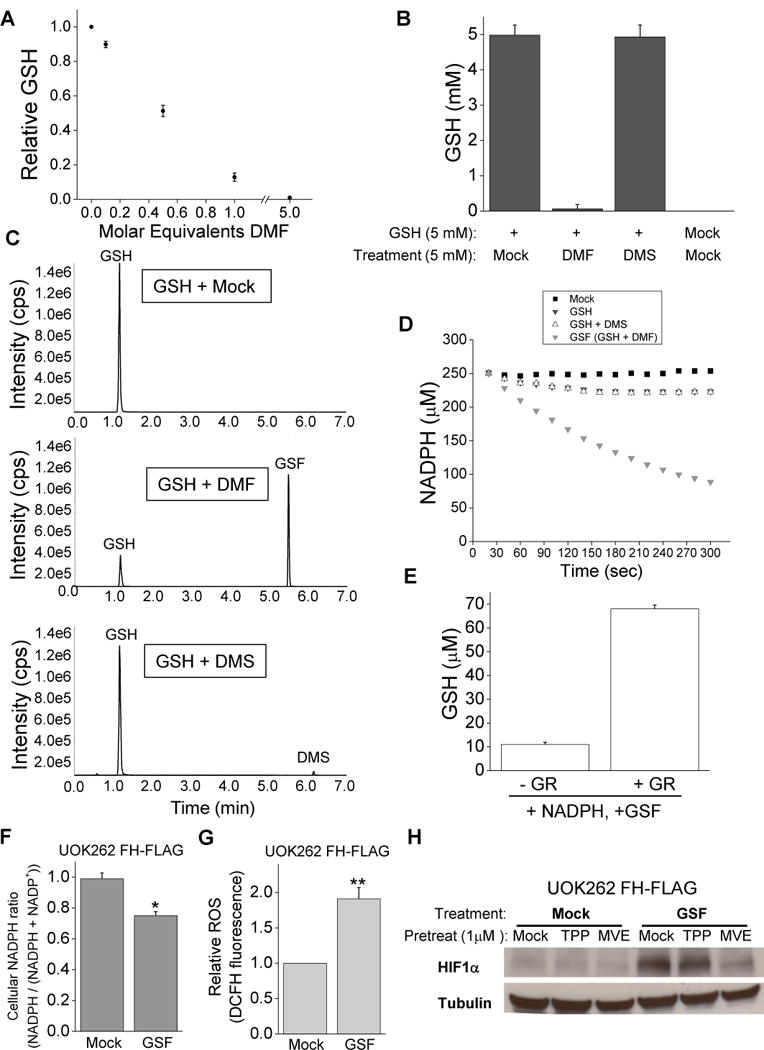
To investigate the consequences of GSF accumulation in UOK262 cells, GSF was synthesized from dimethyl fumarate and glutathione. Dimethyl fumarate (DMF) is a cell permeable analog of fumarate, which has favorable reaction mechanics with glutathione (Schmidt et al., 2007). DMF dose dependently consumes GSH in vitro to form GSF (Figure 4A and S4A). When allowed to react for 1 hour DMF almost entirely consumes GSH, however the cell permeable analog of succinate, dimethyl succinate (DMS), does not (Figure 4B). LC/MS/MS measurement of metabolites from these reactions shows consumption of GSH and production of GSF only in the GSH + DMF condition (Figure 4C). Next, we decided to investigate the effect of GSF on glutathione dependent reactions. Unexpectedly, we discovered that GSF can act as an alternative substrate for glutathione reductase (GR). GR normally acts as a crucial antioxidant enzyme by coupling the reduction of GSSG to GSH to oxidation of NADPH to NADP+. The NADPH/NADP+ ratio can change ROS levels (Jeon, et al., 2012). In an in vitro solution of buffer, NADPH, and GR, GSF activates the consumption of NADPH (figure 4D), indicating GR is consuming GSF. The combination of GSH and DMF does not produce GSSG (data not shown). This reaction is dependent on GR and cannot be reconstituted with DMF or GSH alone (Figure S4 B and C). The consumption of GSF also produces GSH, indicating that it is being split into GSH and DMS (Figure 4E and S4D). The reaction is thus similar to the endogenous reaction between GR and GSSG. The Vmax for the reactions is similar, although the Km for GSF is expectedly about 10-fold higher (Figure S4, E and F). Thus, GSF is likely metabolized in FH null cells by GR while consuming NADPH, explaining the increased mitochondrial NADPH ratio in FH replete cells (Figure 3F). Treatment of FH replete UOK262 cells with cell permeable GSF was sufficient to decrease NADPH levels (Figure 4F). Cell permeable GSF treatment alone also increased ROS and HIF1α levels (Figure 4, G and H). To test the hypothesis that GSF enhances endogenous ROS by decreasing antioxidant capacity, FH replete cells were treated with the mitochondrial targeted antioxidant MVE to block the production of ROS from the mitochondria. MVE attenuated the induction of HIF1α stabilization in response to GSF in UOK262 FH-FLAG cells (Figure 4H). Thus, GSF acts as a previously undescribed alternate substrate to glutathione reductase and consumes NADPH; this decrease in NADPH will lower antioxidant capacity, which will amplify endogenous mitochondrial generated ROS, resulting in stabilization of HIF1α.
Figure 4.
GSF is an alternative substrate for glutathione reductase.
(A) Measurement of GSH after incubation with increasing concentrations of DMF in vitro for 3 hours. (B) Measurement of GSH after 1 hour of incubation under the listed conditions. (C) LC/MS/MS analysis of metabolites generated during a 1-hour incubation of the indicated metabolites. (D) Representative plot of measurement of NADPH concentration over time when mock solution, 5 mM GSH, 5 mM GSH + 5 mM DMF, or 5 mM GSH + 5 mM DMS were added to a solution of 250 μM NADPH and 0.05 U/ml glutathione reductase. (E) Measurement of GSH levels of solutions of GSF and NADPH with or without glutathione reductase. (F) Measurement of NADPH ratio in FH-FLAG UOK262 cells treated with mock treatment or 0.5 mM GSF for 3 hours. (G) Relative intracellular ROS level was determined by DCFH fluorescence in FH-FLAG UOK262 cells treated with mock treatment or 0.5 mM GSF for 3 hours. (H) Western blot for HIF1α and tubulin protein from FH-FLAG UOK262 cells pretreated for 21 hours with mock treatment, 1 μM TPP, and 1μM MVE and treated for 3 hours with mock treatment or 0.5 mM GSF. In (A) the values denote mean +/− s.e.m, n=3 while in (B, E–G) the values denote mean + s.e.m. n = 3. *P < 0.05; **P < 0.01.
Loss of Nrf2 increases ROS and HIF-1 in FH deficient cancer cells
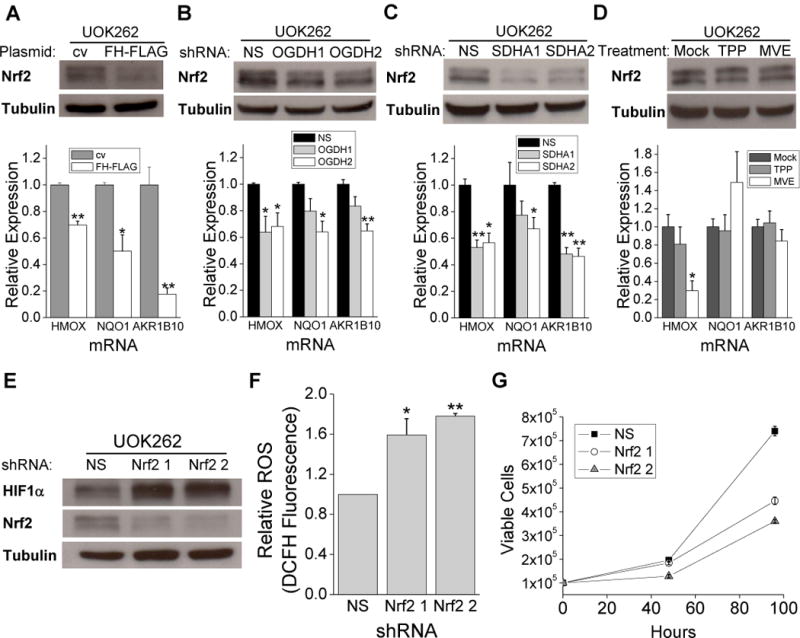
Recent studies have shown that FH deficient cells demonstrate high steady state levels of the transcription factor Nrf2, a master regulator for a suite of downstream antioxidant genes (Ooi, et al., 2011, Adam, et al., 2011). Fumarate accumulation in FH null cells has been reported to increase levels of Nrf2 by succination of redox sensitive cysteines on KEAP1, a component of an E3 ubiquitin ligase complex. Succination of KEAP1 inhibits the ability to degrade Nrf2 and results in the accumulation and nuclear translocation of Nrf2 and activation of antioxidant genes. The significance of Nrf2 activation is not fully understood in FH null cells. While succination is an important mechanism in these cells, ROS also inhibit KEAP activity to stabilize Nrf2 (Fourquet et al., 2010). Thus we sought to determine if Nrf2 accumulation in UOK262 cells is a result of succination, ROS, or both. As previously described, Nrf2 protein abundance and the mRNA abundance of the Nrf2 target genes heme oxygenase 1 (HMOX), NAD(P)H dehydrogenase quinone 1 (NQO1), and aldo-keto reductase family 1 member B10 (AKR1B10) were decreased by FH reconstitution (Figure 5A). Diminishing SDHA or OGDH decreased Nrf2 activation and target gene expression in UOK262 cells suggesting that fumarate accumulation is critical for the increase in Nrf2 activation (Figure 5, B and C). To test whether mito-ROS were required for Nrf2 activation, we treated FH deficient cells with MVE or control TPP. MVE did not prevent of Nrf2 stabilization or diminish Nrf2 target genes in UOK262 cells indicating that mito-ROS are not essential for NRF2 activation (Figure 5D). Further, treatment with the cell permeable analogue of fumarate, dimethyl fumarate, enhanced Nrf2 and Nrf2 target gene expression regardless of MVE treatment (Figure S5A). However, cell permeable dimethyl fumarate but not dimethyl succinate increased HIF1α levels in a mito-ROS dependent manner in FH replete cells (Figure S5 B–D). Thus, It is likely fumarate mediated succination of Keap1 is the dominant mechanism for Nrf2 activation (Figure S5E). Note that HMOX did diminish in the presence of MVE indicating that this gene is likely targeted by additional transcription factors other than Nrf2. Previous studies have suggested that HIF1 could increase HMOX (Lee, et al., 1997). To investigate the interplay between Nrf2 levels and ROS, Nrf2 was depleted in UOK262 cells with shRNA and resulted in further HIF1α stabilization (Figure 5E) and a concomitant increase in intracellular ROS (Figure 5F). Interestingly, the decrease in Nrf2 compromised proliferation of FH-deficient UOK262 cells suggesting that the maintenance of favorable redox balance by Nrf2 may be required for cell proliferation (Figure 5G).
Figure 5.
Nrf2 is stabilized by fumarate and helps mitigate ROS.
(A) Western blot for Nrf2 and tubulin protein and RT-PCR of Nrf2 target genes from cv and FH-FLAG UOK262 cells. (B) Western blot for Nrf2 and tubulin protein and RT-PCR of Nrf2 target genes from UOK262 cells expressing NS and OGDH shRNAs. (C) Western blot for Nrf2 and tubulin protein and RT-PCR of Nrf2 target genes from UOK262 cells expressing NS and SDHA shRNAs. (D) Western blot for Nrf2 and tubulin protein and RT-PCR of Nrf2 target genes from UOK262 cells treated with mock treatment, 1 μM TPP, and 1 μM MVE. (E) Western blot for HIF1α, Nrf2, and tubulin protein in UOK262 cells expressing NS or Nrf2 shRNAs. (F) Relative intracellular ROS level was determined by DCFH fluorescence in UOK262 cells expressing NS or Nrf2 shRNAs. (G) The proliferative effects of Nrf2 knockdown were measured after 48 hours and 96 hours. In (A–D, F, and G) the quantified values denote mean + s.e.m. n = 3. *P < 0.05; **P < 0.01.
FH deficient cancer cells display histone hyper-methylation
It is increasingly appreciated that histone methylation can be important for cancer development (Chi et al., 2010). It has been reported that loss of FH by RNAi can also increase global histone methylation (Xiao, et al., 2012). Histone demethylases are 2-oxoglutarate dependent enzymes in the same family as the ROS inhibited enzymes PHD2 and factor inhibiting HIF-1α (FIH), the negative regulators of HIF1α (Loenarz and Schofield, 2011). Thus, we hypothesized that histone demethylases may also be inhibited by ROS in UOK262 cells. Indeed, reconstitution of FH decreases global histone methylation on several lysine residues (Figure 6, A and B). While fumarate can act as an inhibitor of the histone demethylase JMJD2A in vitro (Figure 6C), nanomolar levels of H2O2 can also decrease JMJD2A activity in vitro (Figure 6D). In a cellular environment such as UOK262 cells both of these inhibitors would likely be present so we tested a combination of a sub-inhibitory dose of fumarate (1mM) and found that it can synergize with H2O2 to further inhibit JMJD2A in vitro (Figure 6E). Collectively, our results indicate that enhanced H2O2 may cooperate with fumarate to inhibit histone demethylases and increase histone hyper-methylation in FH deficient cancer cells (Figure S6).
Figure 6.

ROS inhibit histone demethylation.
(A) Representative western blot for histone methylation markers and H4 protein loading control from nuclear extracts of UOK262 cells expressing cv and FH-FLAG plasmids. (B) Densitometric quantification of histone methylation markers relative to H4 loading control of UOK262 cv and FH-FLAG cells. (C) Measurement of demethylase activity of JMJD2A in vitro in the presence of fumarate, succinate, and N-oxalylglycine (NOG). (D) Measurement of demethylase activity of JMJD2A in vitro in the presence H2O2. (E) Measurement of synergistic inhibition of JMJD2A in vitro in the presence or absence of 1 mM fumarate and various doses of H2O2. Values are relative to activity of mock or fumarate treated cells without H2O2. In (B–E) the values denote mean + s.e.m. n = 3. *P < 0.05; **P < 0.01.
Complex I deficiency contributes to high ROS and glycolytic phenotype in FH deficient cancer cells
A recent study demonstrated that UOK262 cells display nearly absent mitochondrial complex I activity (Tong, et al., 2011). Loss of complex I activity in cancer cells has been shown to increase ROS levels, resulting in HIF1α stabilization, increased AKT phosphorylation, and metastasis (Sharma et al., 2011, Ishikawa et al., 2008). To test if complex I deficiency contributed to the mitochondrial impairment, ROS elevation, and HIF1α stabilization of UOK262 cells, we reconstituted complex I electron transfer, but not proton pumping, in FH null and replete UOK262 cells using the yeast NADH quinone oxidoreductase (NDI1). NDI1 is a rotenone insensitive, single subunit protein capable of restoring NADH oxidation and can restore mitochondrial respiration in mammalian cells defective of complex I activity (Seo et al., 1998). UOK262 cells expressing control vector (cv) and FH-FLAG were infected with virus containing either control vector with blue fluorescent protein (BFP) or NDI1 with BFP (NDI1-BFP) (Figure 7A). NDI1 expression was abundant and approximately equal in cells transduced with NDI1 (Figure 7B). Reconstitution of both FH and complex I restored mitochondrial oxygen consumption to UOK262 cells (Figure 7C). The restored mitochondrial function allowed the cells to survive in glucose free media containing galactose (Figure 7D). Galactose is poorly utilized by glycolysis and serves as a control for sugar in the media. Interestingly, NDI1 expression only restored complex I activity in FH replete cells, as determined by mitochondrial oxygen consumption of saponin permeabilized cells incubated with TCA cycle intermediate metabolites pyruvate/malate, glutamate/malate, or palmitoylcarnitine/malate (Figure 7E and Figure S7B and C). Succination of metabolic enzymes can inhibit their activity, providing a potential mechanism for why NDI1 expression did not reconstitute complex I activity in FH null cells (Blatnik et al, 2008). The rotenone insensitive fraction of complex I activity represents the contribution of NDI1 to complex I activity. Complex II activity, which is required for the production of fumarate, was unaffected by FH or complex I status (Figure 7F). Reconstitution of complex I activity attenuated HIF1α levels in FH null and replete cells (Figure 7G). NDI1 expression also decreased mito-ROS as determined by relative mito-roGFP oxidation and mitoSOX fluorescence (Figure 7H and Figure S7D). Cells expressing NDI displayed decreased histone methylation; further suggesting ROS may inhibit histone demethylases (Figure S7E). Thus, complex I impairment, in addition to FH deficiency, provides increased mito-ROS production to trigger HIF1α stabilization in UOK262 cells.
Figure 7.

Both FH and complex I dysfunction contribute to HIF1α stabilization, high ROS, loss of mitochondrial oxygen consumption, and reductive carboxylation in UOK262 cells.
(A) Table describing the cell line labels and their associated plasmids. (B) Real-time PCR analysis of NDI expression. (C) Mitochondrial OCR for the four UOK262 cell lines. (D) Cell death from the four UOK262 cell lines after 24 hours in complete DMEM containing 10 mM glucose, or glucose free DMEM supplemented with 10 mM galactose, as determined by percent of cells that uptake propidium iodide. (E) Mitochondrial OCR for saponin permeabilized UOK262 cell lines when treated with 10 mM pyruvate and 2 mM malate. Rotenone sensitive fraction was measured by the decrease in OCR after addition of 2 μM rotenone. (F) Mitochondrial OCR for saponin permeabilized UOK262 cell lines when treated with 10 mM succinate. (G) Western blot for HIF1α and tubulin protein from the four UOK262 cell lines. (H) Relative levels of oxidized mito-roGFP from the four UOK262 cell lines. (I) GC/MS analysis of the mass isotopomer distribution of citrate in cells cultured with D[U-13C]glucose and unlabelled glutamine. (J) GC/MS analysis of the mass isotopomer distribution of citrate in cells cultured with L[U-13C]glutamine and unlabelled glucose. In (B–F, H) the values denote mean + s.e.m. In (I and J) the values denote mean + standard deviation. n = 3 (B, D, I, J), n = 5 (C, E, F), n = 6 (H). *P < 0.05; **P < 0.01 compared to cell line 1.
In normal cells, citrate is produced in the TCA cycle by the addition of 2 carbons from acetyl-CoA to a 4 carbon oxaloacetate molecule. We recently reported a novel mechanism by which cells with mitochondrial mutations, including UOK262 cells, can produce citrate without the use of glycolytic derived acetyl-CoA (Mullen et al., 2012). In these cells glutamine is converted to 2-oxoglutarate, a 5 carbon metabolite, and via the reverse direction of canonical TCA cycle metabolism will add a carbon to produce citrate, a process called reductive carboxylation (Figure 2A). Thus, we sought to investigate whether complex I impairment contributed to reductive carboxylation in UOK262 cells. Carbon labeling of metabolites allows us to determine the metabolic pathway that cells use for de novo citrate synthesis. To determine the contribution of glucose derived carbon to this process, we cultured all cell lines with glucose labeled on all 6 carbons (U-13C-glucose) and observed the mass isotopomer distribution of the citrate pool via gas chromatography mass spectrometry (GC/MS). Citrate labeled m+2 results from the oxidative decarboxylation of glucose-derived pyruvate to form 1,2-13C-acetyl-CoA, followed by condensation with an unlabeled oxaloacetate (OAA). Only UOK262 cells with both FH and complex I reconstituted were observed to produce glycolytic derived citrate (Figure 7I). Additionally, these cells also produced citrate labeled m+4, which is formed when an M+2 labeled citrate molecule is retained in the TCA cycle to generate an m+2 labeled OAA and then combines with a labeled acetyl-CoA thus producing an M+4 labeled citrate; this is evidence of a complete TCA cycle. Similarly, to determine the contribution of glutamine carbon to the citrate pool we cultured all cell lines with glutamine labeled on all 5 carbons (U-13C-glutamine). We’ve previously shown that UOK262 cells produce citrate through metabolism of glutamine-derived 2-oxoglutarate through the reductive carboxylation pathway; when cultured with U-13C-glutamine this generates citrate labeled m+5. The reconstitution of FH in UOK262 decreases the amount of citrate m+5 and increases the amount formed through oxidative TCA cycle metabolism, citrate m+4 (Figure 7J). Citrate m+4 is formed when glutamine-derived 2-oxoglutarate is oxidized in the TCA cycle to form OAA m+4 which then condenses with an unlabeled acetyl-CoA. The addition of both FH and NDI1 further enhanced the amount of oxidative citrate formation and decreased the reductive citrate formation. Together, these results indicate that both FH loss and complex I impairment contribute to the metabolic dysfunction and reductive carboxylation in human FH deficient cancer cells.
Discussion
Mitochondrial metabolism provides cancer cells with essential metabolites for the biosynthesis of macromolecules and ROS for proliferation and adaptation to metabolic stress. However, there is a subset of cancers which arise from mutations which abolish activity of TCA cycle enzymes, including FH. A consequence of FH deficiency is the aberrant stabilization of HIF1α under normoxia. The hydroxylation reaction that targets HIF1α for degradation requires 2-oxoglutarate. Fumarate, which accumulates in FH null cells, can compete with 2-oxoglutarate to prevent hydroxylation (Koivunen et al., 2007). However, it is important to note that the PHD2 has a much lower dissociation constant (Kd) for 2-oxoglutarate than fumarate and the levels of fumarate would have to vastly exceed 2-oxogluatrate levels in FH deficient cells (Hewitson, et al., 2007). An alternative, but not mutually exclusive, mechanism for HIF1α accumulation is that FH deficient cells utilize ROS to increase HIF1α stabilization. The reconstitution of FH in the mitochondria diminished ROS and HIF1α protein levels. Importantly, the scavenging of mito-ROS prevents the aberrant increase in HIFα protein in FH deficient cancer cells. Furthermore, preventing the accumulation of fumarate by decreasing SDHA and OGDH expression diminished mito-ROS and HIFα protein accumulation. Thus suggesting that fumarate accumulation itself could be causing the increase in ROS.
The increase in ROS is due to the reaction of fumarate with reduced glutathione both in vitro and in FH deficient cells to produce GSF, novel cancer associated metabolite. GSF can react with glutathione reductase to consume NADPH, which is a crucial cofactor used to restore reduced glutathione and peroxiredoxins. The latter are the major enzymes utilized to detoxify H2O2 required for cellular signaling. In the presence of GSF, NADPH is being consumed even though the GSF has not been used as an antioxidant. Thus, GSF consumes reducing equivalents of NADPH without the antioxidant payoff. With NADPH being consumed by GSF, FH deficient cells will have decreased NADPH leading to increased levels of ROS. Indeed, treatment of FH replete cells with GSF was sufficient to decrease NADPH, increase ROS, and increase HIF1α levels. Importantly, GSF could not activate HIF1α in the presence of MVE, indicating that GSF itself does not produce ROS, but rather, it enhances endogenous ROS by decreasing steady state antioxidant capacity.
A puzzling aspect of FH deficient human cancer cells and mouse cells is that despite the increased ROS, there is also an increase in Nrf2, a transcription factor which activates the expression of antioxidant genes. Cancer cells require moderate levels of mito-ROS for cell proliferation and adaptation to stress (Cairns et al., 2011). The accumulation of fumarate in FH deficient human cancer cells triggers Nrf2 which, through its stimulation of antioxidant pathways, prevents ROS from accumulating to levels that trigger damage. Indeed, reducing Nrf2 levels in the UOK262 cells enhanced ROS and diminished cell proliferation. Thus, we propose the major function of Nrf2 in UOK262 cells is to control ROS levels elevated by fumarate to those compatible with cell proliferation.
A recent study demonstrated that RNAi of FH in HEK293 cells also increases hyper-methylation of histones (Xiao, et al. 2012). We extend these observations by demonstrating that naturally FH deficient cancer cells, UOK262 cells, also display aberrant hyper-methylation without any noticeable increase in 2-HG. Jumonji-domain histone demethylases (JHDMs) are 2-oxoglutarate dependent dioxygenases, like PHDs and FIH. JHDMs have previously been shown to be inhibited by fumarate at high concentrations. In the present study we observed that a low concentration of H2O2 can also decrease the activity of a JDMH in vitro. Furthermore, H2O2 cooperated with sub-inhibitory levels of fumarate to further inhibit the activity of a JHDM in vitro. We propose that the elevation of H2O2 in FH null cells contributes to the hyper-methylation of histones by inhibiting JHDMs. It remains to be determined whether the hyper-methylation of histones contributes to the tumorigenic and metastatic potential of UOK262 cells.
Intriguingly, our metabolic analysis of UOK262 human cancer cells showed that in addition to FH deficiency these cells have acquired a complex I impairment. The mechanism by which this occurs is unclear. RNAi –mediated suppression of FH does not result in complex I impairment in HEK293 human cancer cells (data not shown). In addition, since FH deficiency already impairs mitochondrial metabolism, there is no obvious reason why the cell would be advantaged by further mitochondrial defects. The loss of complex I activity in UOK262 cells did cause further increase ROS levels and HIF1α protein stabilization, which could be rescued by expression of NDI1. While previous studies have suggested HIFs are unlikely to be required for FH deficient cancer cell growth (Adam, et al., 2011), they represent an output of increased ROS and may play a role in invasion and metastasis. Indeed, complex I mutations have been shown to increase ROS, HIF1α, and metastasis (Sharma et al., 2011, Ishikawa et al., 2008). We propose that the elevated ROS levels in UOK262 cells serve to further increase their tumorigenic and metastatic potential.
In summary, our results indicate that loss of FH associated with HLRCC results in accumulation of fumarate which chemically reacts with reduced glutathione, forming a novel cancer associated metabolite, GSF. GSF reacts with GR to deplete NADPH levels, yielding an increase in ROS and ROS dependent signaling. While HLRCC is a relatively rare form of cancer the relevance of fumarate accumulation extends beyond this condition. FH levels have been shown to be decreased in non-HLRCC renal cell carcinomas from patient samples and cell lines (Sudarshan et al., 2011). Fumarate levels can be elevated in other forms of cancer such as colon and stomach (Hirayama et al., 2009). Fumarate accumulation and protein succination has been observed in diabetic rats and mice (Alderson et al. 2006, Frizzell et al., 2009). Future studies will be required to determine whether fumarate accumulation and concomitant increases in ROS play a causal role in other types of cancer and metabolic disorders.
Experimental Procedures
Cell culture
UOK262 cells were cultured in Dulbecco’s modified Eagle’s medium supplemented with 10% fetal bovine serum, 1% HEPES, and 1% penicillin-streptomycin. Cells transduced with FH-FLAG and control vectors were under continuous puromycin selection (2μg/ml). Selection of cells containing the BFP containing NDI1 and control vectors was done by periodic fluorescence activated cell sorting for BFP positive cells using a MoFlo (Beckman-Coulter). Proliferation assays, RT-PCR analysis, and subcellular fractionation methods are provided in supplementary procedures.
FH activity assay
FH activity from mitochondrial fractions of cells was quantified as detailed in (Hatch, 1978).
Infection with shRNAs
The pLKO.1 validated shRNA lentiviral vectors against OGDH, SDHA, Nrf2, and FH were obtained from Sigma. Virus was produced in 293FT packaging cells and viral doses were determined by the lowest amount of virus needed for minimal cell death upon treatment with puromycin.
Immunoblot Assays
Protein lysates were extracted using cell lysis buffer (Cell Signaling) and quantified by BCA Protein Assay (Pierce). Samples were resolved on SDS polyacrylamide gel (Bio-Rad) and transferred to nitrocellulose membrane by semi-dry transfer. Samples were analyzed by immunoblotting with antibodies for HIF1α (BD Bioscience), SDHA (MitoSciences), Nrf2 (Novus), Tubulin, FLAG, and FH (Sigma).
For histone analysis, nuclear extracts were prepared using the Nuclear Complex co-IP kit (Active Motif) following the manufacturer’s instructions. 5 μg of each sample were immunoblotted with the following antibodies: H3K9me2 (Abcam), H3K9me3 (Millipore), H3K27me2 (Millipore), H3K27me3 (Millipore), Total H4 (Abcam).
ROS measurements
Mito-roGFP, DCFH and Amplex Red measurements were done as detailed in (Weinberg, et al. 2010).
LC/MS/MS conditions to detect succinated GSH
The experiment was performed on a Shimadzu UPLC system (Shimadzu Scientific Instruments) coupled with an ABSCIEX QTRAP 5500 mass spectrometry detector (AB SCIEX). The chromatographic separation was achieved on a Microsolve Technology (Eatontown) Cogent Diamond Hydride column (150 mm × 2.1 mm, 4μm dp, 100 Å pore size) at 35°C with the aqueous mobile phase A (10 mM ammonium acetate) and the organic mobile phase B (acetonitrile/water (90/10), 10 mM ammonium acetate). The gradient was from 90%B to 70%B for 4 minutes, from 70%B to 50%B for 1 minute, and then held at 50%B for 5 minutes. Before each run, the column was equilibrated for 5 minutes. The flowrate was 0.4 mL/minute and the injection volume was 10 μL. The mass spectrometry (MS) was operated in the negative mode and multiple reaction monitoring (MRM). All dependent MS parameters were optimized, based on infusion experiments. The tandem transition from the parent ions of [M-H]− to the fragment ions of 71 m/z for fumaric acid (FUM), 272 m/z for glutathione reduced (GSH) and oxidized (GSSG), were monitored for quantitative analysis. Data were acquired and analyzed using Analyst software version 1.6. Methods to quantify succinated GSH are provided in supplemental procedures.
Determination of NADPH/NADP+ ratio
NADPH ratio was determined by taking whole cell or mitochondrial lysates and following manufacturer’s protocols for the NADP+/NADPH assay kit (Abcam).
Quantitation of GSH
GSH from in vitro reactions was measured by diluting samples in buffer and adding of 300 μM 5,5′-Dithiobis(2-nitrobenzoic acid) (dtnb) and measuring the absorbance at 412 nm after 10 minutes. Values were compared to a standard curve of GSH.
Glutathione reductase assay
GSF and control substrates were incubated for one hour at room temperature in a solution of 50 mM Tris, 5 mM EDTA. The pH was 7.8 to mimic the pH of the mitochondrial matrix, where GSF is most likely synthesized. Substrates were added to a solution of 250 μM NADPH and 0.05 U/ml glutathione reductase. NADPH consumption was monitored by loss of absorbance at 340 nm, and concentration was determined by comparing to a standard curve.
Histone demethylase activity assay
Activity of the histone demethylase JMJD2A was determined by following manufacturer’s protocol for a JMJD2A inhibitor screening assay kit (Cayman).
Measurement of oxygen consumption
Oxygen consumption rates (OCRs) were determined on a Seahorse Bioscience Extracellular Flux Analyzer (XF24). Specific methods are in Supplemental procedures.
Carbon flux metabolites
Mass isotopomer analysis of carbon labeled metabolites was performed as previously described (Mullen et al., 2012).
Statistical analysis
Unless otherwise noted, data are presented as mean ± SEM. Statistical significance was determined using two-sample Student’s t test comparing experimental conditions to appropriate controls. Statistical significance was determined at a value of P < 0.05 or P < 0.01.
Supplementary Material
Highlights.
FH loss increases fumarate resulting in mitochondrial ROS activation of HIF-1.
Fumarate covalently bonds glutathione to produce succinated glutathione (GSF).
GSF is a substrate of glutathione reductase and consumes NADPH to enhance ROS.
Increased ROS due to FH deficiency contributes to hyper-methylation of histones.
Acknowledgments
This work is supported by NIH (R01CA123067) to N.S.C. and NIH (R01CA157996) and the Robert A. Welch Foundation (I1733) to R.J.D. The work was also supported L.B.S. from NIH Training grant T32 GM08061 and A.R.M. from NIH Training grant (5T32GM083831). J.D.L was supported by Northwestern University Physical Sciences Oncology Center Grant U54CA143869. We thank Drs. Balaraman Kalyanaraman and Joy Joseph for their kind contribution of MVE. We are grateful to Youfeng Yang and W. Marston Linehan at the NCI for providing the UOK262 cells. We thank Alena Heath for designing the graphical abstract. The authors declare no conflicts of interest.
Footnotes
Publisher's Disclaimer: This is a PDF file of an unedited manuscript that has been accepted for publication. As a service to our customers we are providing this early version of the manuscript. The manuscript will undergo copyediting, typesetting, and review of the resulting proof before it is published in its final citable form. Please note that during the production process errors may be discovered which could affect the content, and all legal disclaimers that apply to the journal pertain.
References
- Adam J, Hatipoglu E, O’Flaherty L, Ternette N, Sahgal N, Lockstone H, Baban D, Nye E, Stamp Gordon W, Wolhuter K, et al. Renal Cyst Formation in Fh1-Deficient Mice Is Independent of the Hif/Phd Pathway: Roles for Fumarate in KEAP1 Succination and Nrf2 Signaling. Cancer Cell. 2011;20:524–537. doi: 10.1016/j.ccr.2011.09.006. [DOI] [PMC free article] [PubMed] [Google Scholar]
- Alderson NL, Wang Y, Blatnik M, Frizzell N, Walla MD, Lyons TJ, Alt N, Carson JA, Nagai R, Thorpe SR, et al. S-(2-Succinyl)cysteine: A novel chemical modification of tissue proteins by a Krebs cycle intermediate. Arch Biochem Biophys. 2006;450:1–8. doi: 10.1016/j.abb.2006.03.005. [DOI] [PubMed] [Google Scholar]
- Bardella C, El-Bahrawy M, Frizzell N, Adam J, Ternette N, Hatipoglu E, Howarth K, O’Flaherty L, Roberts I, Turner G, et al. Aberrant succination of proteins in fumarate hydratase-deficient mice and HLRCC patients is a robust biomarker of mutation status. J Pathol. 2011;225:4–11. doi: 10.1002/path.2932. [DOI] [PubMed] [Google Scholar]
- Blatnik M, Frizzell N, Thorpe SR, Baynes JW. Inactivation of Glyceraldehyde-3-Phosphate Dehydrogenase by Fumarate in Diabetes. Diabetes. 2008;57:41–49. doi: 10.2337/db07-0838. [DOI] [PMC free article] [PubMed] [Google Scholar]
- Cairns RA, Harris IS, Mak TW. Regulation of cancer cell metabolism. Nat Rev Cancer. 2011;11:85–95. doi: 10.1038/nrc2981. [DOI] [PubMed] [Google Scholar]
- Chandel NS, Maltepe E, Goldwasser E, Mathieu CE, Simon MC, Schumacker PT. Mitochondrial reactive oxygen species trigger hypoxia-induced transcription. Proc Natl Acad Sci USA. 1998;95:11715–11720. doi: 10.1073/pnas.95.20.11715. [DOI] [PMC free article] [PubMed] [Google Scholar]
- Chi P, Allis CD, Wang GG. Covalent histone modifications — miswritten, misinterpreted and mis-erased in human cancers. Nat Rev Cancer. 2010;10:457–469. doi: 10.1038/nrc2876. [DOI] [PMC free article] [PubMed] [Google Scholar]
- DeBerardinis RJ, Cheng T. Q’s next: the diverse functions of glutamine in metabolism, cell biology and cancer. Oncogene. 2009;29:313–324. doi: 10.1038/onc.2009.358. [DOI] [PMC free article] [PubMed] [Google Scholar]
- Fourquet S, Guerois R, Biard D, Toledano MB. Activation of NRF2 by Nitrosative Agents and H2O2 Involves KEAP1 Disulfide Formation. J Biol Chem. 2010;285:8463–8471. doi: 10.1074/jbc.M109.051714. [DOI] [PMC free article] [PubMed] [Google Scholar]
- Frezza C, Zheng L, Folger O, Rajagopalan KN, MacKenzie ED, Jerby L, Micaroni M, Chaneton B, Adam J, Hedley A, et al. Haem oxygenase is synthetically lethal with the tumour suppressor fumarate hydratase. Nature. 2011;477:225–228. doi: 10.1038/nature10363. [DOI] [PubMed] [Google Scholar]
- Frizzell N, Rajesh M, Jepson MJ, Nagai R, Carson JA, Thorpe SR, Baynes JW. Succination of Thiol Groups in Adipose Tissue Proteins in Diabetes. J Biol Chem. 2009;284:25772–25781. doi: 10.1074/jbc.M109.019257. [DOI] [PMC free article] [PubMed] [Google Scholar]
- Guzy RD, Sharma B, Bell E, Chandel NS, Schumacker PT. Loss of the SdhB, but Not the SdhA, Subunit of Complex II Triggers Reactive Oxygen Species-Dependent Hypoxia-Inducible Factor Activation and Tumorigenesis. Mol Cell Biol. 2008;28:718–731. doi: 10.1128/MCB.01338-07. [DOI] [PMC free article] [PubMed] [Google Scholar]
- Hatch MD. A Simple Spectrophotometric Assay for Fumarate Hydratase in Crude Tissue Extracts. Anal Biochem. 1978;85:271–275. doi: 10.1016/0003-2697(78)90299-3. [DOI] [PubMed] [Google Scholar]
- Hewitson KS, Liénard BMR, McDonough MA, Clifton IJ, Butler D, Soares AS, Oldham NJ, McNeill LA, Schofield CJ. Structural and Mechanistic Studies on the Inhibition of the Hypoxia-inducible Transcription Factor Hydroxylases by Tricarboxylic Acid Cycle Intermediates. J Biol Chem. 2007;282:3293–3301. doi: 10.1074/jbc.M608337200. [DOI] [PubMed] [Google Scholar]
- Hirayama A, Kami K, Sugimoto M, Sugawara M, Toki N, Onozuka H, Kinoshita T, Saito N, Ochiai A, Tomita M, et al. Quantitative Metabolome Profiling of Colon and Stomach Cancer Microenvironment by Capillary Electrophoresis Time-of-Flight Mass Spectrometry. Cancer Res. 2009;69:4918–4925. doi: 10.1158/0008-5472.CAN-08-4806. [DOI] [PubMed] [Google Scholar]
- Isaacs JS, Jung YJ, Mole DR, Lee S, Torres-Cabala C, Chung YL, Merino M, Trepel J, Zbar B, Toro J, et al. HIF overexpression correlates with biallelic loss of fumarate hydratase in renal cancer: Novel role of fumarate in regulation of HIF stability. Cancer Cell. 2005;8:143–153. doi: 10.1016/j.ccr.2005.06.017. [DOI] [PubMed] [Google Scholar]
- Ishikawa K, Takenaga K, Akimoto M, Koshikawa N, Yamaguchi A, Imanishi H, Nakada K, Honma Y, Hayashi JI. ROS-Generating Mitochondrial DNA Mutations Can Regulate Tumor Cell Metastasis. Science. 2008;320:661–664. doi: 10.1126/science.1156906. [DOI] [PubMed] [Google Scholar]
- Jeon S, Chandel NS, Hay N. AMPK regulates NADPH homeostasis to promote tumour cell survival during energy stress. Nature. 2012;485:661–665. doi: 10.1038/nature11066. [DOI] [PMC free article] [PubMed] [Google Scholar]
- Kaelin WG, Jr, Ratcliffe PJ. Oxygen Sensing by Metazoans: The Central Role of the HIF Hydroxylase Pathway. Mol Cell. 2008;30:393–402. doi: 10.1016/j.molcel.2008.04.009. [DOI] [PubMed] [Google Scholar]
- Koivunen P, Hirsilä M, Remes AM, Hassinen IE, Kivirikko KI, Myllyharju J. Inhibition of Hypoxia-inducible Factor (HIF) Hydroxylases by Citric Acid Cycle Intermediates. J Biol Chem. 2007;282:4524–4532. doi: 10.1074/jbc.M610415200. [DOI] [PubMed] [Google Scholar]
- Lee PJ, Jiang BH, Chin BY, Iyer NV, Alam J, Semenza GL, Choi AMK. Hypoxia-inducible Factor-1 Mediates Transcriptional Activation of the Heme Oxygenase-1 Gene in Response to Hypoxia. J Biol Chem. 1997;272:5375–5381. [PubMed] [Google Scholar]
- Loenarz C, Schofield CJ. Physiological and biochemical aspects of hydroxylations and demethylations catalyzed by human 2-oxoglutarate oxygenases. Trends in Biochem Sci. 2011;36:7–18. doi: 10.1016/j.tibs.2010.07.002. [DOI] [PubMed] [Google Scholar]
- Lunt SY, Vander Heiden MG. Aerobic Glycolysis: Meeting the Metabolic Requirements of Cell Proliferation. Annu Rev Cell Dev Biol. 2011;27:441–464. doi: 10.1146/annurev-cellbio-092910-154237. [DOI] [PubMed] [Google Scholar]
- Mullen AR, Wheaton WW, Jin ES, Chen PH, Sullivan LB, Cheng T, Yang Y, Linehan WM, Chandel NS, DeBerardinis RJ. Reductive carboxylation supports growth in tumour cells with defective mitochondria. Nature. 2012;481:385–388. doi: 10.1038/nature10642. [DOI] [PMC free article] [PubMed] [Google Scholar]
- Ooi A, Wong JC, Petillo D, Roossien D, Perrier-Trudova V, Whitten D, Min Bernice Wong H, Tan MH, Zhang Z, Yang Ximing J, et al. An Antioxidant Response Phenotype Shared between Hereditary and Sporadic Type 2 Papillary Renal Cell Carcinoma. Cancer Cell. 2011;20:511–523. doi: 10.1016/j.ccr.2011.08.024. [DOI] [PubMed] [Google Scholar]
- Pollard PJ, Brière JJ, Alam NA, Barwell J, Barclay E, Wortham NC, Hunt T, Mitchell M, Olpin S, Moat SJ, et al. Accumulation of Krebs cycle intermediates and over-expression of HIF1α in tumours which result from germline FH and SDH mutations. Hum Mol Genet. 2005;14:2231–2239. doi: 10.1093/hmg/ddi227. [DOI] [PubMed] [Google Scholar]
- Schmidt TJ, Ak M, Mrowietz U. Reactivity of dimethyl fumarate and methylhydrogen fumarate towards glutathione and N-acetyl-l-cysteine—Preparation of S-substituted thiosuccinic acid esters. Bioorg Med Chem. 2007;15:333–342. doi: 10.1016/j.bmc.2006.09.053. [DOI] [PubMed] [Google Scholar]
- Semenza Gregg L. Hypoxia-Inducible Factors in Physiology and Medicine. Cell. 2012;148:399–408. doi: 10.1016/j.cell.2012.01.021. [DOI] [PMC free article] [PubMed] [Google Scholar]
- Seo BB, Kitajima-Ihara T, Chan EKL, Scheffler IE, Matsuno-Yagi A, Yagi T. Molecular remedy of complex I defects: Rotenone-insensitive internal NADH-quinone oxidoreductase of Saccharomyces cerevisiae mitochondria restores the NADH oxidase activity of complex I-deficient mammalian cells. Proc Natl Acad Sci USA. 1998;95:9167–9171. doi: 10.1073/pnas.95.16.9167. [DOI] [PMC free article] [PubMed] [Google Scholar]
- Sharma LK, Fang H, Liu J, Vartak R, Deng J, Bai Y. Mitochondrial respiratory complex I dysfunction promotes tumorigenesis through ROS alteration and AKT activation. Hum Mol Genet. 2011;20:4605–4616. doi: 10.1093/hmg/ddr395. [DOI] [PMC free article] [PubMed] [Google Scholar]
- Smith RCH, Murphy Michael P. Mitochondria-Targeted Small Molecule Therapeutics and Probes. Antioxid Redox Signal. 2011;15 doi: 10.1089/ars.2011.3969. [DOI] [PubMed] [Google Scholar]
- Sudarshan S, Shanmugasundaram K, Naylor SL, Lin S, Livi CB, O’Neill CF, Parekh DJ, Yeh IT, Sun LZ, Block K. Reduced Expression of Fumarate Hydratase in Clear Cell Renal Cancer Mediates HIF-2α Accumulation and Promotes Migration and Invasion. PLoS ONE. 2011;6:e21037. doi: 10.1371/journal.pone.0021037. [DOI] [PMC free article] [PubMed] [Google Scholar]
- Sudarshan S, Sourbier C, Kong HS, Block K, Romero VAV, Yang Y, Galindo C, Mollapour M, Scroggins B, Goode N, et al. Fumarate Hydratase Deficiency in Renal Cancer Induces Glycolytic Addiction and Hypoxia-Inducible Transcription Factor 1α Stabilization by Glucose-Dependent Generation of Reactive Oxygen Species. Mol Cell Biol. 2009;29:4080–4090. doi: 10.1128/MCB.00483-09. [DOI] [PMC free article] [PubMed] [Google Scholar]
- Tomlinson I, Alam NA, Barclay E, Jaeger EE, Kelsell D, Leigh I, Gorman P, Lamlum H, Rahman S, Roylance RR, et al. Germline mutations in FH predispose to dominantly inherited uterine fibroids, skin leiomyomata and papillary renal cell cancer. Nat Genet. 2002;30:406–410. doi: 10.1038/ng849. [DOI] [PubMed] [Google Scholar]
- Tong WH, Sourbier C, Kovtunovych G, Jeong Suh Y, Vira M, Ghosh M, Romero Vladimir V, Sougrat R, Vaulont S, Viollet B, et al. The Glycolytic Shift in Fumarate-Hydratase-Deficient Kidney Cancer Lowers AMPK Levels, Increases Anabolic Propensities and Lowers Cellular Iron Levels. Cancer Cell. 2011;20:315–327. doi: 10.1016/j.ccr.2011.07.018. [DOI] [PMC free article] [PubMed] [Google Scholar]
- Warburg O. On the Origin of Cancer Cells. Science. 1956;24:309–314. doi: 10.1126/science.123.3191.309. [DOI] [PubMed] [Google Scholar]
- Weinberg F, Hamanaka R, Wheaton WW, Weinberg S, Joseph J, Lopez M, Kalyanaraman B, Mutlu GM, Budinger GRS, Chandel NS. Mitochondrial metabolism and ROS generation are essential for Kras-mediated tumorigenicity. Proc Natl Acad Sci USA. 2010;107:8788–8793. doi: 10.1073/pnas.1003428107. [DOI] [PMC free article] [PubMed] [Google Scholar]
- Xiao M, Yang H, Xu W, Ma S, Lin H, Zhu H, Liu L, Liu Y, Yang C, Xu Y, et al. Inhibition of α-KG-dependent histone and DNA demethylases by fumarate and succinate that are accumulated in mutations of FH and SDH tumor suppressors. Genes Dev. 2012;26:1326–1338. doi: 10.1101/gad.191056.112. [DOI] [PMC free article] [PubMed] [Google Scholar]
- Yang Y, Valera VA, Padilla-Nash HM, Sourbier C, Vocke CD, Vira MA, Abu-Asab MS, Bratslavsky G, Tsokos M, Merino MJ, et al. UOK 262 cell line, fumarate hydratase deficient (FH−/FH−) hereditary leiomyomatosis renal cell carcinoma: in vitro and in vivo model of an aberrant energy metabolic pathway in human cancer. Cancer Genet Cytogenet. 2010;196:45–55. doi: 10.1016/j.cancergencyto.2009.08.018. [DOI] [PMC free article] [PubMed] [Google Scholar]
Associated Data
This section collects any data citations, data availability statements, or supplementary materials included in this article.