

Abstract
Nanomaterials are diverse in size, shape and charge and these differences likely alter their physicochemical properties in biological systems. We have investigated how these properties alter the initial and long-term dynamics of endocytosis, cell viability, cell division, exocytosis, and interaction with a collagen extracellular matrix using silica-based fluorescent nanoparticles and the murine pre-osteoblast cell line, MC3T3-E1. Three surface modified nanoparticles were analyzed: positively charged (PTMA), negatively charged (OH), and neutrally charged polyethylene glycol (PEG). Positively charged PTMA-modified nanoparticles demonstrated the most rapid uptake, within 2 hours, while PEG modified and negatively charged OH nanoparticles demonstrated slower uptake. Cell viability was >80% irrespective of nanoparticle surface charge suggesting a general lack of toxicity. Long-term monitoring of fluorescent intensity revealed that nanoparticles were passed to daughter cells during mitotic cell division with a corresponding decrease in fluorescent intensity. These data suggest that irrespective of surface charge silica nanoparticles have the potential to internalize into osteoblasts, albeit with different kinetics. Furthermore, long lived nanoparticles have the potential to be transferred to daughter cells during mitosis and can be maintained for weeks intracellularly or within a collagen matrix without toxicity and limited exocytosis.
Keywords: Fluorescence, Silica-based nanoparticles, Endocytosis, Extracellular matrix, Cell division, Osteoblast
INTRODUCTION
Fluorescent nanomaterials have been widely used in biomedical applications, including bioimaging, immunomagnetic cell separation, specific cell targeting, and gene delivery.(1-3) The fluorescent properties have proven useful to detect or monitor the localization of nanomaterials in cells and organs. Among fluorescent nanomaterials gold and quantum dots can be “tuned” to emit specific color spectra based on nanoparticle size. Although silica nanoparticles do not possess tunable fluorescence, they can be endowed with fluorescent properties through incorporation of dyes or inorganic phosphors. Furthermore, silica nanoparticles have a number of advantages over other nanomaterials including; FDA-approval for use in humans, control of size, a relatively simply synthetic process, and the potential for added functionalities as a consequence of surface or core modifications.
Many studies have reported the preparation of silica nanoparticles containing fluorescent dyes through aminopropyltrialcoxysilane (APS) coupling,(4-6) direct derivatization,(7) and direct incorporation.(8) Core-shell structured nanoparticles have been studied extensively due to their apparent biocompatibility relative to more toxic materials such as CdSe and CdTe often used with quantum dots.(9-11) A significant advantage of fluorescent silica nanoparticles for biomedical applications is the potential for long-term or real-time monitoring without cell damage and photo-bleaching. Examples of long-term monitoring using nanomaterials include the use of 100 nm nanodiamonds where fluorescent imaging and tracking of cell division and differentiation in cancer and stem cells was carried out for 10 days.(12) Furthermore, Wiesner’s group observed fluorescent silica nanoparticles (C-dots) in the liver for 60 days following a single intravenous injection.(13) However, little is known regarding the effect of surface modifications on the rate of endocytosis, transmission during cell division, and interaction(s) with extracellular matrix.
In this study we utilized the murine preosteoblast cell line MC3T3-E1(14) which represents a physiologically relevant model of osteoblast matrix formation and mineralization. MC3T3-E1 cells exhibit cell cycle exit, synthesis of a collagen extracellular matrix and differentiation into hydroxyapatite depositing (mineralizing) osteoblasts similar to primary bone marrow stromal cells.(15) The long lived structured properties of bone make it a unique tissue and excellent model to define the long-term effects of nanoparticles on cell function. We utilized 50 nm-sized fluorescent silica nanoparticles to study the long-term effects of surface charge modifications and magnetic metal cores on cell endocytosis, viability, proliferation, transmissibility during cell division, and incorporation into collagen matrix deposition.
EXPERIMENTAL
Allyl iodide, rhodamine B, cesium carbonate, trimethoxysilane, and platinum on activated charcoal (Pt/C) were purchased from Sigma-Aldrich (St. Louis MO.), and tetraethyl orthosilicate, TEOS was purchased from Tokyo Chemical Industry Co. LTD, (Tokyo Japan). N-trimethoxysilylpropryl-N,N,N-trimethyl-ammonium chloride, (MeO)3Si-PTMA, and 2- [(methoxy-polyethyleneoxy)propyl]-trimethoxysilane, (MeO)3Si-PEG, were purchased from Gelest (Morrisville, PA). They were used without further purifications. N,N-dimethylformamide (DMF) and methanol was dried for the removal of water. The silica gel used for column chromatography was purchased from Merck (Whitehouse Station, NJ). The synthesis of fluorescent dye nanoparticles generally followed our previous work.(7) The synthetic scheme including derivatization and incorporation is shown in Scheme 1. The size and shape of silica nanoparticles were characterized by transmission electron microscope, TEM (H-7600, Hitachi, Tokyo, Japan) and field-emission scanning electron microscope, FE-SEM (S-4300, Hitachi). The absorption and emission spectra of fluorescent silica nanoparticles were measured by UV-Visible spectrophotometer (S-3100, Sinco, Seoul Korea) and Cary Eclipse Fluorescence spectrophotometer (Varian Assoc., Palo Alto, USA). The surface charge of nanoparticles was measured by Electrophoretic Light Scattering Spectrophotometer (ELS-8000, OTSUKA Electronics Co. Ltd., Japan). Inductively coupled plasma-atomic emission spectrometer, ICPAES (Optima-4300 DV, PerkinElmer, Waltham, MA.), was used to analyze the Si content.
Scheme 1.

(a) Derivatization of rhodamine B via allylation and hydrosilylation and synthesis of dye-incorporated red-fluorescent silica-based nanoparticles, (b) SiO2(RhB)-OH and (c) MNP@SiO2(RhB)-OH
Synthesis of (trimethoxysilylpropyl)rhodamine B
The general synthesis has been described previously.(7) Briefly, 0.50 g (1.04 mmol) of rhodamine B, 0.54 g (3.12 mmol) of allyl iodide, and 1.02 g (3.12 mmol) of cesium carbonate were dissolved in dried DMF, and was stirred at 60 °C for a day. The mixture was extracted with methylene chloride and water 3 times. The organic layer was concentrated by rotary evaporator. The residual DMF was removed by vacuum distillation. Finally, 0.51 g (94.6 %) of dark and reddish powder was taken by separating column chromatography with methylene chloride and methanol. 50 mg (0.096 mmol) of the obtained allylrhodamine B, 25 mg (0.192 mmol) of trimethoxysilane, and catalytic amount of Pt/C was dissolved in freshly dried methanol under N2. After reflux for 20 hours, the catalyst was removed by Celite filtration in a glove box. Solvent and excess trimethoxysilane were removed in a vacuum at 60 °C. 60.8 mg (98.7%) of dark-reddish oil was obtained.
Synthesis of 50 nm-sized fluorescent silica-based nanoparticles
A) SiO2(RhB)-OH
60 mg of (trimethoxysilylpropyl)rhodamine B and 2 ml of TEOS was dissolved in 118 ml of ethanol followed by mixing with 2.5 ml of ammonia and 2.5 ml of water at 400 rpm. After 15 hours fluorescent silica nanoparticles were collected by centrifugation at 15,000 rpm for 30 min and the supernatant was removed. The precipitate was dispersed in ethanol. These washing and re-dispersion steps were repeated until the supernatant had no residual fluorescence. Finally, nanoparticles were dispersed in ethanol for the surfacemodification step or in water and sterile phosphate buffered saline (PBS) for cell culture.
B) MNP@SiO2(RhB)-OH
Core-shell nanoparticles, with cobalt-ferrite magnetic cores were prepared as previously described.(11) The synthetic dye, (trimethoxysilylpropyl) rhodamine B, was used for the incorporation of fluorescent dyes into the silica shell.
Surface modification of fluorescent silica-based nanoparticles
4.05 g of (MeO)3Si-PTMA was added to 100 mg of fluorescent silica nanoparticles dispersed in 50 ml of ethanol, and 5 vol. % of ammonia (28%) was added. After stirring for 20 hours at room temperature the surface-modified nanoparticles were collected by repeated (3X) centrifugation and re-dispersion with water. Finally, 80 mg of modified nanoparticles was dispersed in water or sterile PBS. PEG-modified nanoparticles were prepared by a similar method.(7)
Cell Culture
All cells were cultured at 37°C in 5% CO2. MC3T3-E1 cells were cultured in alpha-MEM (Irvine Scientific, Santa Ana CA) supplemented with 50 U/ml penicillin, 50 mg/ml streptomycin (P/S) (Invitrogen Corp., Carlsbad, CA) and 10% FBS (Atlanta Biologicals, Atlanta GA) as described previously.(16) A549 cells (purchased from ATCC) were cultured in DMEM (Mediatech Inc., Herndon, VA) supplemented with 4% FBS, 50 U/ml penicillin, 50 mg/ml streptomycin, and 2 mM L-glutamine (Invitrogen Corp.).
Measurement of cell viability and proliferation
Cell viability and proliferation were measured for all cell types using an XTT assay (MTS (3- (4,5-dimethylthiazol-2-yl)-5-(3-carboxylmethoxyphenyl)-2-(4-sulfonyl)-2H-tetrazolium, inner salt) according to the manufacturer’s protocol (Promega, Madison, WI). Cells were plated at a concentration of 5×10³ cells / 100 μl per well in 96 well plates. Twenty-four hours after plating nanoparticles were added as indicated. Absorbance was measured 1 hour after addition of XTT assay reagent on a BioRad Lumimark plate reader (BioRad Laboratories, Hercules CA).
Effects of mitosis
To determine the fate of nanoparticles following cell division we designed the experiment in Scheme 2. Cells containing nanoparticles were recovered (lifted) by treatment with 1 ml of trypsin (Mediatech Inc.). The recovered cells in the medium were divided in half (50% dilution) and re-plated on 2 separate 10cm plates. Each plate was incubated until cells reached confluence. For the long-term monitoring experiment, one plate was kept for one month after the first subculture and the medium was changed every other day. A parallel plate was subcultured (50% dilution) at intervals of every 3-4 days. Cells were monitored by fluorescent microscopy every 1- 2 days after subculture.
Scheme 2.

The effect of cell division was determined in MC3T3-E1 cells using a single treatment of SiO2(RhB)-PTMA (100 μg/ml) for 24 hours. In pathway I, after the 1st subculture, the loaded cells were incubated for 31 days, and in pathway II, the loaded cells were subcultured several more times. The cells in pathway II were diluted by 50% at each subculture.
Nanoparticle deposition into collagen matrix
Rat Tail collagen (Boehringer Mannheim, Germany) was reconstituted at 2 mg/ml in 0.2% acetic acid. A collagen film was coated onto a 96 well plate and allowed to air dry. Wells were washed with PBS and incubated with 100 μg/ml of the three surface modified silica nanoparticles (SiO2(RhB)-OH,-PTMA and -PEG) for 2 hours followed by washing for 15 minutes with PBS and vigorous agitation. This was repeated 3 times and the association of nanoparticles with collagen fibers was visualized by fluorescence microscopy.
Osteoblast differentiation and mineralization
MC3T3-E1 cells were plated in 12 well plates for 72 hours and 3, 30, and 60 μg/ml of PTMAmodified nanoparticles was added. Following 24 hours of incubation the plate was washed and differentiation/mineralizing medium (growth medium supplemented with 10 mM betaglycerophosphate and 50 μg/ml ascorbic acid) was added as described previously.(16) The differentiation medium was changed every other day. The repeated nanoparticle-treatment groups were treated every other day with nanoparticles and samples were monitored for up to 21 days by fluorescent and optical microscopy.
Preparation of ICP-AES samples
MC3T3 cells were cultured in differentiation medium for 13, 21, and 34 days. Cells were harvested in PBS, and centrifuged at 2,000 rpm for 2 minutes. The supernatant was removed and cells lysed in 400 μl of NP-40 lysis buffer (10 mM Tris-HCl (pH 7.4), 10 mM NaCl, 3 mM MgCl2, and 0.5% NP 40). After 15 minutes on ice the solution was centrifuged (15,000 rpm for 10 min.). Finally, the supernatant was collected and the concentration of Si in the cellular extract was measured by ICP-AES.
RESULTS AND DISCUSSION
Synthesis of fluorescent silica nanoparticle
The nanoparticles, SiO2(RhB)-OH and MNP@SiO2(RhB)-OH, used for this biological study were synthesized by incorporating rhodamine B derivatives into the silica matrix. The characterization of the derivatized dye has been reported previously.(7) After incorporating the dyes into silica or core-shell structured nanoparticles, the absorption and emission spectra in the UV-Visible range could be detected and the spectral shape matched that of the original rhodamine B. Independent of the solvent and the structure of the nanoparticles the maximum wavelengths of their absorption, emission, and spectral shapes were essentially identical.
The absorption wavelength at maximum was ca. 560 nm and the emission wavelength at maximum was ca. 590 nm (Figure 1). The background lines in absorption spectra were due to the scattering of UV-Vis light by the nanoparticles, and the extent of scattering was not directly related to their size. The MNP@SiO2(RhB)-OH nanoparticles exhibited less fluorescent intensity relative to the silica nanoparticles likely due to the magnetic core, which has both a black color and has less silica which results in less dye incorporation relative to the SiO2(RhB)-OH nanoparticles. The MNP@SiO2(RhB)-OH and SiO2(RhB)-OH nanoparticles are nearly identical in size at ~50 nm, confirmed by TEM and FE-SEM.
Figure 1.

UV-Visible absorption (solid line) and PL spectra (dot line), and TEM images of fluorescent silica-based nanoparticles; (a) and (c) SiO2(RhB)-OH, and (b) and (d) MNP@SiO2(RhB)-OH
The rate of uptake initially depends on the surface properties of nanoparticles
The surface of silica nanoparticles can be successfully modified with various ligands by treatment with the appropriate silicon compounds, (MeO)3Si-PTMA and (MeO)3Si-PEG, as reported previously.(7, 11) In the absence of surface modifications, the silica nanoparticle has hydroxyl groups on the surface and shows a negative surface charge due to the weak acidic character of the Si-OH functional group (zeta-potential −29.0 mV). Addition of PTMA induced a strong positive charge (zeta-potential +27.0 mV) while addition of PEG resulted in a near neutral charge (zeta-potential +2.4 mV). The PTMA and PEG modifications did not alter the emission characteristics and all the nanoparticles remained stably dispersed in solution for more than six month.
We examined the effects of surface modification on endocytosis as a function of surface charge by treating MC3T3-E1 cell with 10 μg/ml each of SiO2(RhB)-OH, -PEG, and -PTMA nanoparticles. Fluorescent microscopy was used to monitor uptake and results determined that the unmodified negatively charged SiO2(RhB)-OH and the near neutral SiO2(RhB)-PEG internalized at approximately the same rate while the positively charged SiO2(RhB)-PTMA internalized more rapidly (Figure 2). The cell membrane is composed of lipids with a partially negative charge and the charge interaction between the PTMA and the cell membrane likely enhanced the uptake rate of nanoparticles without respect to their shape and sizes.(3) However, in the persistent presence of nanoparticles all formulations achieved maximal saturating uptake by 24 hours, based on fluorescent intensity. The results suggest that while surface charge does significantly influences the kinetics of silica nanoparticle uptake, ultimately positive, negative and neutral surface charges have the capacity to be internalized across the cell membrane. Whether different mechanical processes are involved in sequestration and transport in the context of different surface charge remains to be determined.
Figure 2.

Relative uptake rates of silica nanoparticles having different surfaces. SiO2(RhB)-OH, SiO2(RhB)-PEG, and SiO2(RhB)-PTMA (10 μg/ml) were added to MC3T3-E1 cells and photographed at the indicated times. Scale bar = 50μm
The surface properties of nanoparticles do not influence cell viability
To determine if surface modifications and/or magnetic metal cores alter the cellular compatibility of the particles we performed cell viability assays using the XTT assay. Core-shell MNP@SiO2(RhB)-OH, MNP@SiO2(RhB)-PEG, and MNP@SiO2(RhB)-PTMA nanoparticles were added to MC3T3-E1 cultures at various concentrations (0, 10, 50, 100 μg/ml). Cell viability was measured after 1, 2, and 3 days. The data revealed no substantial change in cell viability in all treatment groups and remained at least 80% of control or greater (Figure 3) even at relatively high nanoparticle concentrations (100 μg/ml). The data are in agreement with our previous studies using silica based particles(7) and suggest that the silica shell of the core-shell structure likely masks any potential toxicity of the cobalt ion core. The data demonstrate that neither surface charge nor magnetic core influences the toxicological properties of silica nanoparticles in osteoblasts. This is important as PEG is a common surface modification used to mask strong surface charges, reduce immunogenicity and increase in vivo half life and therefore has the potential to be used for cell targeting in biomedical applications.
Figure 3.

Cell viability results of silica-based fluorescent magnetic core nanoparticles in MC3T3-E1 cell line by XTT assay; 50 nm-sized red-fluorescent nanoparticles (MNP@SiO2(RhB)-OH, -PEG, and -PTMA) were treated with various treatment periods (in days), doses (10 μg/ml, 50 μg/ml, and 100 μg/ml), and surface charges as indicated.
Transfer of nanoparticles to daughter cells during mitosis
To determine if nanoparticles were passed from parent to daughter cell during cell division MC3T3-E1 cells were loaded with SiO2(RhB)-PTMA nanoparticles, lifted with trypsin, and replated at reduced density. In order to determine the effects of cell division on long term stability and retention of the particles we performed the subculture experiment detailed in Scheme 2. The cells from both pathways were monitored with fluorescent and optical microscopy as shown in Figure 4 (Pathway I) and Figure 5 (Pathway II). Following subculture the cells were allowed to go through multiple rounds of division. Fluorescence was detected in most cells after the first subculture suggesting that particles are passed to the daughter cells during mitosis. Furthermore, we predicted that if the particles are passed to daughter cells we would observe a progressive decrease in fluorescence intensity. Our data do indeed ratify such an outcome (Figure 5h and 5i).
Figure 4.

Fluorescent and optical images of MC3T3-E1 cells incubated with a single treatment of 50 nm-sized red-fluorescent SiO2(RhB)-PTMA nanoparticles (pathway I). Images were recorded for up to 31 days as indicated. The bright-field optical image (i) was taken from the same area as the fluorescent image (h). Scale bar = 50μm
Figure 5.

Fluorescent and optical images of MC3T3-E1 cells incubated with 50 nm-sized red-fluorescent SiO2(RhB)-PTMA nanoparticles (pathway II). The nanoparticle loaded cells were subcultured and re-plated with cell dilution (based on initial plating) as indicated. Images were recorded for up to 31 days as indicated. The bright-field optical image (i) was taken from the same area as fluorescent image (h). Scale bar = 50μm
Nanoparticles are not degraded over time; measurement of intracellular silica
In order to verify that decreased intensity of nanoparticle fluorescence is not simply the result of decomposition of the nanoparticles leading to loss of the dye and hence fluorescence due to cellular elimination or degradation over time, we quantified the concentration of silicon in the cells by ICP-AES. The amount of silicon in the untreated samples at day 13 day was 1.29 ppm and at day 21 1.34 ppm. Consequently, there was no detectable change over incubation time, and the concentration was maintained at approximately 1.3 ppm. By contrast, the nanoparticle-treated samples produced silicon levels of 1.75 ppm at day 13 and declined only marginally to 1.68 ppm by day 34. These data suggest that nanoparticle degradation is likely a major contributor to the observed reduction of fluorescent intensity during cell subdivision. These results are in agreement with the fact that the decomposition of silica is known occur more rapidly under basic conditions but occurs very slowly in acidic conditions (17) as would be expected in the buffered or acidic environment of intracellular organelles.
Effect of long-term culture on exocytosis
We noted that the fluorescence of the cells monitored for 31 days (Pathway I) decreased with increasing incubation time (Figure 4), although not to the extent of Pathway II (Figure 5). We postulated that the decreased intensity could be the result of a number of factors including: cell death, the degradation or digestion of silica nanoparticles by a cell function such as enzyme or pH, or exocytosis. However, the cells were healthy and the high density permitted only limited cell division and therefore dilution by cell division was unlikely to be the main contributor (See Figure 4i). Our cell viability studies (Figure 3), in addition to the lack of any noticeable cell death, suggested that apoptosis was unlikely to be a factor. As described above, we do not find a substantial increase in silica suggesting the particles are not degraded. Therefore, the most likely cause of the decreased fluorescent intensity over time is due to exocytosis. The rate of exocytosis for other particles has been reported to be approximately 25 ~ 35 minutes (half-life) which is much faster than cell division (~ 24 hours).(12, 18) The slow rate of exocytosis of our particles may therefore represent a unique property.
Nanoparticle - extracellular matrix interaction
Upon initiation of differentiation MC3T3-E1 cells will multilayer and over the course of 21 days will form a matrix consisting mainly of Type-1 collagen and ultimately produce a mineralized matrix.(19) These properties make bone a unique tissue in which elements such as lead may be stored for years or even decades. We utilized this relatively complex physiological model to investigate the potential long-term effects of our nanoparticles on cell retention including exocytosis and incorporation into an extracellular matrix. MC3T3-E1 cells were treated once with SiO2(RhB)-PTMA or MNP@SiO2(RhB)-PTMA at concentrations of 3, 30, and 60 μg/ml. Differentiation medium was added after 3 days of culturing. As shown in Figure 6a, the fluorescent intensity was dependent on the concentration of added nanoparticles. Interestingly, compared with the 21 days sample in pathway I (Figure 4g) the fluorescent intensity was greater when the extracellular matrix was induced, even though the concentration of nanoparticles added was less, suggesting the particles are exocytosed and trapped in the collagen matrix.
Figure 6.

(a) MC3T3-E1 cells were exposed to a single treatment of SiO2(RhB)-PTMA nanoparticles (0, 3, 30, 60 μg/ml) followed by differentiation medium or control (non-diff) after 3 days of culturing. (b) MC3T3-E1 cells were exposed to repeated treatments with SiO2(RhB)-PTMA nanoparticles (0, 3, 30, 60 μg/ml). Cells were photographed after 21 days. Scale bar = 50μm.
When nanoparticles were treated with nanoparticles every other day during the differentiation experiments, the cells were still healthy and fluorescent intensity was much brighter compared to single-treated samples in Figure 6 (compare a and b). We hypothesized that the difference of fluorescent intensity resulted from either the collagen matrix blocking the diffusion of nanoparticles eliminated by exocytosis or the particles binding to the collagen itself, or both (See Scheme 3). Since the cells in Figure 6a only received a single treatment of particles and the matrix was formed after addition of particles, the increase in fluorescence (compare panel 4 with panel 5) is likely due to the inability of exocytosed particles to be removed with medium changes (scheme 3).
Scheme 3.

During osteoblast differentiation the cells multilayer and form an extensive a collagen matrix. The increased fluorescent intensity of the differentiated cells relative to nondifferentiated of the nanoparticles can be explained by two mechanisms. Nanoparticles can 1) become bound directly to the collagen matrix or 2) the nanoparticles that are exocytosed are then trapped in the cells or matrix whereas the nanoparticles from non-differentiated cells are easily removed by washing.
The increased intensity of the cell layer in response to multiple treatments with nanoparticles could be the result of increased endocytosis or binding of the particles to collagen. To determine if the particles bind to collagen we utilized collagen coated plates. Addition of OH, PEG and PTMA modified nanoparticles (100 μg/mL) for two hours resulted in strong fluorescence whereas negligible fluorescence was detected on control plates (Figure 7a-d). Additionally, all particles exhibited substantial binding regardless of surface property. Although this series of experiments does not rule out the contribution of increased endocytosis during differentiation, the results do support the idea that our nanoparticles can stably exist in the extracellular matrix for extended periods of time with limited toxicity (Scheme 3)
Figure 7.
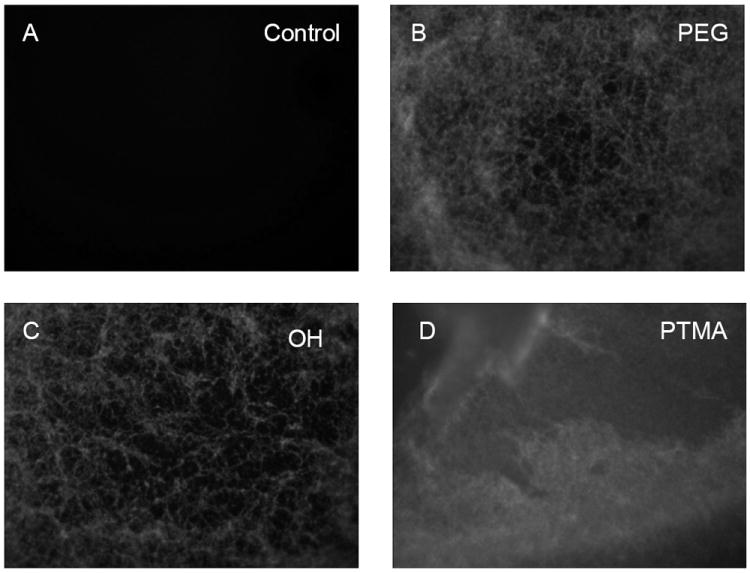
Fluorescent images of collagen fiber matrix untreated (a) or treated with nanoparticles (b-d) (100μg/mL) as indicated for 2 hours and followed with extensive washing. The matrix was photographed at 200X.
CONCLUSIONS
We have synthesized rhodamine B derivatives with a high yield of approximately 95% incorporation into the silica shell. The synthetic dyes could be applied in both silica and coreshell structured nanoparticles and their absorption and emission was the same, independent of their structure or polar solvents such as alcohol and water. The size and shape of the silica-based nanoparticles was 50 nm and spherical as characterized by TEM and FE-SEM.
Cell viability was demonstrated to be greater than 80% even in the presence of 100 μg/ml of the magnetic core nanoparticle and no change was detected visually in cultures of more than 21 days. Surface property altered the initial rate of uptake with the positively charged PTMA nanoparticle showing the fastest uptake rate among OH-, PEG-, and PTMA-modified nanoparticles. However, there was no observable difference after 24 hours of incubation. The results suggest that at least in culture the surface modification and magnetic core are compatible with cellular uptake and long-term cell viability, properties conducive to future in vivo studies.
We determined that the fluorescence from the nanoparticles was reduced over time in response to repeated subculture in part due to a dilution effect of being passed to daughter cells during mitosis. In addition, we identified that the reduced fluorescence is also at least minimally the result of a relative slow exocytosis. We further determined that the particles can bind to and likely incorporate into a collagen matrix, regardless of surface charge or magnetic core and without apparent toxicity. Taken together the results suggest that our particles are non-toxic over long term cell exposure and the strong incorporation into both osteoblasts and extracellular matrix may represent a possible therapeutic opportunity to intervene in various diseases of bone metabolism. The results also shed light on the possible long-term storage of nanoparticles in tissues such as bone even after a single exposure. With an almost unlimited variety of nanoparticles being constructed at present, this study highlights the need to thoroughly address the potential positive and negative consequences of long-term tissue storage on their therapeutic usefulness.
Acknowledgments
This research was supported by Nano R&D Program through the National Research Foundation of Korea (NRF) funded by the Ministry of Education, Science and Technology (2009-0082736). S.-W. Ha is grateful for the award of a BK21 fellowship. GRB Jr., MNW and CEC are supported in part by a grant from NIH/NIAMS (AR056090).
References
- 1.Niemeyer CM, Mirkin CA. Nanobiotechnology: Concepts, Applications and Perspectives. Wiley-VCH; Weinheim: 2004. [Google Scholar]
- 2.Tan W, Wang K, He X, Zhao XJ, Drake T, Wang L, Bagwe RP. Med Res Rev. 2004;24(5):621–638. doi: 10.1002/med.20003. [DOI] [PubMed] [Google Scholar]
- 3.Xu ZP, Zeng QH, Lu GQ, Yu AB. Chem Eng Sci. 2006;61(3):1027–1040. [Google Scholar]
- 4.Blaaderen Av, Vrij A. Langmuir. 1992;8(12):2921–2931. [Google Scholar]
- 5.Ow H, Larson DR, Srivastava M, Baird BA, Webb WW, Wiesner U. Nano Lett. 2005;5(1):113–117. doi: 10.1021/nl0482478. [DOI] [PubMed] [Google Scholar]
- 6.Wang L, Tan W. Nano Lett. 2006;6(1):84–88. doi: 10.1021/nl052105b. [DOI] [PMC free article] [PubMed] [Google Scholar]
- 7.Ha S-W, Camalier CE, George R, Beck J, Lee J-K. Chem Commun. 2009;(20):2881–2883. doi: 10.1039/b902195g. [DOI] [PMC free article] [PubMed] [Google Scholar]
- 8.Santra S, Bagwe RP, Dutta D, Stanley JT, Walter GA, Tan W, Moudgil BM, Mericle RA. Adv Mater. 2005;17(18):2165–2169. [Google Scholar]
- 9.Salgueiriño-Maceira V, Correa-Duarte MA. Adv Mater. 2007;19(23):4131–4144. [Google Scholar]
- 10.Piao Y, Burns A, Kim J, Wiesner U, Hyeon T. Adv Funct Mater. 2008;18(23):3745–3758. [Google Scholar]
- 11.Yoon T-J, Kim JS, Kim BG, Yu KN, Cho M-H, Lee J-K. Angew Chem Int Ed. 2005;44(7):1068–1071. doi: 10.1002/anie.200461910. [DOI] [PubMed] [Google Scholar]
- 12.Liu K-K, Wang C-C, Cheng C-L, Chao J-I. Biomaterials. 2009;30(26):4249–4259. doi: 10.1016/j.biomaterials.2009.04.056. [DOI] [PubMed] [Google Scholar]
- 13.Choi J, Burns AA, Williams RM, Zhou Z, Flesken-Nikitin A, Zipfel WR, Wiesner U, Nikitin AY. J Biomed Opt. 2007;12(6):0640071–06400711. doi: 10.1117/1.2823149. [DOI] [PubMed] [Google Scholar]
- 14.Sudo H, Kodama H-A, Amagai Y, Yamamoto S, Kasai S. J Cell Biol. 1983;96(1):191–198. doi: 10.1083/jcb.96.1.191. [DOI] [PMC free article] [PubMed] [Google Scholar]
- 15.Quarles LD, Yohay DA, Lever LW, Caton R, Wenstrup RJ. J Bone Miner Res. 1992;7(6):683–692. doi: 10.1002/jbmr.5650070613. [DOI] [PubMed] [Google Scholar]
- 16.Beck GR, Sullivan EC, Moran E, Zerler B. J Cell Biochem. 1998;68(2):269–280. doi: 10.1002/(sici)1097-4644(19980201)68:2<269::aid-jcb13>3.0.co;2-a. [DOI] [PubMed] [Google Scholar]
- 17.Rimer JD, Trofymluk O, Navrotsky A, Lobo RF, Vlachos DG. Chem Mater. 2007;19(17):4189–4197. [Google Scholar]
- 18.Chithrani BD, Chan WCW. Nano Lett. 2007;7(6):1542–1550. doi: 10.1021/nl070363y. [DOI] [PubMed] [Google Scholar]
- 19.Beck GR. J Cell Biochem. 2003;90(2):234–243. doi: 10.1002/jcb.10622. [DOI] [PubMed] [Google Scholar]