Abstract
Objective
To determine the clinical display thresholds of an ultrasound tomography (UST) prototype relative to magnetic resonance (MR) for comparable visualization of breast anatomy and tumor rendering.
Materials and Methods
The study was compliant with HIPAA, approved by the IRB, and performed after obtaining informed consent. Thirty-six women were imaged with MR and our UST prototype. The UST scan generated reflection, sound speed and attenuation images. The reflection images were fused with the components of sound speed and attenuation images that achieved thresholds to represent parenchyma and/or solid masses using an image arithmetic process. Qualitative and quantitative comparisons of MR and UST clinical images were used to identify anatomical similarities, and optimized thresholds for tumor shapes and volumes.
Results
Thresholding techniques generated UST images comparable to MR for visualizing fibrous stroma, parenchyma, fatty tissues, and tumors, of which 25 were cancer and 11 benign. Optimized sound speed thresholds of 1.46±0.1 km/s and 1.52±0.03 km/s were identified to best represent the extent of fibroglandular tissue and solid masses, respectively. An arithmetic combination of attenuation images using the threshold of 0.16±0.04 dB/cm further characterized benign from malignant masses. No significant difference in tumor volume was noted between benign or malignant masses by UST or MR (p>0.1) using these universal thresholds.
Conclusion
UST demonstrated the ability to image and render breast tissues in a manner comparable to MR. Universal UST threshold values appear feasible for rendering of the size and distribution of benign and malignant tissues without intravenous contrast.
INTRODUCTION
Breast magnetic resonance (MR) imaging has recently been elevated to the preferred screening choice for high-risk women, and is recognized as an important adjunctive examination to mammography and ultrasound (US) for evaluation of breast tumor size and extent [1–5]. The utility of MR in investigating breast cancer is largely due to its high sensitivity and moderate specificity for masses over 5 mm in size, including ductal carcinoma in situ (DCIS) [6–7]. By analyzing breast morphology and enhancement characteristics, MR imaging uses qualitative and quantitative data of tumor vascularity in order to better differentiate between benign and cancerous masses [8–13]. MR scanners, however, are costly to purchase, house and maintain, as well as require dedicated staff for uniform operation and interpretation [14].
These disadvantages have limited widespread use of breast MR for diagnosis and staging, as well as making screening of the general population cost prohibitive. Consequently, a modality that could cost-effectively rival MR’s overall image quality could have broad societal impact. Breast ultrasound tomography (UST) can provide operator-independent and reproducible scanning with quantitative tissue characterization capabilities [15–26]. UST can accurately portray several acoustic properties of insonified tissue including margin definition, tissue elasticity, sound speed, and attenuation [27–31] for potential improvements in clinical differentiation of benign and malignant breast masses.
As previously described in a preliminary study, our goal is to assess whether UST can generate images comparable to MR in a reproducible manner using universal diagnostic parameters [20]. This paper presents a larger cohort of patients using improved image fusion methods for a novel UST prototype in comparison with standard breast MR images. A specific process was defined whereby an imaging sequence could routinely produce fused images of UST reflection, sound speed, and attenuation data for rendering of normal architecture and tumor volumes comparable to MR in preparation for future multi-center clinical trials and a commercial product.
MATERIALS AND METHODS
Patient Selection & MR Dataset
All UST imaging was performed under an Institutional Review Board-approved protocol, in compliance with the Health Insurance Portability and Accountability Act (HIPAA), with informed consent obtained from all patients. Patients were recruited based on prior US and/or mammogram findings of focal mass effect. Each patient was scanned with our clinical UST prototype after mammography and standard US exams, but before US-guided biopsy, as previously described [20–26]. The population selection criteria restricted our analysis to women for whom we possessed both UST reconstructions and breast MR sequences within 6 weeks of the UST exam. MR imaging was performed for standard clinical indications from available prior scans and was not the focus of this study, other than for morphological comparisons. As such, MR scanner and sequence details are beyond the scope of this study and limited overview is provided. In all patients, non-enhanced and gadolinium-enhanced MR sequences were reviewed by a board-certified radiologist with over 15 years of experience in breast imaging (PL) and a senior radiology resident.
MR scans were received from our picture archive computer system (PACS) as axially-oriented images which were then re-formatted using the public domain image analysis package, ImageJ [32], into coronal views to match the native format of the UST acquisitions. Gadolinium-enhanced, fat-saturated T1-weighted images were employed to define the volume and extent of all solid tumors. T2-weighted images were used to identify cysts. Our patient dataset represents an array of breast sizes, patient ages, breast densities, and contain both benign and cancerous lesions (Table 1). Disproportionate number of cancer patients (N= 25) was anticipated due to most breast MR scans being obtained for staging purposes.
Table 1.
Patient Characteristics
| Patient Characteristic | Women Included in Analysis (n=36) |
|---|---|
| Age (mean ± standard deviation) | 45.9 ± 11.6 |
| Diagnosis | |
| Cancer (invasive ductal carcinoma) | 25 |
| Benign (cyst, fibroadenoma, fibrosis/adenosis) | 11 |
| Breast Density | |
| Fatty tissue: <10% | 2 |
| Scattered fibroglandular tissue: 11–50% | 8 |
| Heterogenously dense fibroglandular tissue: 51–75% | 18 |
| Dense fibroglandular tissue: >75% | 8 |
UST Device and Data Acquisition
The principles and technical details of our clinical UST device have been described [20–26]. In summary, the patient lies in the prone position on the examination bed with the breast suspended through a hole in a thin, pliable sail cloth opening into a water tank. This design allows immersion of the breast, including the axillary tail, into the water bath with flexible contouring to the chest wall. During the beginning phases of clinical trials, due to limited memory storage, the UST scan was limited to the coronal levels surrounding a primary mass. Hence, some secondary masses may have gone undetected because they were out of scanning range for that particular study.
A ring transducer, operating at a current central frequency of 1.5 MHz, encircles the breast and scans from the patient’s chest wall to the nipple region by means of a motorized gantry. The 1.5 MHz frequency allows penetration across the 20 cm ring diameter, yet the compound imaging from circumferential transducers and algorithms reduces speckle and clutter for better than anticipated contrast resolution at this frequency. The transducer consists of 256 elements that sequentially emit and receive ultrasound signals. Water has a sound speed (~1.5 km/s) close to breast tissue, and serves as a coupling medium between the breast and transducer. Transmission and reflection ultrasound signals are subsequently recorded at a sampling rate of 6.25 MHz to obtain 30–115 tomographic slices of the breast (depending on the breast size) at 1 mm intervals, for a scan range of 3.0–11.5 cm on this prototype. The acquisition time of a complete scan per breast is approximately 1 minute.
Three types of UST images of the entire coronal cross-section throughout the whole breast are produced from the raw data using previously described tomographic reconstruction algorithms [21–23,26]: (i) reflection, (ii) sound speed and (iii) attenuation. Reflection images, derived from changes of acoustic impedance, provide echo-texture data and anatomical detail for the entire breast. Reflection images are valuable for defining tumor margins and architectural distortion which can be used to characterize lesions through the BI-RADS criteria [33]. Sound speed images are based on the arrival times of acoustic signals. Previous studies have shown that cancerous tumors have elevated sound speed relative to normal breast tissue [29,31], a characteristic which can aid the differentiation of fat, normal tissue and masses. Attenuation images are tomographic reconstructions based on acoustic wave amplitude changes. Higher scatter and absorption in cancers cause greater attenuation of US waves [28–30] such that attenuation data in conjunction with sound speed may provide an effective methodology for differentiating malignant from benign solid tumors. However, limited angle tomography with standard linear array transducers could not discriminate differences in breast tissue [31].
In addition, quantitative attenuation and sound speed values by UST may help differentiate tumors in a manner similar to some BI-RADS characteristics, such as posterior shadowing (or high attenuation) having a greater association with cancer. Similarly, high sound speed is a reflection of higher density (i.e. c = √K/ρ, where c=sound speed, K=bulk modulus, and ρ=density), which in turn corresponds to potentially greater stiffness and improved cancer discrimination by elastography [34]. Therefore, artifacts of standard US are potentially quantified by UST (i.e. shadowing corresponding to attenuation) since circumferential imaging eliminates standard artifacts of shadowing, refractions, etc.
Image Analysis
The three types of UST images can be combined without geometric discrepancy by means of image fusion. A macro developed for ImageJ was used to fuse reflection (Ir), attenuation (Ia) and sound speed (Is) UST images and to adjust image thresholds prior to their combination. However, before fusion of reflection, sound speed, and attenuation can be considered, the thresholds needed to be validated according to the appropriate anatomic size representation. Coronal T1 fat-saturated gadolinium-enhanced MR images were used as the gold standard by which UST images and associated pathologic correlations were done. Specifically, the size and extent of both normal structures (e.g. fibroglandular tissue) and masses were taken from qualitative appearance rather than a quantitative measurement on MR. Sound speed and attenuation thresholds on UST were thus adjusted to match the appearance of fibroglandular tissues and mass sizes on MR. Threshold were then iteratively assessed to finalize a single threshold that could be applied to all patients.
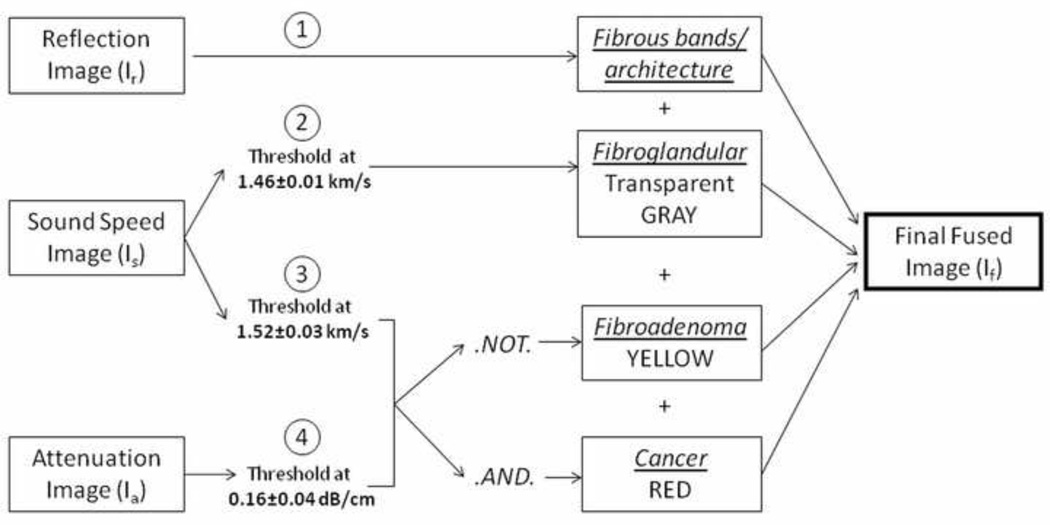
Image fusion allows for multi-parameter visualization so that multiple characteristics can be viewed as one image and breast tissue features can be evaluated more efficiently and comprehensively (Fig. 1). In addition to accentuating masses, fused images depict local and surrounding tumor effects, including parenchyma and breast architecture. Parenchymal tissue was visualized by varying the rendered range of sound speeds in the UST images and assigning these values to grayscale to match the appearance of parenchyma in the MR images. This sound speed threshold (x) was noted for each patient. Depiction of solid masses was similarly optimized using a combination of sound speed and attenuation thresholds, applying a colored value to these pixels and comparing the results with DCE-MR renderings of the same lesions at maximum enhancement. The associated sound speed and attenuation threshold for similar mass size and extent was noted for each patient (y and z respectively). A final fused image, If, was created by combining the reflection image, Ir, the thresholded sound speed image, Is, and thresholded attenuation image, Ia, as indicated by the formula,
| (1) |
where ^ denotes the logical .AND. operation, ¬ is the logical .NOT. operation, and x,y,z are the variable threshold values defined above. The final image thereby displays overall breast architecture (via Ir), parenchyma (via Is), and solid masses (via Is ^ Ia and Is ¬ Ia), simultaneously. For image fusion, sound speed images with total variation regularization [23] were used due to their increased ability to better define the sharpness of lesion edges and dampen ray artifacts.
Fig. 1.
Fusion method. First, reflection, sound speed, and attenuation images are obtained from the UST scanner. The reflection image depicts fibrous architecture and is used as the background. The sound speed image is thresholded at two separate instances, once at 1.46±0.01 to show parenchyma and 1.52±0.03 to depict a solid mass. The attenuation image, thresholded at 0.16±0.04, is then added using the logical .AND. and .NOT. operator. The circled numbers represent the steps in image fusion. The final fused image then shows a benign solid mass as yellow, or a cancer as red. Underlines represent tissue estimates.
Similar resolution of MR and UST enabled an effective comparison with this fusion process. The spatial resolution of the MR data is ~1 mm and the image slices are typically 1 mm thick. The UST images are characterized with an in-plane spatial resolution of 1 to 2 mm with a slice thickness of ~4mm. The parameters used during the comparison process were (i) the size of the primary tumor, (ii) the presence of additional suspicious lesions, (iii) the distribution of parenchymal and fibroglandular tissue. In order to compare masses rather than overall breast architecture, we relied on the observation that masses tend to have higher sound speeds relative to background tissue. A “detected mass” by UST was defined as a distinct feature appearing in one or more UST modalities that coincided in location and size with masses identified in the corresponding MR images.
Once a preliminary relationship was suggested by visual assessment, a more quantitative technique was used to verify that these UST thresholds were producing analogous images to MR. First, we reviewed available standard US and MR studies on all patients to determine the number of masses within an approximate breast volume covered by UST. Ultrasound and pathology data were used to verify and/or correct for any obvious tumor size discrepancy by MR due to its tendency to overestimate tumor size relative to pathological measurements [5]. To estimate lesion volumes, we applied the ellipsoid formula: π/6 × length × width × height to UST and MR tumor diameters. We also utilized a 3-D region-of-interest that encompassed the mass, and subsequently applied a threshold to determine mass margins and extent most similar to those seen on MR. A pixel count, using the built-in “histogram” function of ImageJ, was then used to accumulate a volume measurement.
We calculated the mean of the thresholds used in volume calculations in an attempt to determine whether a unique, universally-applicable threshold could be ascertained. Using this average threshold for sound speed and attenuation, we re-calculated the volumes of each mass to determine the variation of mean-threshold-acquired volumes to actual lesion volumes.
Statistical Analysis
Assessment was limited to observational differences and not intended to power the sample size of the study. All mean value comparisons for volume differences between UST and MR mass volumes used the two-tailed student t-test. Significance was declared at p<0.05.
RESULTS
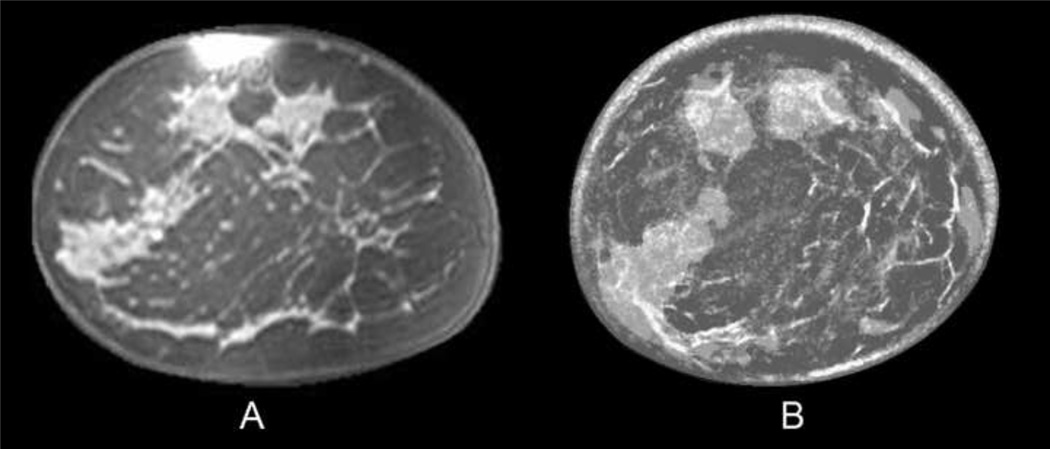
Adjusting thresholds in the fused images to match the tumor sizes noted on MR images, as shown in Eq. (1), yielded a mean value of x = 1.46 ± 0.01 km/s for delineating parenchyma, and mean values of y = 1.52 ± 0.03 km/s and z = 0.16 ± 0.04 dB/cm to render solid masses. For solid masses, cancers were clearly differentiated and displayed as red when both thresholds were met, whereas benign masses (e.g., fibroadenomas) were yellow since they only met the sound speed threshold. A visual assessment of the images led to the identification of parenchyma, fibrous stroma, masses and fatty tissues in both UST and MR images. Components of normal breast anatomy had similar distribution on UST and MR (Fig. 2) and the semi-transparent lighter gray regions represented step #2, as noted in of the image fusion process (Fig. 1).
Fig. 2.
Coronal T1, fat-saturated enhanced MR image (A) of a 45-year-old woman with scattered breast density. Fused UST image (B) shows similar anatomic distribution of fibrous bands and overlying fibroglandular tissue, similar to the MR image. The dark gray corresponds to fat, while the semi-transparent lighter gray represents denser fibroglandular tissue with underlying thin white fibrous bands.
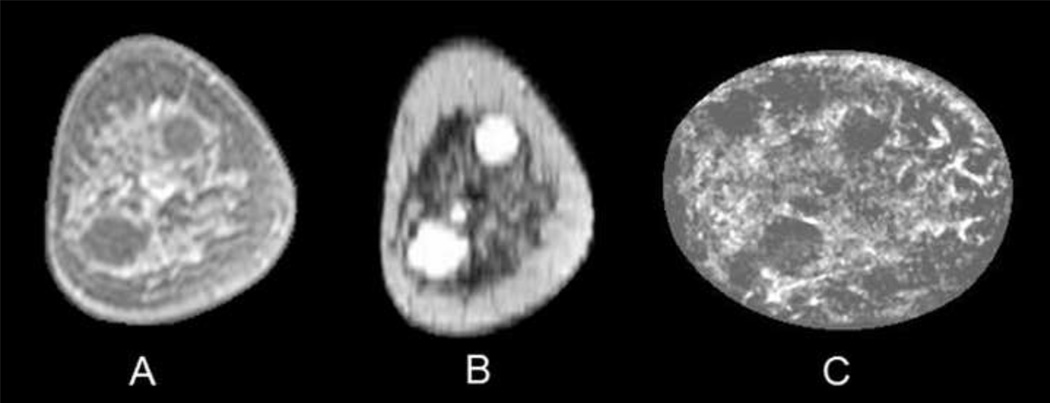
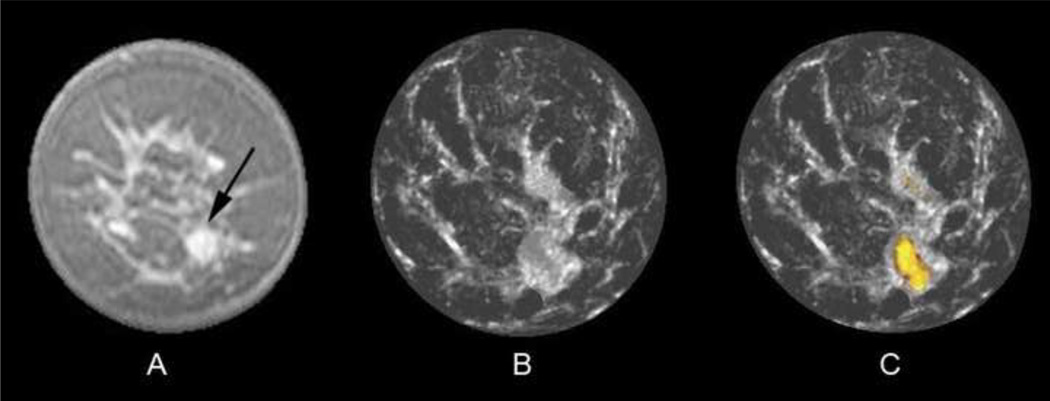
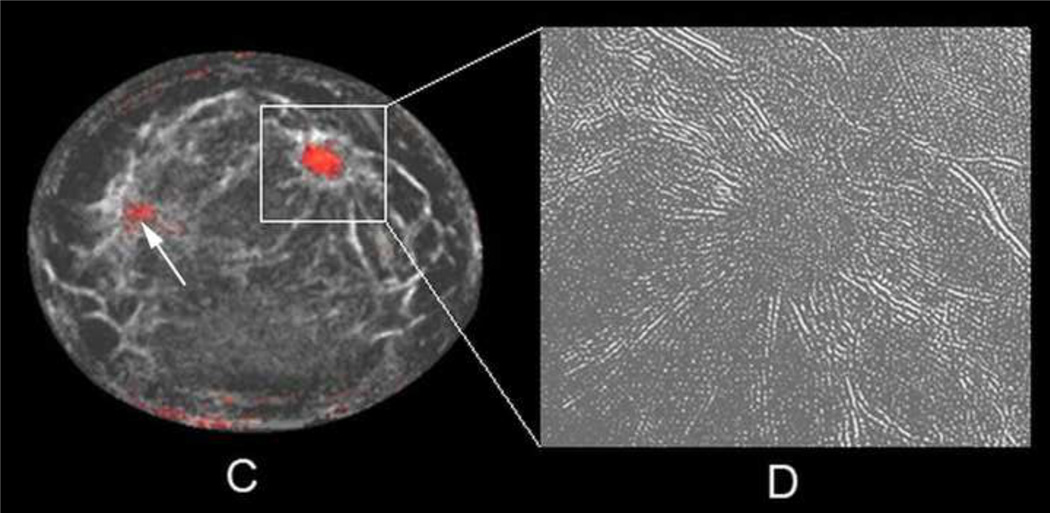
Utilizing the reflection image as background in the fused image, cysts could be identified by clearly defined smooth boundaries (Fig. 3). Other benign lesions, such as fibroadenomas, also demonstrated smooth boundaries, but the mass content was colored yellow in fused images when the .NOT. operation identified that only the sound speed threshold of 1.52 km/s was surpassed (Fig. 4). Reflection images suggested poor visualization of tumor margins for cancers (Fig. 5) in our small sample set, but the RF component of the reflection image (reflection image utilizing the raw acoustic signal with no envelop fitting) [26] also showed more discernible architectural distortion of the surrounding normal tissue than nearly all MR images (Fig. 5c/d).
Fig. 3.
Coronal T1 fat-saturated enhanced MR image (A) of a 52-year-old woman with heterogeneously dense breasts and two simple cysts in the 1 and 7 o'clock positions, which have much better contrast in the T2 image (B). Reflection UST image (C) shows these simple cysts which did not reach sound speed or attenuation thresholds for solid masses.
Fig. 4.
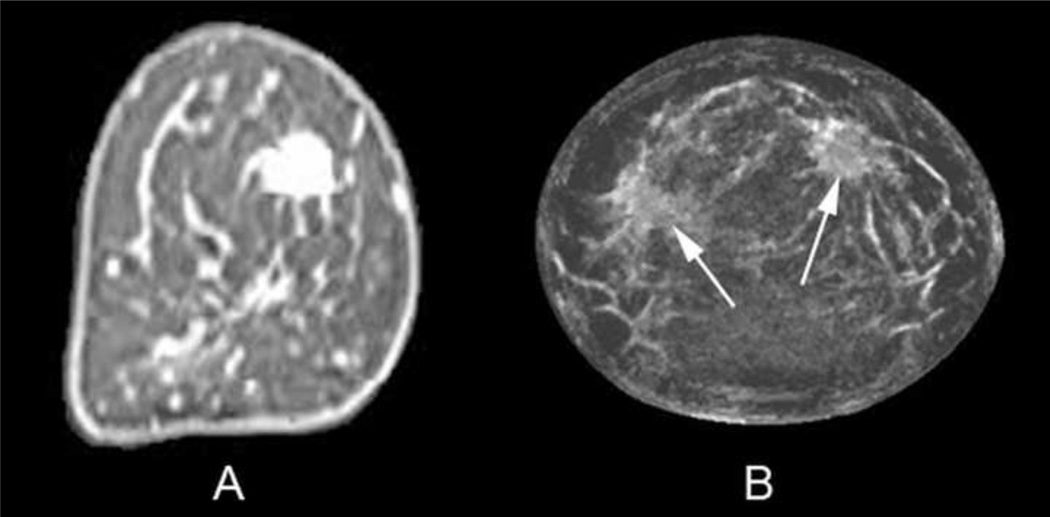
Coronal fat-saturated gadolinium-enhanced MR image (A) of a 43-year-old woman with a 1 cm fibroadenoma in the five o'clock position (arrow). UST image (B) after step #2 of the fusion process caused the fibroadenoma to be obscured by adjacent fibroglandular tissue since that entire region surpassed the sound speed threshold of 1.48 km/s. However, the final fused UST image (C) now shows the benign yellow overlay color from the .NOT. operator function, whereby the sound speed threshold of 1.52 km/s was surpassed but not the attenuation threshold.
Fig. 5.
Coronal T1 fat-saturated enhanced MR image (A) of a 56-year-old woman with a 1.7 cm invasive ductal carcinoma in the 1–2 o'clock position showing bright enhancement. Initial fused UST image after step #2 only shows 2 semi-transparent lighter gray regions (arrows) that achieved the first fibroglandular threshold of 1.48 kilometers per second. Final fused UST image (C) using the .AND. operator now produces a red overlay for the mass in the 1–2 o'clock position since it had both high sound speed and attenuation, whereas only a tiny a regular portion of the nine o'clock region surpassed both thresholds (arrow). Some parenchyma and/or fibrous band junctions can incidentally reach threshold (9–10:00 position) but were easily excluded as not having mass effect on several slices. Magnified reflection image using RF component (D) shows distinct mass effect with prominent architectural distortion corresponding to the region around the cancer seen in C.
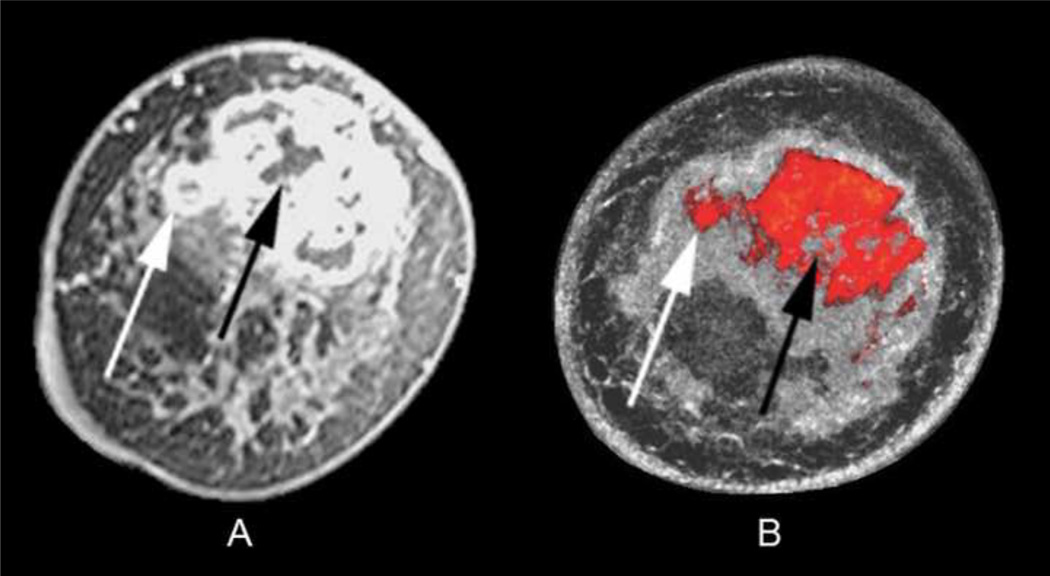
By applying our universal thresholds to the UST images, UST fusion images showed similar size and location of masses as compared to DCE-MR (Fig. 6). Furthermore, Fig. 6 emphasizes UST’s ability to accurately image the irregular, invasive margins of a carcinoma extending into parenchymal tissue without the use of contrast enhancement. Comparison of UST with standardized contrast-enhanced fat-saturated MR images showed that the UST depiction of tumor extent corresponded to mass margins identified by MR. In all cases, UST detected invasive ductal carcinoma (IDC) when present within the scanning range. DCIS was not part of the dataset for evaluation.
Fig. 6.
Coronal T1 fat-saturated enhanced MR image (A) showing a centrally necrotic 6.0 × 4.0 cm invasive ductal carcinoma in a 50-year-old African American woman with heterogeneously dense breasts. UST image after step 2–4 of the fusion process (B) highlights the extent of mass margins similar to MR, including both the exophytic nodular portion (white arrows) and central necrosis (black arrows), assuming slight position differences between scanning in water (UST) and air (MR). Note the dense parenchyma displayed as semi-transparent gray surrounding the red tumor but not obscuring it.
Of 36 patients with 55 masses noted on MR, 48 identified on UST. The 7 masses that UST did not detect were secondary masses that were not within the scanning range for that particular study. Lesion volumes were calculated from UST data by dimensional analysis and by applying our universal thresholds, and then compared to similarly determined volumes from MR. There was no significant difference between benign or malignant mass volumes by UST or MR (p>0.05).
DISCUSSION
Tumor extent by UST was demonstrated prospectively to be similar to DCE-MR when masses simultaneously exceeded thresholds of 1.52±0.03 km/s for sound speed (total variation regularized) and 0.16±0.04 dB/cm in attenuation. These values were attained by assessing their volumetric performance in accurately representing benign and malignant tissue distribution noted from MR as the anatomic gold standard. Specifically, this allowed fibroglandular tissue and tumors to have a similar volumetric appearance as on MR. However, UST thresholds for sound speed and attenuation cannot be directly compared with prior absolute literature values obtained from in vitro specimens and different ultrasound frequencies [29–30], or from relative in vivo measurements using standard US [31]. Indeed, our presented UST thresholds represent the first in vivo values obtained from tissue discrimination during automated whole-breast scanning. Prior in vivo measurements by limited angle tomography using a standard linear array transducer only obtained relative measurements from a specified region of interest and could not discriminate attenuation differences between fat, cancer and benign tissues [31]. Conversely, a UST ring array allows a full aperture for better signal-to-noise, particularly for attenuation estimates. While our UST thresholds were then prospectively used for all patients in this study, they only demonstrate the feasibility of creating a standardized imaging approach and do not reflect diagnostic values to discriminate benign from malignant tissue at this time. Such discrimination requires further evaluation of thresholds relative to surrounding normal tissue for each patient to better control for natural individual tissue variations. Evaluation of UST diagnostic performance is beyond the scope of this paper and will be thoroughly addressed in an upcoming manuscript evaluating patients undergoing breast biopsy. Again, the overall imaging rendering concept of UST is important to validate since technology improvements in future commercial units will further refine the absolute quantitative values and diagnostic thresholds needed for optimal tissue discrimination.
Qualitative comparison of the fused UST images with MR sequences using the above thresholds showed that UST images had similar mass contrast and overall appearance of T1 fat-saturated gadolinium-enhanced MR sequences. Anatomical differences can be accounted for by (i) dissimilar breast deformation under MR (air) and UST (water) examination conditions, (ii) lower spatial resolution of UST images and (iii) greater slice thickness associated with UST images. The concordance of breast anatomy visualized by UST and MR (Fig. 3) suggests that the effect of current reconstruction artifacts and errors associated with UST imaging are modest and do not limit the interpretation of the UST images. Furthermore, current UST artifacts, which are primarily Nyquist-based streak artifacts, will be markedly reduced as technology rapidly increases transducer number in the ring with associated improvements in reconstruction algorithms.
Benign masses tended to have similar properties to normal breast tissue. Consequently, their characterization relied on reflection images to detect smooth margins found with cysts (Fig. 3) and fibroadenomas. In addition to their smooth margins on reflection images, fibroadenomas could be visualized in the fused images when using the .NOT. operation (Fig. 4). Fibroadenomas normally exhibited higher sound speed compared to surrounding tissue but not much attenuation of the acoustic wave possibly due to their relatively homogeneous histology and minimal scirrhous reaction and/or lack of interaction with surrounding normal tissues. Conversely, cancers showed poor margin discrimination by reflection alone because of the reduced echo contrast of irregular margins due to peripheral invasion and/or tissue interaction. Therefore, the ability of reflection images to display architectural distortion of surrounding filamentous bands and/or connective tissue, as compared to the smooth margins of benign lesions, provides a potential means of predicting malignancy (Fig. 5).
In DCE-MR images, suspicious masses were primarily identified by their contrast enhancement. For fused UST images, suspicious masses were visualized as colorized regions that were above our currently specified threshold values of attenuation and sound speed. Color was needed in the fused image since gray-scale alone cannot display more than one quantified parameter. Color-coded thresholding of UST images therefore enhances the visibility of dense and/or stiff [30,31,34] breast masses, which appear to correspond as suspicious by DCE-MR (Fig. 6). Differentiation of malignant from parenchymal tissue was achieved without the use of contrast agents. This suggests that ultrasound tomography can effectively detect and characterize various breast lesions in a completely non-invasive manner, even in women with dense breasts. Under such a methodology, a suspicious lesion can be isolated in UST images more consistently than the same lesion in non-contrast MR images. Furthermore, this concordance provides justification for pursuing the UST method with the goal of leveraging its lower inherent cost (e.g. no large magnets, no shielding, and low cost of US transducers and electronics) and short exam times. Future studies utilizing microbubble-based contrast agents may provide further differentiation of UST images and improve diagnostic accuracy.
Of 55 reported masses from MR, UST was able to find 48. The UST exam missed 7 secondary masses that fell outside of its scanning range (i.e. limited scan range due to memory constraints on current prototype). This occasionally occurred for women with large breasts for whom the scanning range had to be centered on the location of the known primary mass. This limitation happened due to the UST prototype’s initial storage memory of 11 GB, which limited the number of slices that could be acquired. This limitation has now been removed (memory is now 22 GB) and will further improve in future commercial versions. Despite this limitation, UST was able to detect an additional three masses that were not originally reported in standard US or mammography, but were confirmed by MR. These results warrant further study in our larger series of biopsy-proven masses being finalized for publication.
Several weaknesses and limitations arise from our described methods. Despite quantitative analysis, much of our results were based on subjective comparisons between MR and UST. This, however, is warranted given our goal to prospectively define initial UST thresholds based on MR appearances, thereby using MR as the gold standard to validate the anatomic appearance of UST for both fibroglandular tissue distribution and tumor volumes. Information presented in this paper was meant to become a baseline as our prototype was being prepared for larger multi-center clinical trials. This will also facilitate further assessments of clinical relevance and specifications as a final commercial product is approached. UST’s ability to also detect and diagnose ductal carcinoma in situ (DCIS), or intramammary lymph nodes, is uncertain since they were not available for lesion analyses.
In summary, our pilot study has prospectively determined universal clinical threshold values that may be applied to UST images, thereby generating images showing similar overall breast anatomy and tumor conspicuity as DCE-MR, but without intravenous contrast. As UST technology continues to mature in commercial versions, the absolute thresholds will be refined, yet the overall concept of UST providing quantitative values for tissue discrimination appears secure. A strong concordance between UST- and MR-rendered breast anatomy was demonstrated, indicating that UST could provide a lower-cost alternative to MR for both diagnosis and automated volume-based assessments of breast characteristics, such as breast density [24, 25]. A forthcoming study from a larger cohort of biopsy patients will further address diagnostic performance of UST.
ACKNOWLEDGMENTS
The authors acknowledge that this work was support by a grant from the Michigan Economic Development Corporation (Grant Number 06-1-P1-0653). Special thanks to Olsi Rama, Lisa Bey-Knight, David Kunz, Erik West, and Amy Szczepanski for their contributions to this project.
REFERENCES
- 1.Lehman CD, Isaacs C, Schnall MD, Pisano ED, Ascher SM, Weatherall PT, et al. Cancer yield of mammography, MR, and US in high-risk women: prospective multi-institution breast cancer screening study. Radiology. 2007;244:381–388. doi: 10.1148/radiol.2442060461. [DOI] [PubMed] [Google Scholar]
- 2.Saslow D, Boetes C, Burke W, Harms S, Leach MO, Lehman CD, et al. American Cancer Society Breast Cancer Advisory Group. American Cancer Society guidelines for breast screening with MRI as an adjunct to mammography. CA Cancer J Clin. 2007;57:75–89. doi: 10.3322/canjclin.57.2.75. [DOI] [PubMed] [Google Scholar]
- 3.Uematsu T, Yuen S, Kasami M, Uchida Y. Comparison of magnetic resonance imaging, multidetector row computed tomography, ultrasonography, and mammography for tumor extension of breast cancer. Breast Cancer Res Treat. 2008;112:461–474. doi: 10.1007/s10549-008-9890-y. [DOI] [PubMed] [Google Scholar]
- 4.Neubauer H, Li M, Kuehne-Heid R, Schneider A, Kaiser WA. High grade and non-high grade ductal carcinoma in situ on dynamic MR mammography: characteristic findings for signal increase and morphological pattern of enhancement. Br J Radiol. 2003;76:3–12. doi: 10.1259/bjr/14883856. [DOI] [PubMed] [Google Scholar]
- 5.Onesti JK, Mangus BE, Helmer SD, et al. Breast cancer tumor size: correlation between magnetic resonance imaging and pathology measurements. Am J Surg. 2008;196:844–850. doi: 10.1016/j.amjsurg.2008.07.028. [DOI] [PubMed] [Google Scholar]
- 6.Schnall MD. Breast imaging technology: Application of magnetic resonance imaging to early detection of breast cancer. Breast Cancer Res. 2001;3:17–21. doi: 10.1186/bcr265. [DOI] [PMC free article] [PubMed] [Google Scholar]
- 7.Warren RM, Pointon L, Thompson D, et al. Reading protocol for dynamic contrast enhanced MR images of the breast: sensitivity and specificity analysis. Radiology. 2005;236:779–788. doi: 10.1148/radiol.2363040735. [DOI] [PubMed] [Google Scholar]
- 8.Kuhl CK, Schild HH. Dynamic image interpretation of MRI of the breast. J Magn Reson Imaging. 2000;12:965–974. doi: 10.1002/1522-2586(200012)12:6<965::aid-jmri23>3.0.co;2-1. [DOI] [PubMed] [Google Scholar]
- 9.Bartella L, Smith CS, Dershaw DD, Liberman L. Imaging breast cancer. Radiol Clin North Am. 2007;45:45–67. doi: 10.1016/j.rcl.2006.10.007. [DOI] [PubMed] [Google Scholar]
- 10.Schnall MD. Breast MR imaging. Radiol Clin North Am. 2003;41:43–50. doi: 10.1016/s0033-8389(03)00068-4. [DOI] [PubMed] [Google Scholar]
- 11.Chen W, Giger ML, Lan L, Bick U. Computerized interpretation of breast MRI: investigation of enhancement-variance dynamics. Med Phys. 2004;31:1076–1082. doi: 10.1118/1.1695652. [DOI] [PubMed] [Google Scholar]
- 12.Chen W, Giger ML, Li H, Bick U, Newstead GM. Volumetric texture analysis of breast lesions on contrast-enhanced magnetic resonance images. Magn Reson Med. 2007;58:562–571. doi: 10.1002/mrm.21347. [DOI] [PubMed] [Google Scholar]
- 13.Wiener JI, Schilling KJ, Adami C, Obuchowski NA. Assessment of suspected breast cancer by MRI: a prospective clinical trial using a kinetic and morphologic analysis. Am J Roentgenol. 2005;184:878–886. doi: 10.2214/ajr.184.3.01840878. [DOI] [PubMed] [Google Scholar]
- 14.Moore SG, Shenoy PJ, Fanucchi L, et al. Cost-effectiveness of MR compared to mammography for breast cancer screening in a high risk population. BMC Health Serv Res. 2009;9:9. doi: 10.1186/1472-6963-9-9. [DOI] [PMC free article] [PubMed] [Google Scholar]
- 15.Andre MP, Janee HS, Martin PJ, Otto GP, Spivey BA, Palmer DA. High-speed data acquisition in a diffraction tomography system employing large-scale toroidal arrays. International Journal of Imaging Systems and Technology. 1997;8:137–147. [Google Scholar]
- 16.Johnson SA, Tracy ML. Inverse scattering solutions by a sinc basis, multiple source, moment method. Part I: Theory, Ultrasonic Imaging. 1983;5:361–375. doi: 10.1177/016173468300500406. [DOI] [PubMed] [Google Scholar]
- 17.Schreiman JS, Gisvold JJ, Greenleaf JF, Bahn RC. Ultrasound transmission computed tomography of the breast. Radiology. 1984;150:523–530. doi: 10.1148/radiology.150.2.6691113. [DOI] [PubMed] [Google Scholar]
- 18.Natterer FA. Propagation-backpropagation method for ultrasound tomography, inverse problems. 1995;11:1225–1232. [Google Scholar]
- 19.Liu DL, Waag RC. Propagation and backpropagation for ultrasonic wavefront design. IEEE Trans. on Ultras. Ferro. and Freq. Contr. 1997;44:1–13. doi: 10.1109/58.585184. [DOI] [PubMed] [Google Scholar]
- 20.Ranger B, Littrup P, Duric N, et al. Breast Imaging with acoustic tomography: a comparative study with MRI. Proceedings of the SPIE. Medical Imaging 2009: Ultrasonic Imaging and Signal Processing. Vol. 7265 [Google Scholar]
- 21.Duric N, Littrup P, Poulo L, et al. Detection of breast cancer with ultrasound tomography: First results with the computerized ultrasound risk evaluation (CURE) prototype. Med. Phys. 2007;34:773–785. doi: 10.1118/1.2432161. [DOI] [PubMed] [Google Scholar]
- 22.Duric N, Littrup P, Babkin A, et al. Development of ultrasound tomography for breast imaging: technical assessment. Med. Phys. 2005;32:1375–1386. doi: 10.1118/1.1897463. [DOI] [PubMed] [Google Scholar]
- 23.Li C, Duric N, Littrup P, Huang L. In vivo breast sound-speed imaging with ultrasound tomography. Ultrasound in Med. & Biol. 2009;35:1615–1628. doi: 10.1016/j.ultrasmedbio.2009.05.011. [DOI] [PMC free article] [PubMed] [Google Scholar]
- 24.Glide-Hurst CK, Duric N, Littrup P. A new method for quantitative analysis of mammographic density. Med Phys. 2007;34:4491–4498. doi: 10.1118/1.2789407. [DOI] [PubMed] [Google Scholar]
- 25.Glide-Hurst CK, Duric N, Littrup P. Volumetric breast density evaluation from ultrasound tomography images. Med Phys. 2008;35:3988–3997. doi: 10.1118/1.2964092. [DOI] [PubMed] [Google Scholar]
- 26.Schmidt S, Duric N, Li C, Roy O, Huang Z. Modification of Kirchhoff migration with variable sound speed and attenuation for acoustic imaging of media and application to tomographic imaging of the breast. Med Phys. 2011;38:998–1007. doi: 10.1118/1.3539552. [DOI] [PMC free article] [PubMed] [Google Scholar]
- 27.Goss SA, Johnston RL and Dunn F. Comprehensive compilation of empirical ultrasonic properties of mammalian tissues. J Acoust Soc AM. 1978;64:423–457. doi: 10.1121/1.382016. [DOI] [PubMed] [Google Scholar]
- 28.Duck FA. Physical properties of tissue. London: Academic Press; 1990. [Google Scholar]
- 29.Edmonds PD, Mortensen CL, Hill JR, Holland SK, Jensen JF, Schattner P, Valdes AD. Ultrasound tissue characterization of breast biopsy specimens. Ultrasound Imaging. 1991;13:162–185. doi: 10.1177/016173469101300204. [DOI] [PubMed] [Google Scholar]
- 30.Weiwad W, Heinig A, Goetz L, Hartmann H, Lampe D, Buchman J, et al. Direct measurement of sound velocity in various specimens of breast tissue. Invest Radiol. 2000;35:721–726. doi: 10.1097/00004424-200012000-00005. [DOI] [PubMed] [Google Scholar]
- 31.Chang CH, Huang SW, Yang HC, Chou YH, Li PC. Reconstruction of ultrasonic sound velocity and attenuation coefficient using linear arrays: Clinical assessment. Ultrasound Med Biol. 2007;33:1681–1687. doi: 10.1016/j.ultrasmedbio.2007.05.012. [DOI] [PubMed] [Google Scholar]
- 32. [Accessed August 2, 2009];ImageJ Web site. http://rsbweb.nih.gov/ij/
- 33.American College of Radiology. Illustrated breast imaging reporting and data system (BI-RADS) 3rd ed. Reston, VA: American College of Radiology; 1998. [Google Scholar]
- 34.Satake H, Nishio A, Ikeda M, Ishigaki S, Shimamoto K, Hirano M, Naganawa S. Predictive value for malignancy of suspicious breast masses of BI-RADS categories 4 and 5 using ultrasound elastography and MR diffusion-weighted imaging. AJR Am J Roentgenol. 2011;196:202–209. doi: 10.2214/AJR.09.4108. [DOI] [PubMed] [Google Scholar]


